A method for detecting fiber distribution in mixed fiber products

A technology of mixed fibers and detection methods, which is applied in image analysis, measurement devices, analysis materials, etc., can solve problems such as the inability to intuitively reflect the distribution of mixed fiber webs, and the inability to evaluate the uniformity of fiber webs.

Active Publication Date: 2019-03-12
TIANJIN POLYTECHNIC UNIV
View PDF5 Cites 5 Cited by
  • Summary
  • Abstract
  • Description
  • Claims
  • Application Information

AI Technical Summary

Problems solved by technology

[0002] Traditional fiber web detection methods such as sampling weighing method, thickness measurement method and radioisotope measurement method can accurately analyze the uniformity of fiber webs composed of single fibers, but cannot evaluate the uniformity of fiber webs composed of mixed fibers. In particular, it cannot intuitively reflect the distribution of each fiber in the mixed fiber web. With the continuous development of image processing technology, due to its advantages such as high processing precision, good reproducibility, and diverse processing, this technology It is widely used to characterize the structural characteristics of fiber webs, mainly including the study of fiber orientation distribution of nonwoven material webs, the detection of fiber web porosity, and the determination of fiber web uniformity, and has achieved good application results. However, the above image processing methods are more aimed at the detection of performance indicators of fiber webs composed of single fibers, and less research has been done on the detection of fiber distribution in fiber webs composed of mixed fibers. This patent combines multi-level stochastic resonance technology , the method of image p...

Method used


Image

  • A method for detecting fiber distribution in mixed fiber products
  • A method for detecting fiber distribution in mixed fiber products
  • A method for detecting fiber distribution in mixed fiber products

Examples


Embodiment 1

[0037] Taking glass fiber / polyester fiber mixed fiber mesh products as an example, the fiber ratio and grouping are shown in Table 1 to illustrate the feasibility of this method.

[0038] Table 1

[0039]

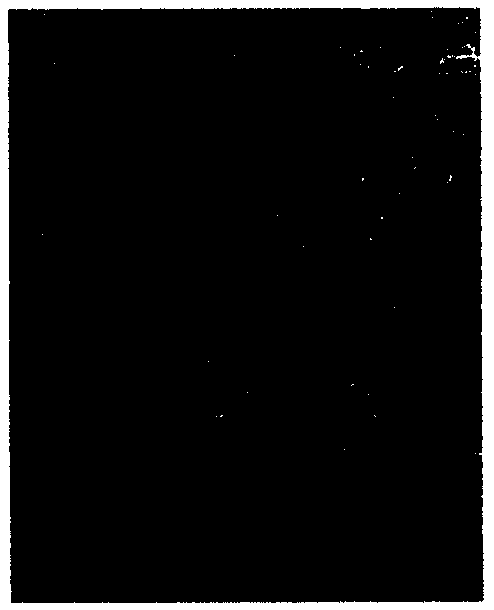
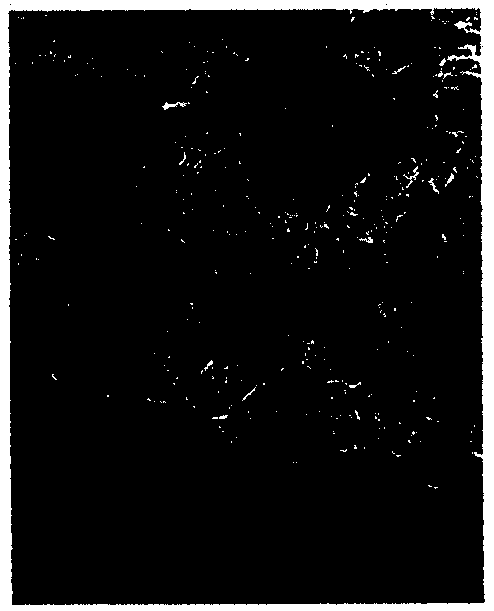
[0040] First, use the image collector to randomly collect the fiber web image made of the fourth group of mixed fiber ratios in Table 1, with a pixel size of 3000 pixels × 4000 pixels (such as figure 2 shown), the collected image is denoised and grayscaled using Sobel filter method and weighted average method (such as image 3 shown).

[0041] Due to the difference in light sensitivity between glass fiber and polyester fiber, using this feature, figure 2 The white part is glass fiber, and the black part is polyester fiber. In this paper, glass fiber is set as the target fiber and polyester fiber is set as the non-target fiber according to the actual needs of the project.

[0042] First, use Matlab to invert and reduce the order of the collected original image, the r...

Embodiment 2

[0047] In order to prove that this patent can be applied to other types of mixed fiber products, this paper also takes basalt fiber / polyester fiber mixed fiber mesh products as an example, and the fiber ratio and grouping are shown in Table 2.

[0048] Table 2

[0049]

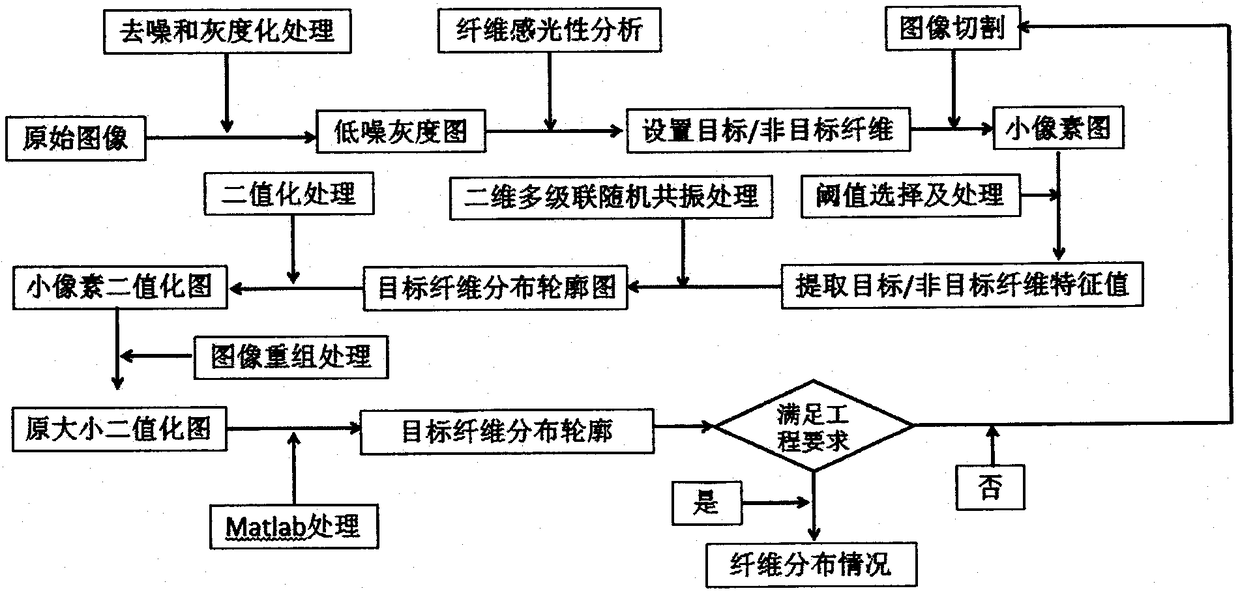
[0050] Image processing flow such as figure 1 As shown, the specific steps are as follows:

[0051] First, use the image collector to randomly collect the fiber web image made of the fourth group of mixed fiber ratios in Table 2, with a pixel size of 3000 pixels × 4000 pixels (such as Figure 13 shown), the collected image is denoised and grayscaled using Sobel filter method and weighted average method (such as Figure 14 shown).

[0052]Due to the difference in light sensitivity between glass fiber and polyester fiber, using this feature, Figure 13 The white part is basalt fiber, and the black part is polyester fiber. In this paper, basalt fiber is set as the target fiber and polyester fiber is set as...


PUM


Abstract

The invention discloses a method for detecting the fiber distribution in a mixed fiber product. The method comprises the following steps: 1, collecting an original image of the mixed fiber product, and obtaining a low-noise gray scale image through denoising and gray scale transformation; 2, setting any fiber as target or non-target fibers; 3, cutting that image of the step '1' into small pixel maps, and selecting an appropriate threshold value to process the small pixel maps; 4, extracting that eigenvalue of the non-target fiber as noise, performing two-dimensional multi-level stochastic resonance on the image of the step '3', and extracting the target fiber accord to the result; 5, binarizing that image of the step '4', recombine the small images into the binarized images of the original size accord to the original cutting order, if the binarized images can display the target fiber outline, carrying out the next step, otherwise returning to the step '4'; 6, counting that number of target fib pixels of the restored image, and giving the fib distribution value of the mixed fiber product. By extracting the eigenvalues of the target and non-target fibers and by removing the non-target fibers to highlight the target fibers, the present invention has the advantages of simple operation and high processing accuracy.

Description

technical field [0001] The invention relates to the field of non-woven equipment, in particular to the detection of fiber distribution in mixed fiber products. Background technique [0002] Traditional fiber web detection methods such as sampling weighing method, thickness measurement method and radioisotope measurement method can accurately analyze the uniformity of fiber webs composed of single fibers, but cannot evaluate the uniformity of fiber webs composed of mixed fibers. In particular, it cannot intuitively reflect the distribution of each fiber in the mixed fiber web. With the continuous development of image processing technology, due to its advantages such as high processing precision, good reproducibility, and diverse processing, this technology It is widely used to characterize the structural characteristics of fiber webs, mainly including the study of fiber orientation distribution of nonwoven material webs, the detection of fiber web porosity, and the determinat...

Claims


Application Information

Patent Timeline
IPC IPC(8): G06T7/00G06T7/136G01N21/84
CPCG06T7/0004G06T7/136G01N21/84G06T2207/30124G01N2021/8444
Inventor 邓辉梁振江张杰朱珍军
Owner TIANJIN POLYTECHNIC UNIV
Why Eureka
Try Eureka