Data difference analysis method and system based on probability density estimation

A probability density distribution and probability density technology, applied in the field of data analysis, which can solve problems such as lack of statistical significance and data distribution limitations

Active Publication Date: 2019-09-17
HUAZHONG UNIV OF SCI & TECH
View PDF6 Cites 0 Cited by
  • Summary
  • Abstract
  • Description
  • Claims
  • Application Information

AI Technical Summary

Problems solved by technology

[0003] The invention solves the technical problem that the data difference analysis method in

Method used


Image

  • Data difference analysis method and system based on probability density estimation
  • Data difference analysis method and system based on probability density estimation
  • Data difference analysis method and system based on probability density estimation

Examples


Embodiment 1

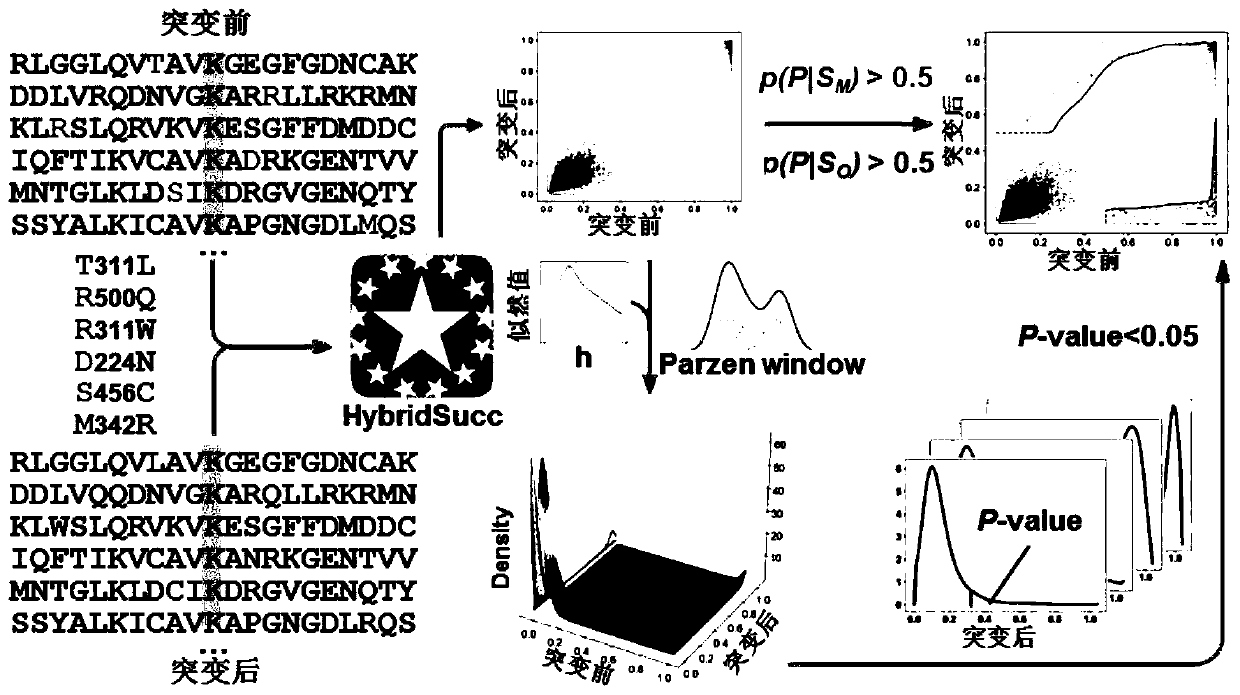
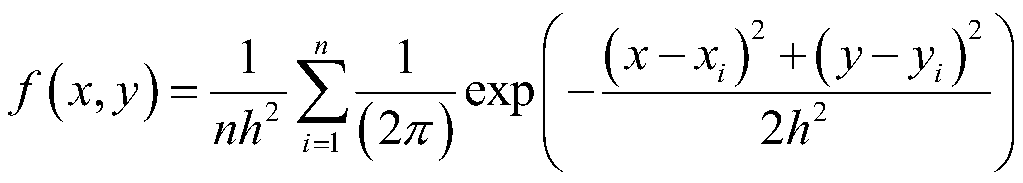
[0026] We applied the inventive method to predict mutations that significantly affect existing succinylation sites. This facilitates the discovery of genes that affect cancer through altered succinylation networks and provides insights into disease biology and therapeutic development. In the analysis of the effect of mutations on succinylation, we integrated 1,779,214 missense mutations from 11,659 tumor samples of 33 major cancer types / subtypes from the cancer gene database The Cancer Genome Atlas (TCGA). Among them, 63693 missense mutations (KsuMs) occurred around the lysine site (10 amino acids on the left and right sides). Such as figure 1 As shown, we used the succinylation site prediction platform to obtain probability scores for 63693 peptides containing KsuMs, and the probability scores reflected the degree of succinylation at the site. Then, use the Parzen window method based on the Gaussian kernel to estimate the joint probability density of the Bayesian posterior ...


PUM


Abstract

The invention discloses a data difference analysis method and system based on probability density estimation, and belongs to the field of data analysis. The method comprises the following steps of firstly, establishing a data set, wherein the data in the data set changes; estimating the joint probability of the data before and after the change by using a probability density estimation method; selecting an optimal window width according to a maximum likelihood method, for different window widths, taking any one point in the data set every time, constructing the joint probability distribution by using the rest points in the data set, calculating a joint probability density value of the any one point on the joint probability distribution, obtaining a product of a plurality of joint probability density values as a likelihood value, and enabling the window width with the maximum likelihood value to be the optimal window width; and obtaining the data joint probability density distribution before and after change through the probability density estimation method according to the optimal window width, and analyzing the data difference. According to the method, the significance degree of each piece of data can be obtained without being limited by the data distribution and is used for discovering the remarkably changed data.

Description

technical field [0001] The present invention relates to the field of data analysis, and more specifically, to a data difference analysis method and system based on probability density estimation. Background technique [0002] Data that changes significantly are often critical. For example, through protein mass spectrometry, we can obtain the expression levels of each protein in the experimental group and the control group, and proteins with significant differences in expression may play a key regulatory role in this process. People often look for differential proteins based on the multiple of difference, and think that the protein with a larger multiple of change is more significantly different. However, in most cases, this assumption cannot be established. For example, if 1 becomes 2 and 10 becomes 20, the change is 2 times, but it does not mean that the difference is the same in significance. Another example is the amino acid mutation that affects the protein modificatio...

Claims


Application Information

Patent Timeline
IPC IPC(8): G06F16/2455G06F16/2458G16B20/50G16B35/00G16B40/00
CPCG06F16/24568G06F16/2462G06F16/2465G16B20/50G16B35/00G16B40/00
Inventor 薛宁宁万山许浩东邓万锟郭亚萍
Owner HUAZHONG UNIV OF SCI & TECH
Why Eureka
Try Eureka