Frequency spectrograph and method for measuring low-level signal through trace of frequency spectrograph

A low-level signal and trace technology, applied in the field of spectrum analyzer, can solve problems such as poor processing speed and stability, inaccurate measurement of low-level signals, and unstable signal waves

Inactive Publication Date: 2019-12-03
青岛汉泰智能科技有限公司
View PDF1 Cites 2 Cited by
  • Summary
  • Abstract
  • Description
  • Claims
  • Application Information

AI Technical Summary

Problems solved by technology

[0002] The spectrum analyzer plays a very important role in the development of the electronic device industry. For the BUG of some electronic instruments, the frequency domain can be checked through the signal detection through the spectrum analyzer, and the errors of the electronic equipment can be tested by detecting parameters such as frequency and span. The application number is 201510067056.3, which discloses a spectrum analyzer, which mainly uses multiple radio frequency receiving chips for radio frequency transceiver control, but the spectrum analyzer of this technology can only measure some simple signals, and cannot accurately measure some low-level small s

Method used


Image

  • Frequency spectrograph and method for measuring low-level signal through trace of frequency spectrograph
  • Frequency spectrograph and method for measuring low-level signal through trace of frequency spectrograph
  • Frequency spectrograph and method for measuring low-level signal through trace of frequency spectrograph

Examples


Embodiment 1

[0097] Embodiment 1, measure low-level signal by reducing input loss:

[0098] Referring to Figure 8(b), when the signal is very close to the noise floor, when the signal is measured by a spectrum analyzer, its level will be affected by the input attenuator. The traces of low-level signals will also be separated from the traces of noise on the display screen, and the traces of relatively low-level signals can be directly measured and observed, thereby eliminating the noise caused by low-level signals limits;

[0099] Specifically, the specific operation in the spectrum analyzer of the present invention is as follows: first reset the spectrum analyzer, the horizontal axis (X axis) represents the signal source frequency, the unit uses HZ, the vertical axis (Y axis) represents the amplitude, and the vertical axis unit uses dBm, and the horizontal axis Set the axis and vertical axis to 1GHz and -80dBm respectively, connect the RF signal output port of the signal source to the RF ...

Embodiment 2

[0100] Example 2, measuring low-level signals by reducing the resolution bandwidth:

[0101] Referring to Figure 8(c), the internal noise level is affected by the resolution bandwidth, but the continuous wave signal is not affected by the resolution bandwidth, so the resolution bandwidth (RBW) is reduced by 10 times, and the noise floor is also reduced by 10dB. However, the low-level signal will not decrease with the narrowing of the resolution bandwidth, so the low-level signal will be distinguished from the noise, and it is enough to directly measure or observe the low-level signal trace, thereby eliminating the low-level signal limited by noise;

[0102] Specifically, the specific operations in the spectrum analyzer of the present invention are as follows: first, the spectrum analyzer is reset, the horizontal axis (X axis) represents the signal source frequency, the unit uses HZ, the vertical axis (Y axis) represents the amplitude, and the vertical axis unit uses dBm. Set ...

Embodiment 3

[0103] Embodiment 3, measure the low-level signal by taking the average trace of the trace:

[0104] Referring to Figure 8(d), add the current value of the track point of each trace to the previous average value and then take the average. When the spectrum analyzer is automatically coupled, the detection will be sampled, so that the displayed noise level Smoothing, can effectively distinguish low-level signal and noise, and directly measure low-level signal, eliminating the influence of noise on low-level signal measurement.

[0105]Specifically, the specific operations in the spectrum analyzer of the present invention are as follows: first reset the spectrum analyzer, the horizontal axis (X axis) represents the signal source frequency, the unit uses HZ, the vertical axis (Y axis) represents the amplitude, and the vertical axis unit uses dBm. Set the horizontal axis and vertical axis to 1GHz and -80dBm respectively, connect the RF signal output port of the signal source to the...


PUM


Abstract

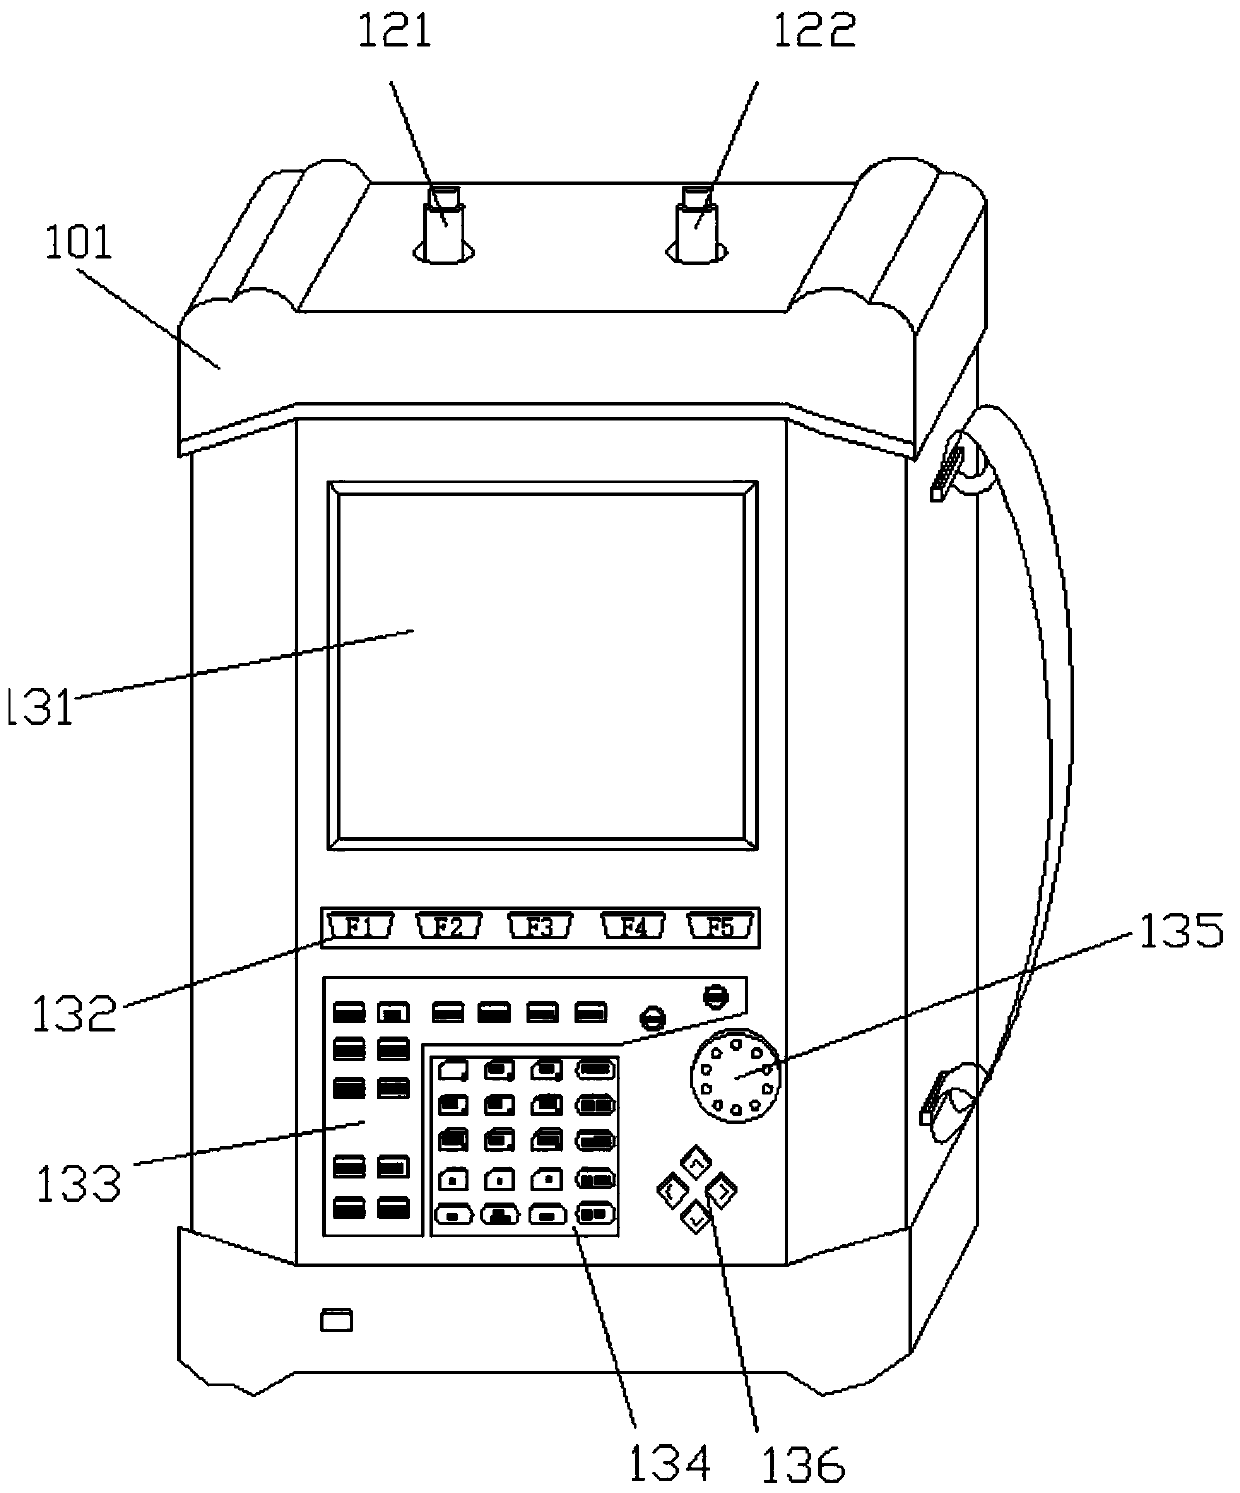
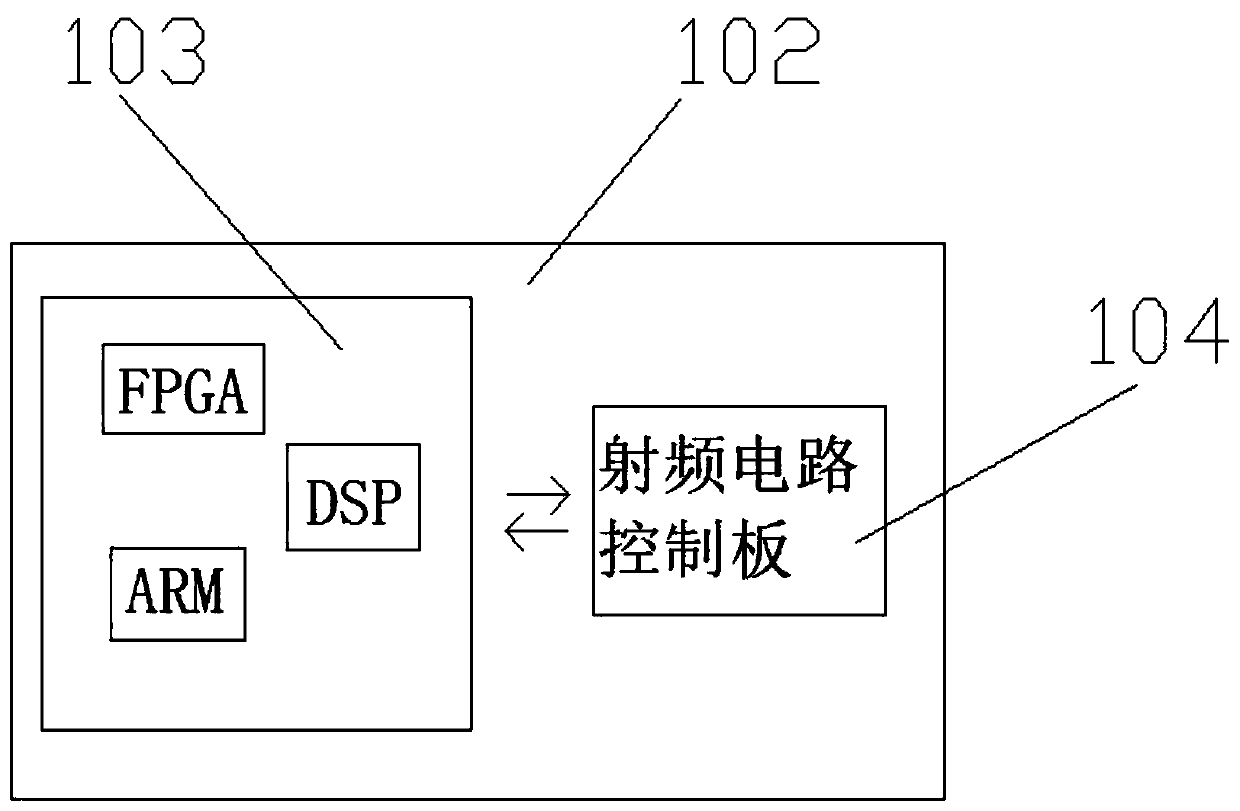
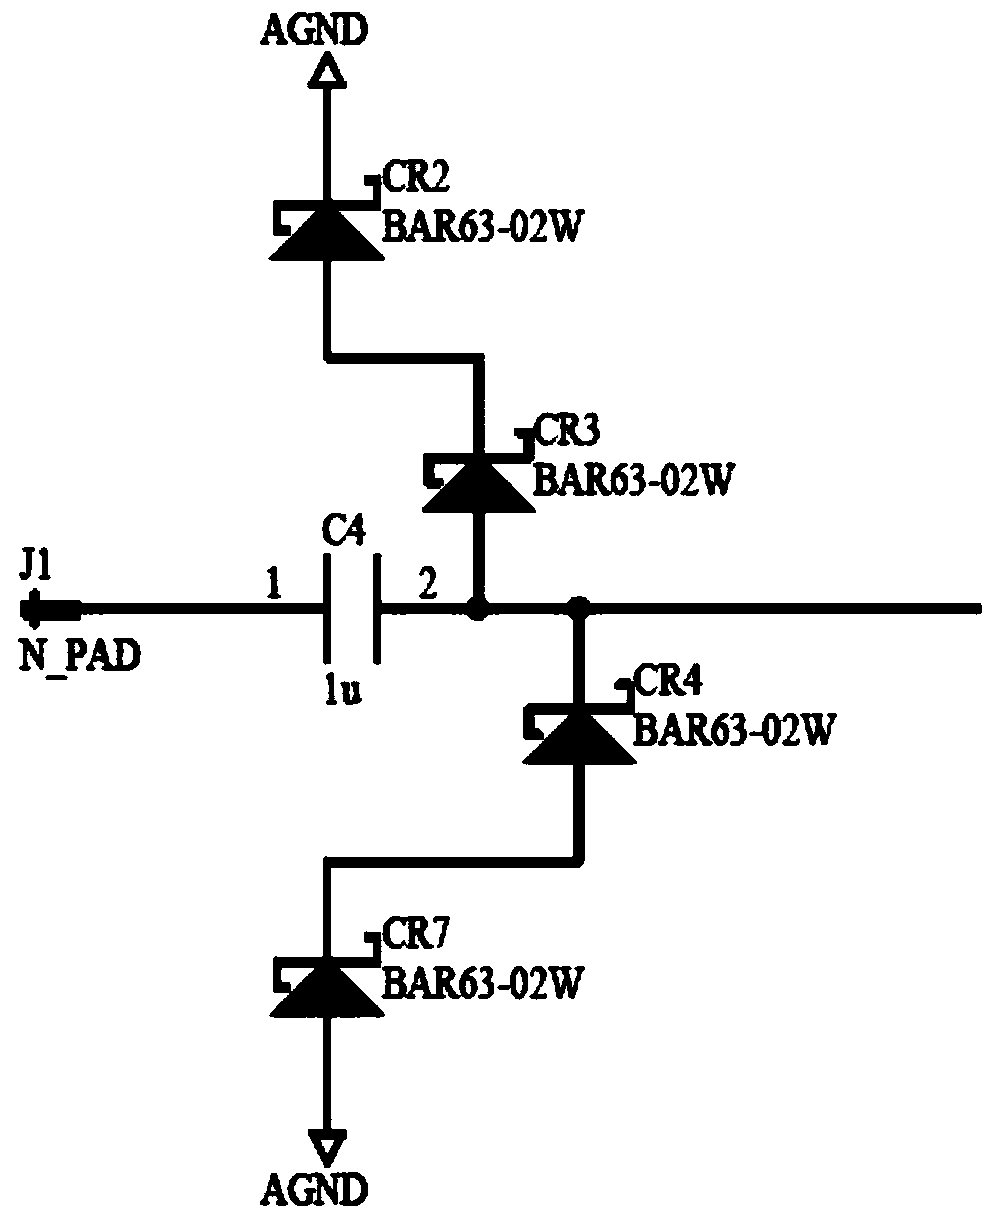
The invention provides a frequency spectrograph and a method for measuring a low-level signal through a trace of the frequency spectrograph. The frequency spectrograph comprises a packaging shell; anintegrated circuit board is arranged in the packaging shell and includes a main control circuit board and an auxiliary control circuit board; the auxiliary control circuit board is electrically connected with the main control circuit board through a flat cable; and the main control circuit board mainly comprises an FPGA (field programmable gate array), an ARM and a DSP (digital signal processor).According to the invention, the processing speed is greatly improved; mutual labor division definition is realized; working efficiency is improved. The radio frequency control circuit board is specially designed; a radio frequency input signal is subjected to three-stage frequency mixing to finally obtain an intermediate frequency of 10.7 MHz; the low-level signal is measured by reducing the inputloss, reducing the resolution bandwidth and taking the average trace of the trace; the low-level signal can be separated from the noise; and the low-level signal can be measured more easily and observation and comparison are performed by the trace.

Description

technical field [0001] The invention relates to the technical field of spectrum analyzers, in particular to a spectrum analyzer and a method for measuring low-level signals with its traces. Background technique [0002] The spectrum analyzer plays a very important role in the development of the electronic device industry. For the BUG of some electronic instruments, the frequency domain can be checked through the signal detection through the spectrum analyzer, and the errors of the electronic equipment can be tested by detecting parameters such as frequency and span. The application number is 201510067056.3, which discloses a spectrum analyzer, which mainly uses multiple radio frequency receiving chips for radio frequency transceiver control, but the spectrum analyzer of this technology can only measure some simple signals, and cannot accurately measure some low-level small signals. And it is composed of multiple radio frequency receiving chips, and the processing speed and s...

Claims


Application Information

Patent Timeline
IPC IPC(8): G01R23/167
CPCG01R23/167
Inventor 郝春华
Owner 青岛汉泰智能科技有限公司
Why Eureka
Try Eureka