3D visual analysis method for rail transit passenger flow OD data

A technology for rail transit and analysis methods, which is applied in other database browsing/visualization, network data browsing optimization, data processing applications, etc. The effect of driving safety and improving work efficiency

Inactive Publication Date: 2020-01-14
ZHEJIANG SUPCON INFORMATION TECH CO LTD
View PDF5 Cites 7 Cited by
  • Summary
  • Abstract
  • Description
  • Claims
  • Application Information

AI Technical Summary

Problems solved by technology

Generally speaking, the visualization methods of traditional charts mainly include line charts, histograms, and relationship diagrams, etc., but the above methods are limited in applicable scenarios and cannot display high-dimensional data attributes in a limited plane; data visualization methods based on spatial dimensions mainly use Geospatial locations are coordinates, and the data points are directly marked on the map, but it is easy to cause line segments to cross, overlap, and cover up
To sum up, the current visualization methods are mainly based on 2D planes, which cannot intuitively and clearly display the characteristics of rail transit data.

Method used


Image

  • 3D visual analysis method for rail transit passenger flow OD data
  • 3D visual analysis method for rail transit passenger flow OD data
  • 3D visual analysis method for rail transit passenger flow OD data

Examples


Embodiment Construction

[0027] The present invention will be further described below in conjunction with the accompanying drawings and specific embodiments.

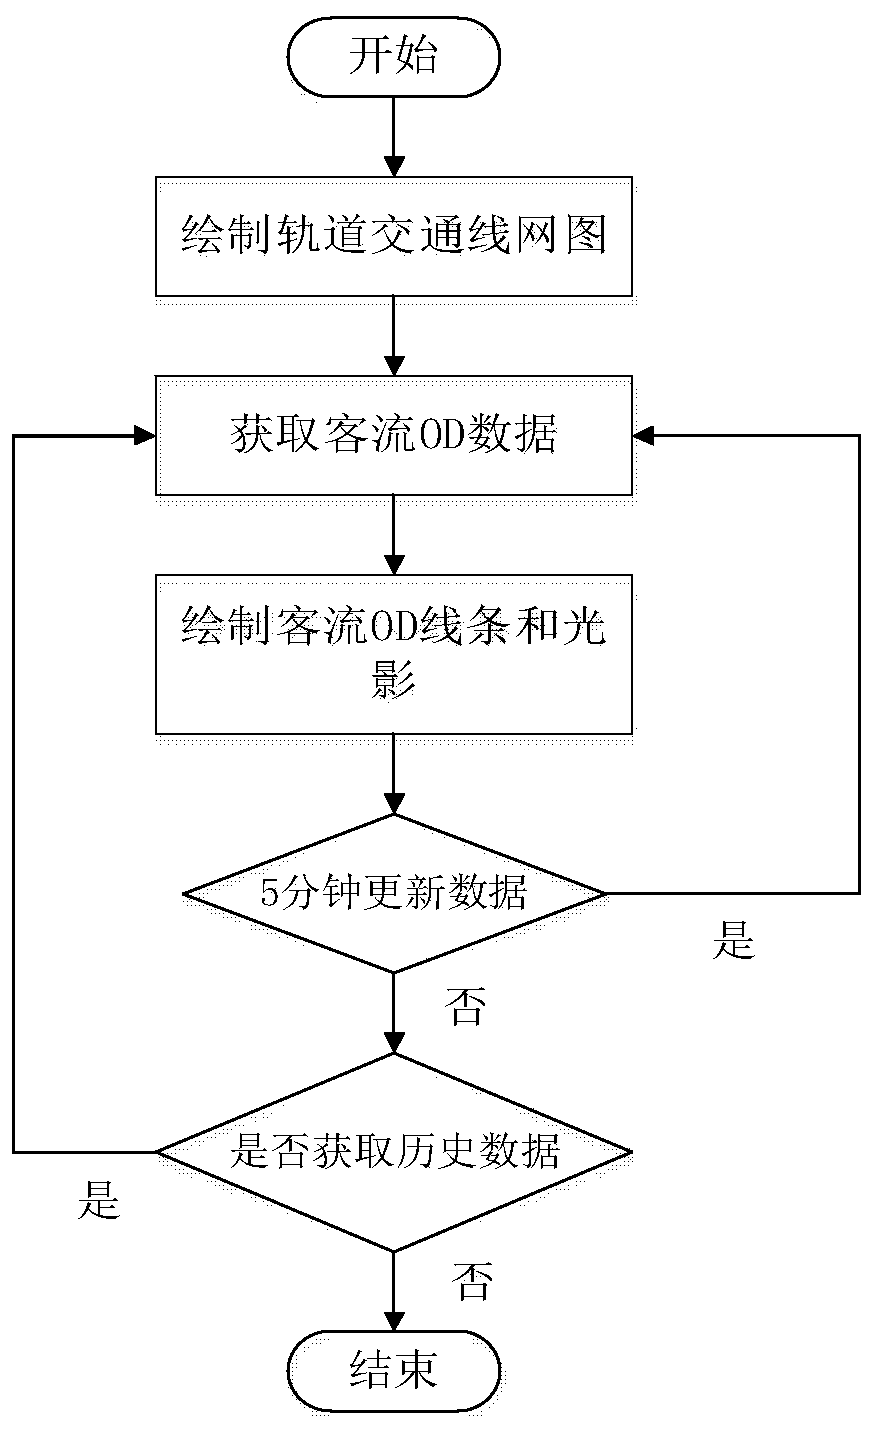
[0028] Such as figure 1 The illustrated embodiment is a 3D visual analysis method for rail transit passenger flow OD data, comprising the steps of:

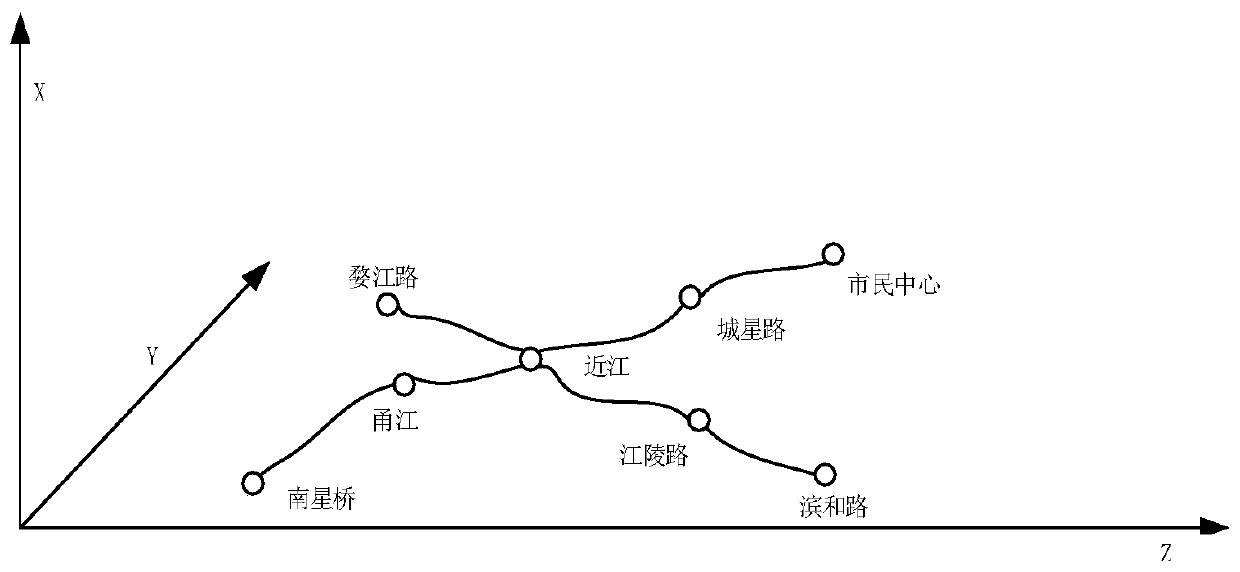
[0029] (1-1) Utilize the Canvas component to draw a rail transit 3D line network diagram of a certain city in the webpage; the present invention takes Hangzhou as an example, and its rail transit line network schematic diagram, such as figure 2 shown.

[0030] (1-2) Secondly, obtain passenger flow OD data between any station A and other stations from the background interface, as shown in Table 1:

[0031] Table 1 Example of five-minute passenger flow OD data

[0032] starting point end Passenger flow (person) South Star Bridge Omi 254 Civic Center Omi 468 Jiangling Road Omi 85

[0033] Judging the size of the passenger flow according ...


PUM


Abstract

The invention discloses a 3D visual analysis method for rail transit passenger flow OD data. The 3D visual analysis method comprises the following steps: drawing a rail transit 3D line network diagramof a certain city in a webpage by utilizing a Canvas component; obtaining passenger flow OD data between any station A and other stations, and judging the passenger flow volume according to the passenger flow OD data and the passenger flow volume quantification rule; and calculating an interval where the passenger flow OD quantized value alpha between the station A and any station B adjacent to the station A is located, judging passenger flow volumes of the two stations in the time period, and selecting a colored 3D line to connect the station A and the station B to form a visual passenger flow OD relationship. The method has the advantages that rail transit passenger flow OD data is visually analyzed in a clear and visual mode, and workers can conveniently, rapidly and visually know therail transit passenger flow distribution situation.

Description

technical field [0001] The invention relates to the field of man-machine interface visualization analysis technology for rail transit monitoring products, in particular to a method that can display rail transit passenger flow OD data more clearly and intuitively to staff, so that staff can quickly and intuitively understand each site A 3D visualization analysis method for OD data of rail transit passenger flow between passenger flow and flow direction. Background technique [0002] In recent years, urban rail transit has developed rapidly in my country and even in the world with its characteristics of large capacity, punctuality, safety and speed. Rail transit has gradually become the preferred mode of transportation for urban residents' daily travel. At the same time, the corresponding rail transit data contains massive and real-time travel information, and the visualization of rail transit data has gradually become a current research hotspot. Visual analysis of rail trans...

Claims


Application Information

Patent Timeline
Patent Type & Authority Applications(China)
IPC IPC(8): G06F16/904G06F16/957G06Q50/26
CPCG06Q50/26G06F16/904G06F16/9577
Inventor 张帅东丁康曹辉张慧慧臧亚星贺国君
Owner ZHEJIANG SUPCON INFORMATION TECH CO LTD
Why Eureka
Try Eureka