A paper-based visual detection method for nucleic acid amplification for non-diagnostic purposes
A paper-based, nucleic acid technology, applied in the field of nucleic acid amplification paper-based visual detection, to achieve the effect of a good container
- Summary
- Abstract
- Description
- Claims
- Application Information
AI Technical Summary
Problems solved by technology
Method used
Image
Examples
Embodiment 1
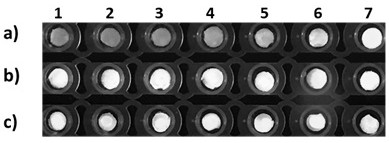
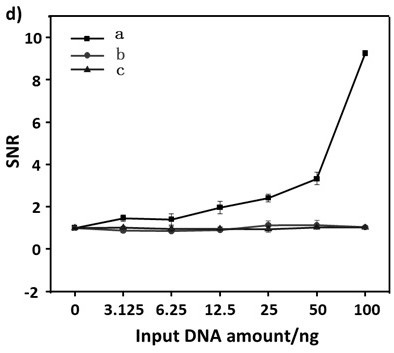
[0034] Cut the silica gel membrane into discs with a diameter of 3 mm with a hole puncher, and place them on the lid of a 0.2 mL centrifuge tube; take the paper-based material disc, and mix 15 µL of 2-fold gradient dilution of pMD 18-T carrier DNA and 1 µL of SYBR Green I dye was added to the surface of the material, and the disk was directly placed under a UV lamp to excite and photographed and recorded; the obtained image was processed in grayscale and analyzed with ImageJ software, and the average pixel value was recorded as the signal intensity. Record the mean value of the blank sample as N (noise) and the mean value of DNA samples from a given sample as S (signal). Normalized intensities were calculated as signal-to-noise ratio (SNR) values between samples and blanks: SNR = N / S.
Embodiment 2
[0036] Cut the nitrocellulose membrane into discs with a diameter of 3 mm with a hole punch, and place them on the lid of a 0.2 mL centrifuge tube; take the paper-based material discs, and add 15 µL of 2-fold serially diluted pMD 18-T carrier DNA and 1 µL of SYBR Green I dye were added to the surface of the material, and the disc was directly placed under a UV lamp to excite and photographed for recording; the obtained image was processed in grayscale and analyzed with ImageJ software, and the average pixel value was recorded as the signal intensity . Record the mean value of the blank sample as N (noise) and the mean value of DNA samples from a given sample as S (signal). Normalized intensities were calculated as signal-to-noise ratio (SNR) values between samples and blanks: SNR = N / S.
Embodiment 3
[0038] Cut Whatman No. 1 filter paper into discs with a diameter of 3 mm and place them on the lid of a 0.2 mL centrifuge tube; take the paper-based material disc and add 15 µL of 2-fold serially diluted pMD 18-T carrier DNA and 1 µL of SYBR GreenI dye were added to the surface of the material, and the disk was directly placed under a UV lamp to excite and photographed and recorded; the obtained image was processed in grayscale and analyzed with ImageJ software, and the average pixel value was recorded as the signal intensity. Record the mean value of the blank sample as N (noise) and the mean value of DNA samples from a given sample as S (signal). Normalized intensities were calculated as signal-to-noise ratio (SNR) values between samples and blanks: SNR = N / S.
PUM
| Property | Measurement | Unit |
|---|---|---|
| diameter | aaaaa | aaaaa |
Abstract
Description
Claims
Application Information
 - R&D
- Intellectual Property
- Life Sciences
- Materials
- Tech Scout
- Unparalleled Data Quality
- Higher Quality Content
- 60% Fewer Hallucinations
Browse by: Latest US Patents, China's latest patents, Technical Efficacy Thesaurus, Application Domain, Technology Topic, Popular Technical Reports.
© 2025 PatSnap. All rights reserved.Legal|Privacy policy|Modern Slavery Act Transparency Statement|Sitemap|About US| Contact US: help@patsnap.com


