Display device, display system, display screen generation method
A display device and a technology for displaying images, which are applied in image generation, general control system, 2D image generation, etc., and can solve problems such as easy-to-find anomalies
- Summary
- Abstract
- Description
- Claims
- Application Information
AI Technical Summary
Problems solved by technology
Method used
Image

Examples
Embodiment approach 1
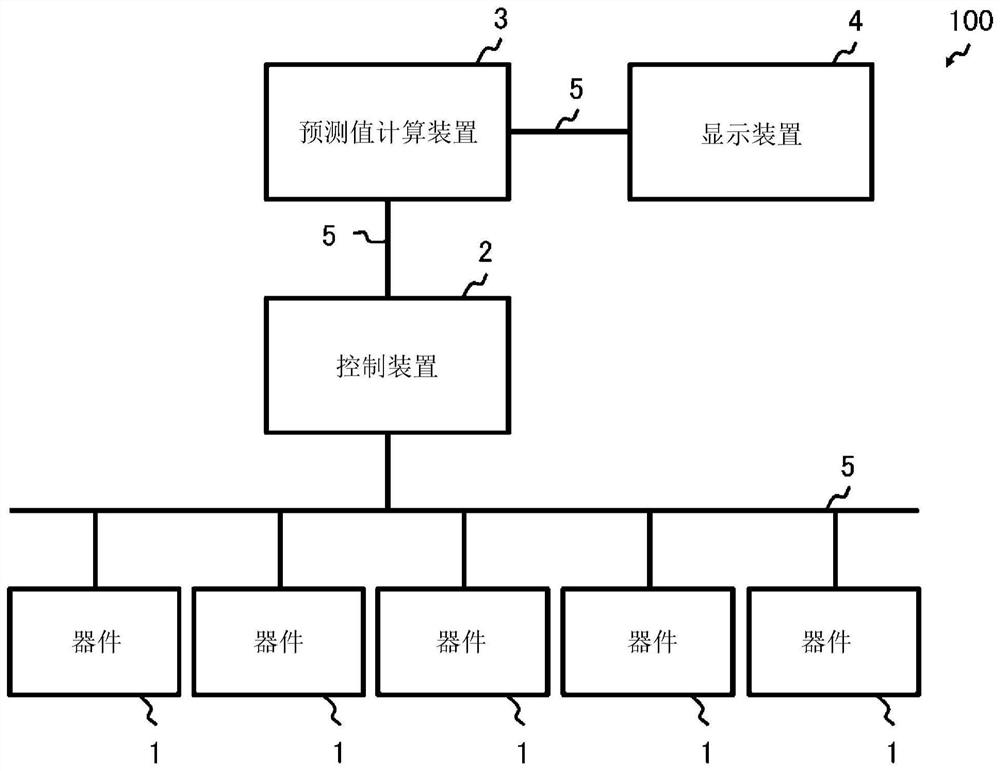
[0047] figure 1 It is a configuration diagram showing an example of the display system in Embodiment 1 of the present invention. Such as figure 1 As shown, the display system 100 has five devices 1 , a control device 2 , a predicted value calculation device 3 , a display device 4 and a network 5 . In addition, the case where the display system 100 has five devices 1 is described, but it is not limited to the case where there are five devices 1 , and any device 1 may have four or less or six or more.
[0048] Device 1 is a drive device that drives a binary digital signal as input data or an output device that outputs a binary digital signal as output data, such as drive devices such as actuators, or sensors, switches, repeaters, and digital circuits, etc. output device. The device 1 is a device embedded in any device such as a processing device such as an injection molding machine, an extrusion molding machine, a lathe, and a grinding machine, or an inspection device such ...
Embodiment approach 2
[0140] In Embodiment 1, an embodiment was described in which, when the normal model is a normal model generated based on machine learning, the probability that the signal value of the predicted value of the log data of the control device 2 is 1 is 0.5 or more. In the case where the signal value of the predicted value is set to 1, the probability that the signal value of the predicted value of the log data of the control device 2 is 1 is less than 0.5, and the signal value of the predicted value is set to 0, and the prediction of the log data of the control device 2 The signal value of the value must be either of the two states of 0 or 1. In Embodiment 2, an embodiment will be described in which, when the normal model is a normal model generated based on machine learning, the signal value of the predicted value of the log data of the control device 2 is 0, 1, or none. state. In addition, the configuration of the display system 100, the configuration of the predicted value calc...
Embodiment approach 3
[0157] In Embodiment 1, an embodiment was described in which, when the normal model is a normal model generated based on statistical processing, the prediction screen generation unit 412 of the control unit 41 of the display device 4 based on the accuracy of the predicted value The standard deviation calculates the angle θ of the predicted value area 7 . In Embodiment 3, an embodiment will be described in which, when the normal model is a normal model generated based on statistical processing, the prediction screen generation unit 412 of the control unit 41 of the display device 4 uses The shape and size of the predicted value region 7 are corrected for the normal distribution calculated with the standard deviation of degrees. In addition, the configuration of the display system 100, the configuration of the predicted value calculation device 3, the configuration of the display device 4, the normal model generation process in the predicted value calculation device 3, the predi...
PUM
 Abstract
Description
Claims
Application Information
 - R&D
- Intellectual Property
- Life Sciences
- Materials
- Tech Scout
- Unparalleled Data Quality
- Higher Quality Content
- 60% Fewer Hallucinations
Browse by: Latest US Patents, China's latest patents, Technical Efficacy Thesaurus, Application Domain, Technology Topic, Popular Technical Reports.
© 2025 PatSnap. All rights reserved.Legal|Privacy policy|Modern Slavery Act Transparency Statement|Sitemap|About US| Contact US: help@patsnap.com