Method for verifying cultivation device performance

A chi-square test and bacterial cell technology, applied in the field of cell culture and high-throughput cell culture, can solve problems such as damage to model output and data input errors

Pending Publication Date: 2021-04-09
F HOFFMANN LA ROCHE & CO AG
View PDF7 Cites 0 Cited by
  • Summary
  • Abstract
  • Description
  • Claims
  • Application Information

AI Technical Summary

Problems solved by technology

Data entry errors can occur and compromise the overall model output

Method used


Image

  • Method for verifying cultivation device performance
  • Method for verifying cultivation device performance
  • Method for verifying cultivation device performance

Examples


example 1

[0292] Comparison of recombinant CHO clones and ranking of metabolic performance indicators

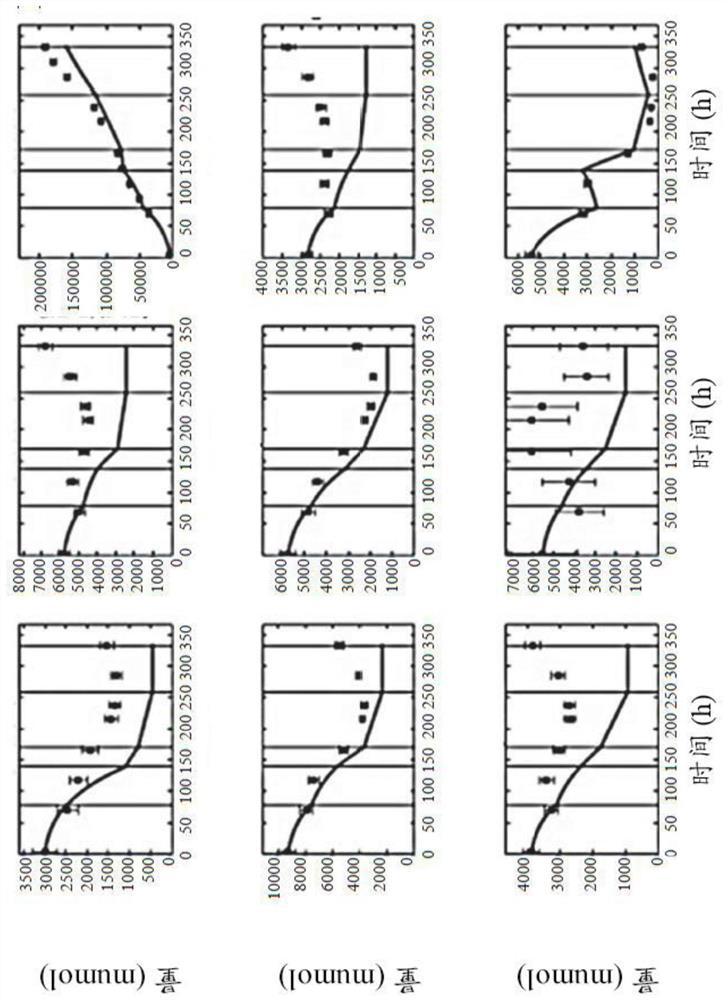
[0293] For clone comparison experiments, ten recombinant CHO-K1 clones (CL4 to CL13) expressing the same monoclonal IgG4 antibody were used. For comparative studies of the different products, another clone CL14 expressing the same recombinant human IgG4 monoclonal antibody as above and two other production clones (CL2 and CL3) expressing the monoclonal IgG1 antibody were used. Recombinant CHO-K1 clones were grown in a protein-free, chemically defined proprietary medium for seed culture and subsequent batch feeding experiments. Seed cultures were performed in shake flasks using a humidified incubator with a set point control of 7% CO 2 and 37°C. Colonies were isolated every three to four days. For all experiments, clones of the same age (21 days) cultured up to the start of the experiments were used. For batch-fed comparison experiments, CL4 to CL13 were grown in 230 mL of medium i...

example 2

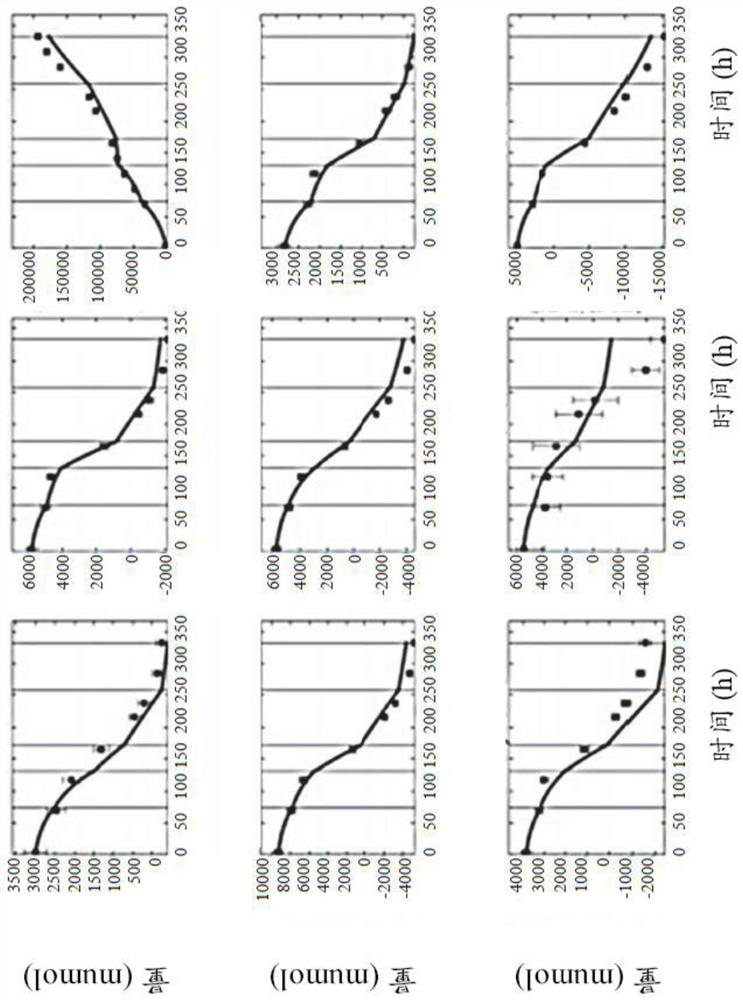
[0296] Comparison of Different Fermentation Scales of Recombinant CHO Cloning Culture

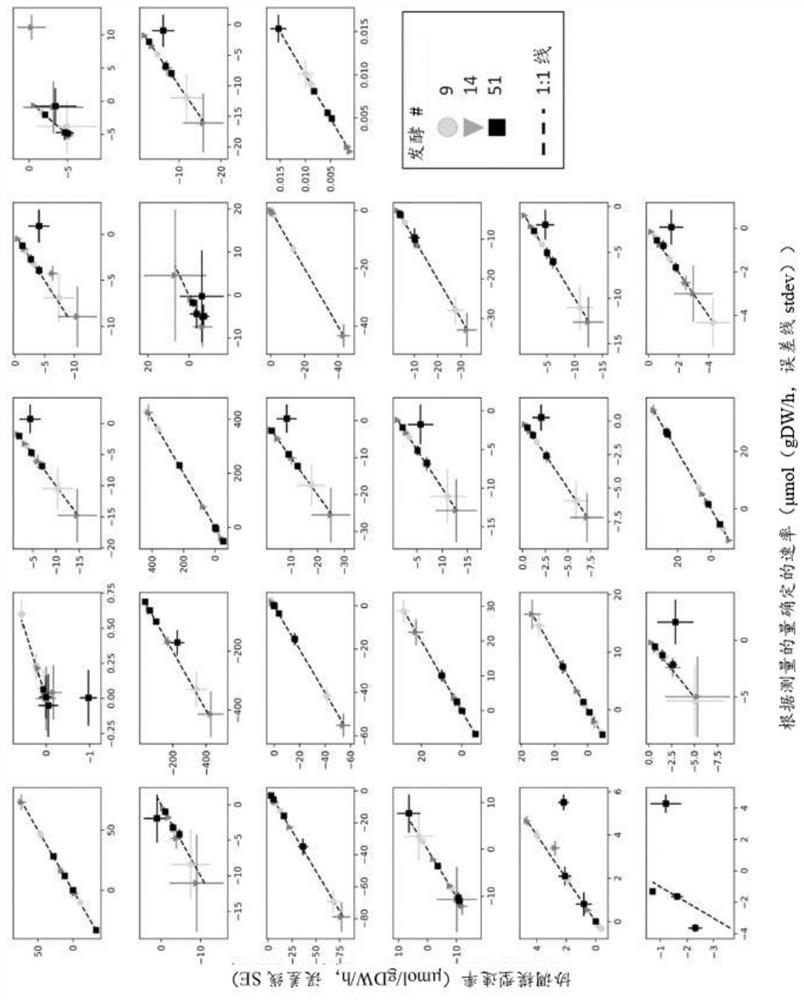
[0297] Metabolic flux analysis methods were used to establish automated CHO cell performance assays for high-throughput use. To this end, rich data sets can be exploited to disrupt cultures performed at various scales, expressing various mAbs, if desired (see Table 3). Methods used to design pipelines include genome-scale modeling of metabolic networks, identification of process stages, analysis of metabolic fluxes, and analysis of clonal performance metrics. Statistical analyzes performed included reduced χ 2 Testing, cross-validation, and repeated analysis. Analysis results can account for transformation and translation errors in the data set to determine the χ 2 The acceptance range for the inspection. In addition, the analysis considered the impact of other measured parameters in the form of host cell proteins and indicators of oxygen uptake.

[0298] In the initial phase, a compre...

example 3

[0300] Analysis of CHO clone performance by OUR and HCP metrics

[0301] To this end, the influence of cultured subsets representing the HCP and OUR datasets was analyzed (see Table 3). Here, it has been found that in both cases, taking into account the additional data, by increasing χ 2 The information content retrieved from experiments can be improved. In detail, when the host cell protein (13% increase point) and oxygen uptake rate (25% increase point) measurements were taken into account, the information content of the CHO fermentation was significantly improved (see Table 9).

[0302] Table 9: χ 2 The detailed results of the test. To analyze the impact of the HCP and OUR indicators, Model Scenario 1 (Model 1) was re-evaluated using only the cultivars for which HCP and OUR were measured.

[0303]


PUM


Abstract

Herein is reported a method for determining whether process data obtained in a culture process of mammalian or bacterial cells is affected by a problem. The method comprises the steps of (i) fitting the process data obtained during the culture process of the same mammalian or bacterial cells expressing the same recombinant heterologous polypeptide in a metabolic model generated for the mammalian or bacterial cells expressing the recombinant heterologous polypeptide; and (ii) determining that the culture is affected by a problem if the build mimetic combination exhibits an offset of greater than 10% with respect to the original data or the build mimetic combination has a chi2 value determined by Pearson chi-square assay of greater than 5.

Description

[0001] The invention belongs to the field of cell culture, more precisely to the field of high-throughput cell culture. This article reports methods to determine whether cell cultures are affected by the problem. Alignment and / or consistency control of experimentally determined data is developed especially in computer metabolic modeling. By using metabolic flux analysis through cell models, the consistency of in vitro data can be checked based on the fit between the model and experiment. Background technique [0002] Modern biotherapeutics meet a growing need in the treatment of complex multifactorial diseases such as cancer, diabetes or rheumatoid arthritis. Most biotherapeutics are produced in established mammalian cell lines (eg, Chinese hamster ovary (CHO) cells) or well-characterized bacterial strains (eg, Escherichia coli (E. coli)). [0003] Traditionally, cell line development and process development have been time-consuming and cumbersome for cell-based biological p...

Claims


Application Information

Patent Timeline
Patent Type & Authority Applications(China)
IPC IPC(8): G01N33/68
CPCG01N33/68G16B5/00G16C20/60C12M41/46G16B50/10
Inventor T·格罗斯科普夫O·波普T·瓦洛查
Owner F HOFFMANN LA ROCHE & CO AG
Why Eureka
Try Eureka