Supercharge Your Innovation With Domain-Expert AI Agents!

A visual agricultural big data analysis interactive system

An interactive system and big data technology, applied in the field of visual agricultural big data analysis interactive system, can solve the problems of not being able to achieve data and keep pace with the times, and achieve the effect of improving response speed and robustness

Active Publication Date: 2022-04-15
SOUTHWEST PETROLEUM UNIV
View PDF24 Cites 0 Cited by
  • Summary
  • Abstract
  • Description
  • Claims
  • Application Information

AI Technical Summary

Problems solved by technology

[0004] The above application has a relatively intuitive display of digital data. However, big data in the agricultural field includes not only digital data. For example, before agricultural production, national policy deployment, corporate investment information, and regional disaster and climate information are all It plays a guiding role in agricultural production. Another example is the sales and processing link after agricultural production. We are concerned with the sales and processing of agricultural products. These are difficult to display intuitively through simple digital data processing, and the data source depends on The existing statistical data cannot keep pace with the times, and cannot update and expand the data itself

Method used


Image

  • A visual agricultural big data analysis interactive system
  • A visual agricultural big data analysis interactive system
  • A visual agricultural big data analysis interactive system

Examples


Embodiment Construction

[0085] The present invention will be further described below in conjunction with the accompanying drawings and embodiments.

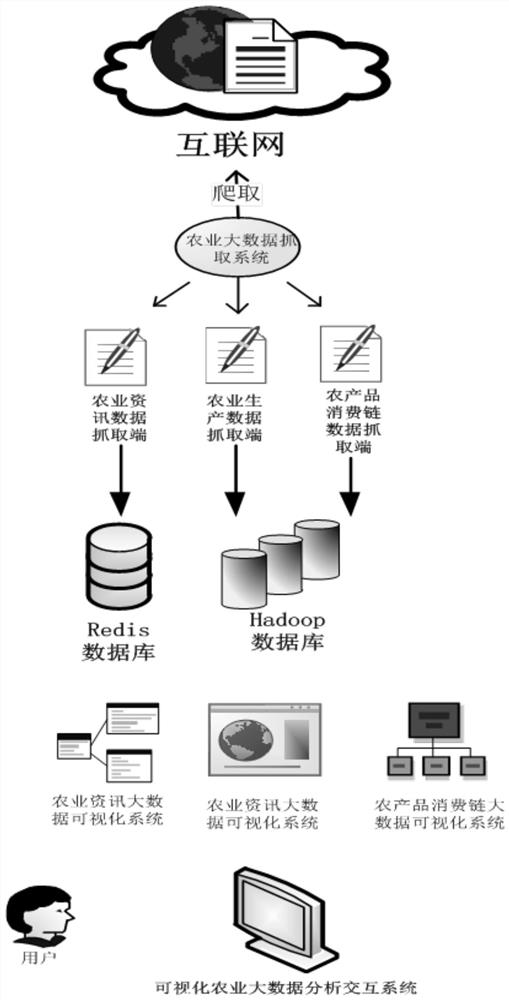
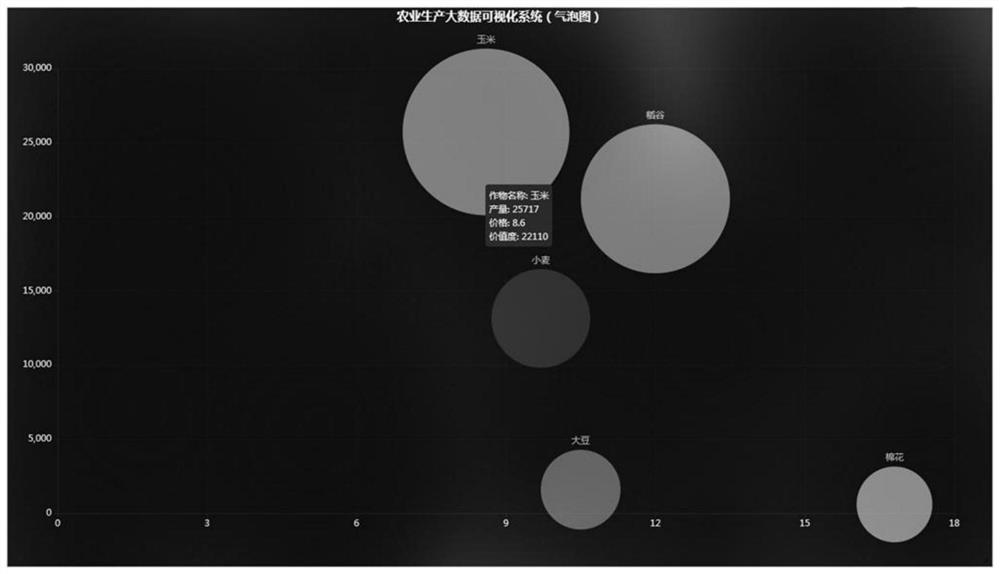
[0086] like Figure 1 to Figure 4 As shown, the present invention provides a visual agricultural big data analysis interactive system, including agricultural big data capture system, agricultural information big data visualization system, agricultural production big data visualization system, agricultural product consumption chain big data visualization system and visual interaction system .

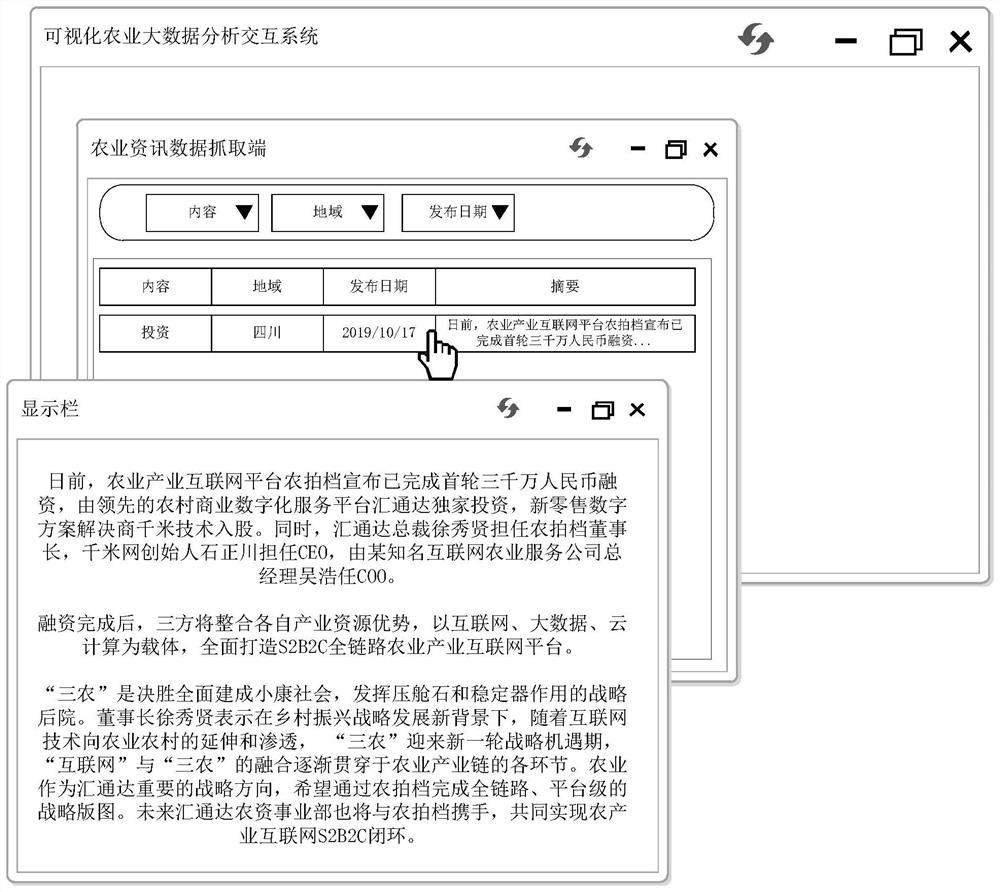
[0087] As a further solution of this embodiment, such as figure 1 As shown, the agricultural big data capture system uses data crawlers to legally capture, filter and store agricultural data on the existing web servers on the Internet; the agricultural big data capture system includes agricultural information Data capture terminal, agricultural production data capture terminal, agricultural product consumption chain data capture terminal and big data storage ter...


PUM


Abstract

The invention provides a visual agricultural big data analysis interaction system, which relates to the field of smart agriculture. The present invention legally captures the public agricultural data existing on the Internet through the agricultural big data capture system, and the categories of captured data include: agricultural information, agricultural policy, investment information, output data, and consumption chain data etc., and visualize these data, so that users can visually observe agricultural data in a multi-directional and tracking manner, and cover the breadth and depth of agricultural big data; The information is centralized, automatically updated, and automatically maintained. The agricultural production big data visualization system can visually display the data in the agricultural production process through the bubble diagram. The agricultural product consumption chain big data visualization system uses the Sankey diagram to monitor the agricultural product sales process. Tracking display.

Description

technical field [0001] The invention relates to the field of smart agriculture, in particular to a visual agricultural big data analysis interaction system. Background technique [0002] With the popularization and development of smart agriculture, a large amount of data is generated in the process of agricultural production and sales. These data themselves have no specific meaning, but after integrating and analyzing these data, we can get a lot of guiding information, such as: statistics over the years The corresponding relationship between the cotton production and the price curve, we can infer the cotton production through this year's cotton price curve, but if these data are directly observed without processing, it is difficult to find the connection and effect, but these data can be visualized in a visual way The laws and development trends in it become clear at a glance. [0003] Aiming at the visualization of agricultural big data, the invention patent application w...

Claims


Application Information

Patent Timeline
Patent Type & Authority Patents(China)
IPC IPC(8): G06F16/951G06F16/955G06F16/957G06F16/23G06Q50/02
CPCG06F16/951G06F16/955G06F16/957G06F16/23G06Q50/02
Inventor 杨先凤朱西平陈惠芬梁琳李婕吕园园
Owner SOUTHWEST PETROLEUM UNIV
Features
  • R&D
  • Intellectual Property
  • Life Sciences
  • Materials
  • Tech Scout
  • Unparalleled Data Quality
  • Higher Quality Content
  • 60% Fewer Hallucinations
Learn More