

Primer group, probe group and kit for detecting high-frequency gene pathogenic variation
A technology of primer set and probe set, which is applied in biochemical equipment and methods, recombinant DNA technology, measurement/inspection of microorganisms, etc., to achieve the effect of maximizing the difference in amplification efficiency, simplifying the interpretation of results, and improving work efficiency
- Summary
- Abstract
- Description
- Claims
- Application Information
AI Technical Summary
Problems solved by technology
Method used
Image

Examples
Embodiment
[0042] This kit is a specific primer / probe group for detecting pathogenic variants of high-frequency gene loci (GALC:NM_000153:exon16:c.1901 T>C:p.L634S), suitable for high-efficiency DNA with high GC sequences Polymerase, specific ratio of dNTPs, buffer system suitable for high GC sequences, ROX reference fluorescent dye, blank control and positive control.
[0043] Detection site and its primer set nucleotide sequence list 1:
[0044]
[0045]
[0046] The above primers and probes are designed independently, and the detection sites can be effectively distinguished by adjusting the specific design parameters. Each of the above primer sequences is a nucleotide sequence with detection significance for the high-frequency GALC gene locus.
[0047] The temperature setting of the primer sequence determines the extension temperature during the PCR reaction. Too high or too low will have adverse effects on the PCR reaction.
[0048] The primer pair of the first forward-stran...
experiment example
[0062] 1. When using wild-type DNA as a template:
[0063]
[0064]
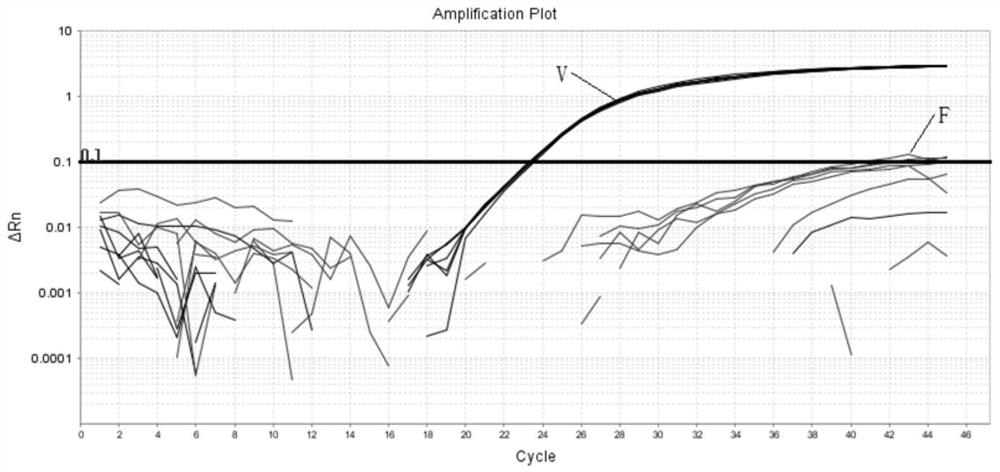
[0065] The samples in the above table (111001139725, 111001139717, 111001139700, 111001152842, 111001139720, 111001155336) are wild-type human genomic DNA, the threshold line of FAM and VIC signal is set to 0.1, and the threshold line below 0.1 is background signal, which has no reference significance.
[0066] From the above table and as figure 1 The schematic diagram of the log logarithmic curve experimental results shown shows that the average Ct value of the VIC signal is 23.42 with a standard deviation of 0.08; the average Ct value of the FAM signal is 41.60 with a standard deviation of 0.86; and the Ct values of the FAM signals of the three samples is undetermined.
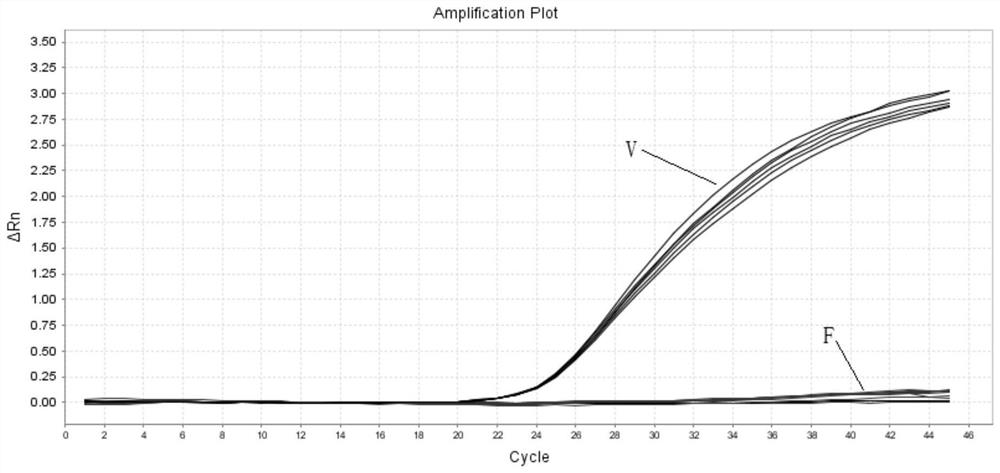
[0067] The experimental results of Linear linear amplification curve are as follows: figure 2 shown. figure 2 The results show that the amplification curve of the FAM channel is hardly observed in the linear curve. And the di...
PUM
 Abstract
Description
Claims
Application Information