Traffic detection method and system based on interaction strategy, storage medium and electronic equipment
A technology of flow detection and flow prediction, applied in transmission systems, electrical components, business, etc., can solve problems such as adjusting model performance, achieve the effects of reducing costs, improving interpretability and recognition performance
- Summary
- Abstract
- Description
- Claims
- Application Information
AI Technical Summary
Problems solved by technology
Method used
Image

Examples
Embodiment 1
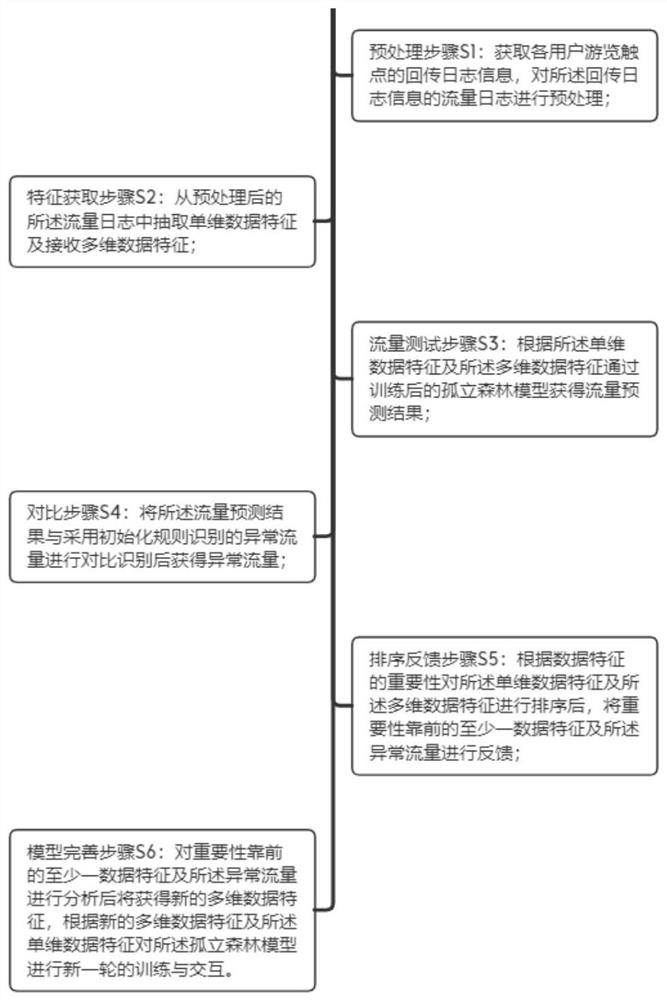
[0052] Please refer to figure 1 , figure 1 is a flow chart of the traffic detection method based on the interaction strategy. Such as figure 1 As shown, the traffic detection method based on interaction strategy of the present invention includes:
[0053] Preprocessing step S1: Obtain the returned log information of each user's tour contact point, and perform preprocessing on the traffic log of the returned log information;
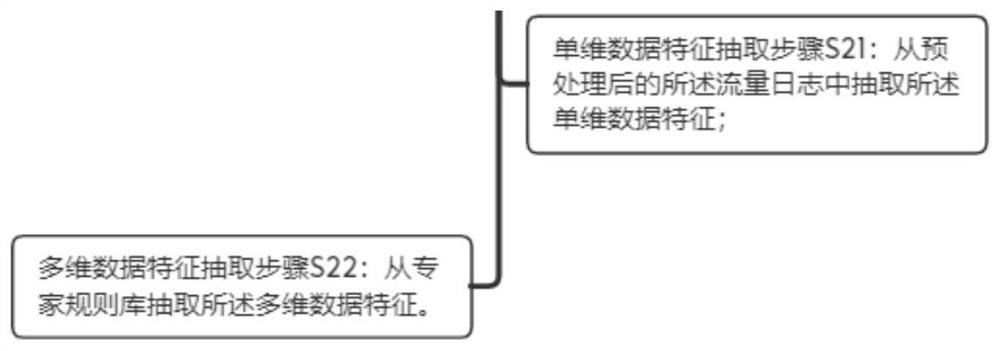
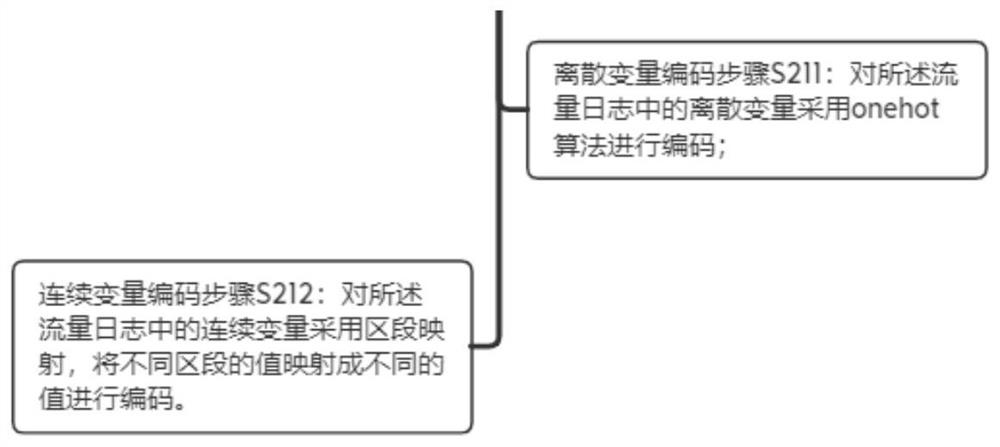
[0054] Feature acquisition step S2: extracting single-dimensional data features and receiving multi-dimensional data features from the preprocessed traffic log;
[0055] Traffic testing step S3: Obtain a traffic prediction result through the trained isolation forest model according to the single-dimensional data feature and the multi-dimensional data feature;
[0056] Comparing step S4: comparing and identifying the traffic prediction result with the abnormal traffic identified by the initialization rule to obtain the abnormal traffic;
[0057] Sorti...
Embodiment 2
[0078] Please refer to Figure 6 , Figure 6 It is a schematic structural diagram of the traffic detection system based on the interaction strategy of the present invention.
[0079] Such as Figure 6 A flow detection system based on an interaction policy of the present invention is shown, which includes:
[0080] A preprocessing module, the preprocessing module obtains the return log information of each user's tour contact point, and performs preprocessing on the traffic log of the return log information;
[0081] A feature acquisition module, the feature acquisition module extracts single-dimensional data features and receives multi-dimensional data features from the preprocessed traffic logs;
[0082] A flow test module, the flow test module obtains a flow prediction result through a trained isolated forest model according to the single-dimensional data feature and the multi-dimensional data feature;
[0083] A comparison module, the comparison module compares the traff...
Embodiment 3
[0087] combine Figure 7 As shown, this embodiment discloses a specific implementation manner of an electronic device. The electronic device may include a processor 81 and a memory 82 storing computer program instructions.
[0088] Specifically, the processor 81 may include a central processing unit (CPU), or an Application Specific Integrated Circuit (ASIC for short), or may be configured to implement one or more integrated circuits in the embodiments of the present application.
[0089]Among them, the memory 82 may include mass storage for data or instructions. For example without limitation, the memory 82 may include a hard disk drive (Hard Disk Drive, referred to as HDD), a floppy disk drive, a solid state drive (SolidState Drive, referred to as SSD), flash memory, optical disk, magneto-optical disk, magnetic tape or universal serial bus (Universal Serial Bus, referred to as USB) drive or a combination of two or more of the above. Storage 82 may comprise removable or no...
PUM
 Abstract
Description
Claims
Application Information
 - R&D
- Intellectual Property
- Life Sciences
- Materials
- Tech Scout
- Unparalleled Data Quality
- Higher Quality Content
- 60% Fewer Hallucinations
Browse by: Latest US Patents, China's latest patents, Technical Efficacy Thesaurus, Application Domain, Technology Topic, Popular Technical Reports.
© 2025 PatSnap. All rights reserved.Legal|Privacy policy|Modern Slavery Act Transparency Statement|Sitemap|About US| Contact US: help@patsnap.com