Farmland irrigation analysis control system based on Internet
A technology for farmland irrigation and control systems, applied in image analysis, agriculture, image enhancement, etc., can solve problems such as abnormal cause investigation, and achieve the effect of improving efficiency
- Summary
- Abstract
- Description
- Claims
- Application Information
AI Technical Summary
Problems solved by technology
Method used
Image
Examples
Embodiment 1
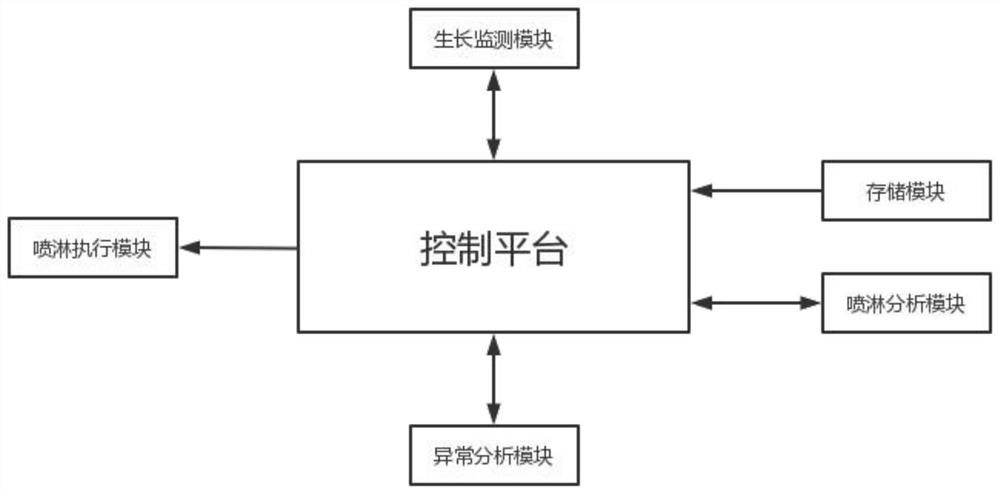
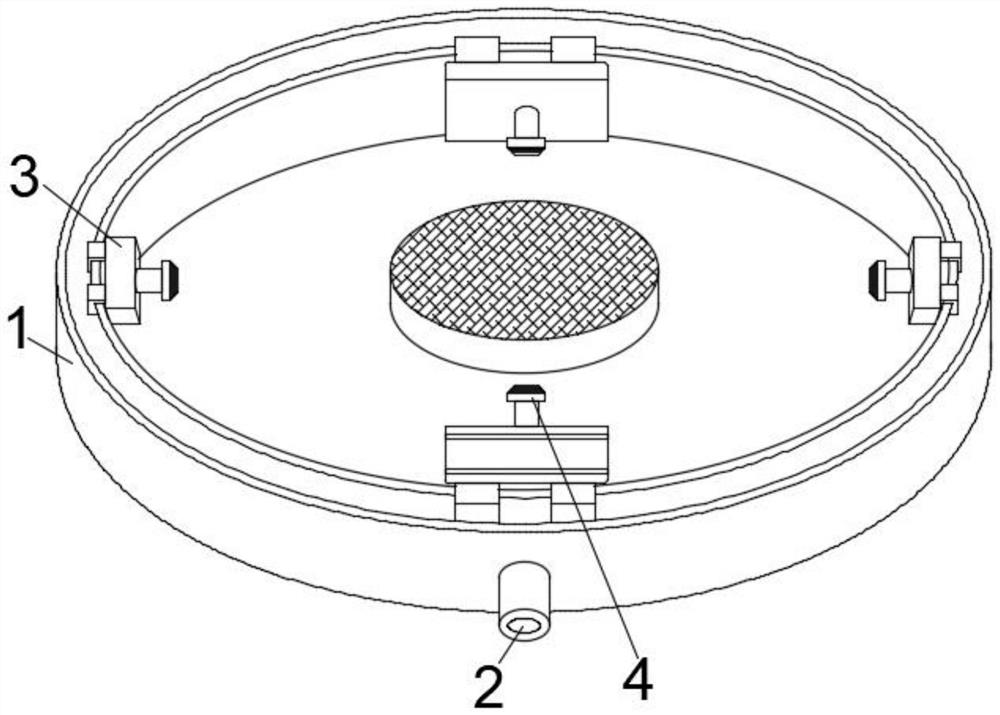
[0039] see figure 2 As shown, the sprinkler execution module includes an annular track water tank 1, which is installed on the outside of the farmland, the outer wall of the annular track water tank 1 is equipped with a water inlet pipe 2, and the inner wall of the annular track water tank 1 is provided with several mobile water pumps 3 , the output end of the mobile water pump 3 is provided with a nozzle 4, the number of the nozzle 4 and the mobile water pump 3 can be set according to the size of the farmland, in the actual implementation process, the number of the nozzle 4 and the mobile water pump 3 is usually selected as three to five. The shape of the farmland is circular, and the center of the farmland coincides with the center of the circular track water tank 1. The spraying distances of several nozzles 4 are different, and the sum of the spraying ranges of all the nozzles 4 completely covers the farmland, that is, with the mobile water pump 3 Continuously moving on t...
Embodiment 2
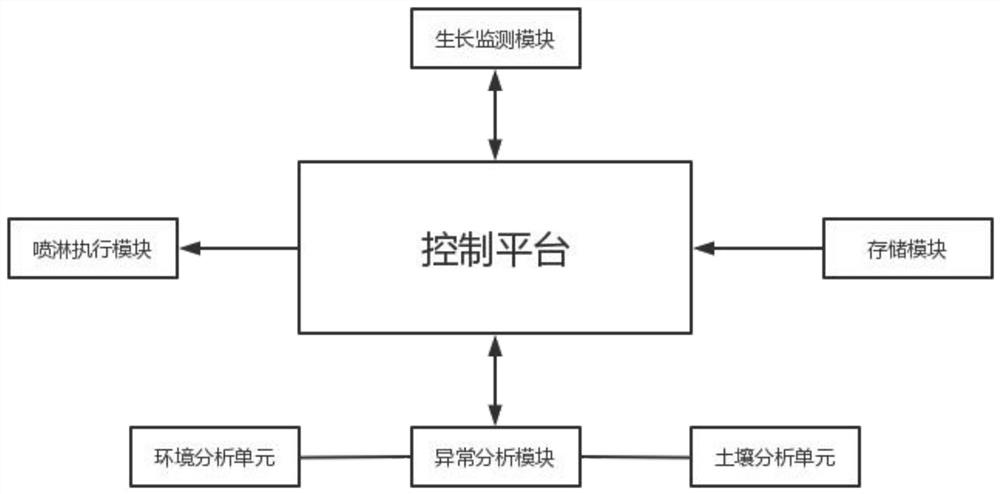
[0041] see image 3 As shown, the growth monitoring module is used to analyze the growth state of the crops in the farmland: divide the farmland into growth areas i, i=1, 2, ..., n, n is a positive integer, take color images of the growth area i and The captured color image is enlarged into a pixel grid image i, and the color feature extraction is performed on the obtained pixel grid image i through the feature extraction technology to obtain the green feature component of the pixel grid. In machine learning, pattern recognition and image processing, the feature extraction starts from the initial We start with a set of measurement data for , and build derived values (features) that are intended to be informative and non-redundant, thereby facilitating subsequent learning and generalization steps. Sum the green feature components of all the pixel grids of the pixel grid image i and take the average to obtain the green performance value LBi of the pixel grid image i; obtain th...
Embodiment 3
[0046] see Figure 4 As shown, the specific process of the difference analysis model to analyze the growth difference of growth area i includes: establishing force growth set {SZ1, SZ2, ..., SZi}, calculating the variance of the growth set and marking the obtained value as the difference coefficient CY, the difference coefficient is a reflection of the degree of deviation between the growth state of crops in a single growth area and the standard state. The larger the value of the difference coefficient, the more the number of unqualified growth areas in the overall qualified farmland, and the unqualified The worse the growth state of the crops in the growing area, the worse the growth balance of the crops in the farmland. The difference threshold CYmax is obtained through the storage module, and the difference coefficient CY of the growth set is compared with the difference threshold CYmax: If the difference coefficient CY <difference threshold CYmax, it is determined that the...
PUM
 Abstract
Description
Claims
Application Information
 - R&D
- Intellectual Property
- Life Sciences
- Materials
- Tech Scout
- Unparalleled Data Quality
- Higher Quality Content
- 60% Fewer Hallucinations
Browse by: Latest US Patents, China's latest patents, Technical Efficacy Thesaurus, Application Domain, Technology Topic, Popular Technical Reports.
© 2025 PatSnap. All rights reserved.Legal|Privacy policy|Modern Slavery Act Transparency Statement|Sitemap|About US| Contact US: help@patsnap.com


