Observation environment influence discrimination and evaluation method based on daily minimum value of air temperature

An environmental impact, minimum value technology, applied in data processing applications, instruments, calculations, etc., can solve problems such as systematic errors, and achieve the effect of improving accuracy, improving use efficiency, and using significant effects.

Active Publication Date: 2022-07-05
中国气象局成都高原气象研究所 +1
View PDF2 Cites 2 Cited by
  • Summary
  • Abstract
  • Description
  • Claims
  • Application Information

AI Technical Summary

Problems solved by technology

However, in actual situations, there may be a wide variety of systematic errors in the reference sequence. Therefore, a reliable error identification algorithm needs to be strictly based on objective evidence, provide specific quantitative conclusions, and provide a method for adapting to the process of complex environmental changes. realistic analytical tools

Method used


Image

  • Observation environment influence discrimination and evaluation method based on daily minimum value of air temperature
  • Observation environment influence discrimination and evaluation method based on daily minimum value of air temperature
  • Observation environment influence discrimination and evaluation method based on daily minimum value of air temperature

Examples


example 21

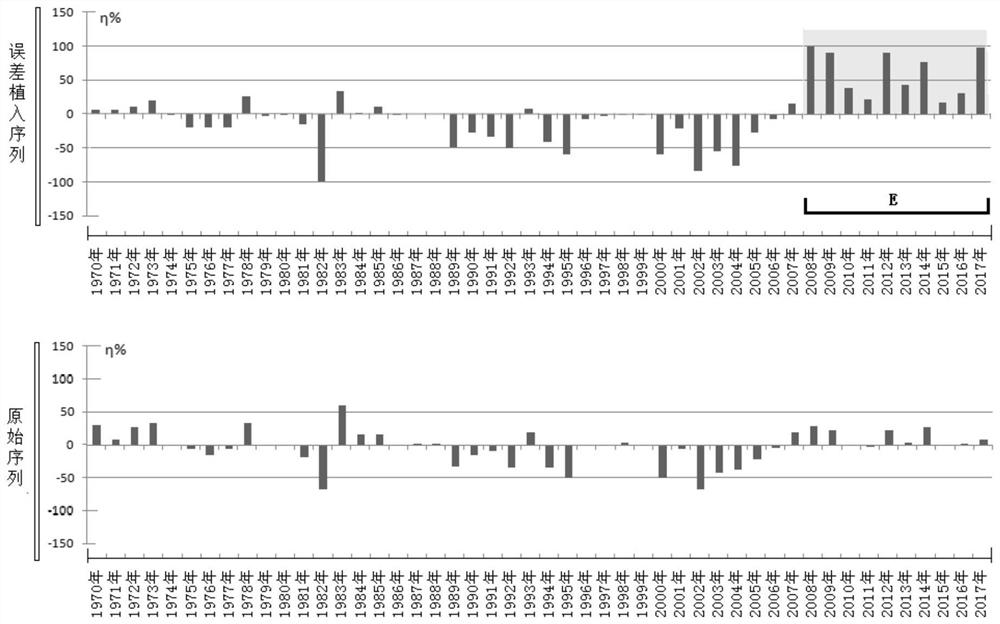
[0088] Use the T in the first quarter of Pengzhou Station min Sequence, 2008-2017 10a T minSeasonal data were added with a +0.3°C margin of error. The conventional statistical method obtains +4.5% anomaly increment signal from the data segment after adding +0.3℃ error, C1=+4.5%; at the same time, the Pengzhou station takes the other 13 stations in Chengdu as the reference to combine the calculated η sequence, In this error data segment, a +49% incremental signal is extracted, C2=+49%, so, G=10.9, that is, compared with the direct use of T min The anomaly variation of the quarterly series error data segment is used as the error signal. Using the η sequence analysis, the intensity of this error signal can be increased by 11 times, making the period of +0.3°C error change significantly and easier to identify. See figure 1 The middle E section shows that the Pengzhou station takes the other 13 stations in Chengdu as the reference station combination, and can effectively use the...

example 22

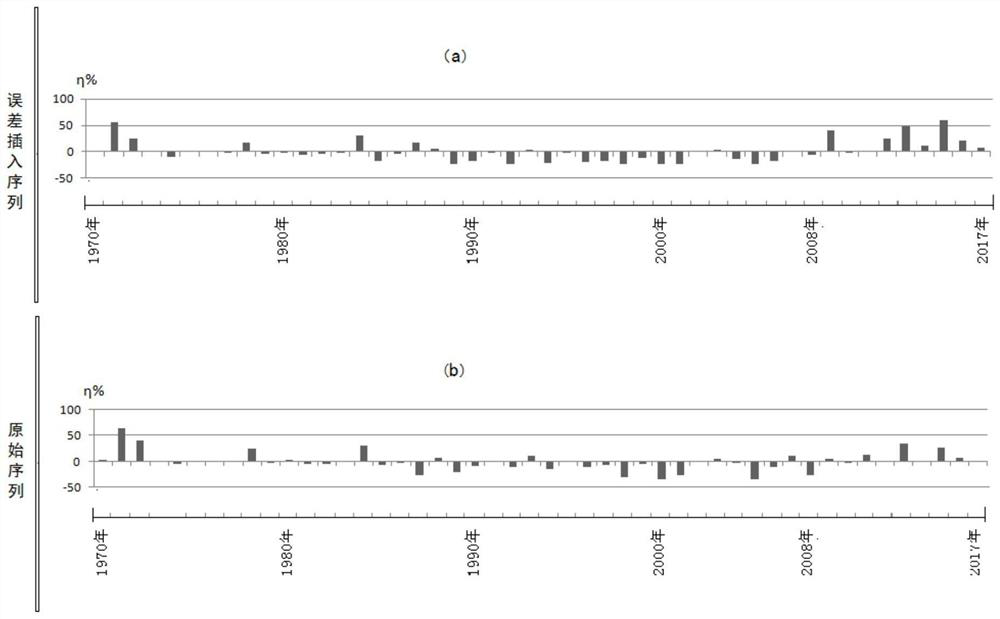
[0090] Use the T in the first quarter of Jianyang Station min Sequence, 2008-2017 10a T min The quarterly data is added with an error of +0.3°C, and the conventional statistical method obtains a +3.5% anomaly incremental signal from the data segment after adding the +0.3°C error, C1=+3.5%; Jianyang Station is compared with other 13 stations in Chengdu area. For the n-sequence calculated for the reference combination, a +15% incremental signal C2=+15% is extracted in this error data segment, so, G=4.3, that is, compared to directly using T min The anomaly variation of the quarterly sequence error data segment is used as the error signal. Using the η sequence analysis, the intensity of this error signal can be increased by 4.3 times. figure 2 -a It can be seen that this error signal gain level is not enough to make the signal amplitude change caused by the +0.3°C error, which is significantly different from the naturally existing fluctuation under visual inspection conditions....

example 31

[0108] Example 3.1: Observation of the impact of urbanization in Pengzhou Station

[0109] The urbanization error signal period of Pengzhou Station is as follows: Figure 5 As shown, Pengzhou Station has not been relocated, and since 2010 the second and third quarter j } The urbanization signal in China has been significantly and gradually strengthened, and the signal process is related to the Figure 4 -(b)-(c)-(d) The evolutionary synchronization of historical satellite imagery maps presented.


PUM


Abstract

The invention discloses an observation environment influence judgment and evaluation method based on a daily minimum value of air temperature, which comprises the following steps of: forming an index quantity sequence for error analysis through weighted combination by utilizing a daily minimum air temperature sequence spatial difference of a target station relative to a peripheral reference station and combining a long-time sequence transversal variation rate of the target station; the validity and the reachable identification sensitivity of the reference station sequence are determined through error simulation; time nodes of error properties and error generation and elimination can be determined according to the characteristics of the index quantity sequence; through error signal tracing, after a time period with an error is finally determined, trial and error detection is carried out on the error time period by using different correction values or correction functions, and the correction value or the value of the correction function corresponding to the minimum value of the standard deviation of the index quantity sequence is the accurate error quantity. The method is simple in operation and visual in error signal, can directly provide quantitative evaluation conclusions, and can be directly converted into observation environment evaluation, data quality control and correction tools.

Description

technical field [0001] The invention relates to the technical field of meteorological observation, in particular to a method for judging and evaluating the influence of an observation environment based on the daily minimum value of temperature. Background technique [0002] It is very difficult to maintain the stability of the meteorological observation environment in densely populated areas. A large number of errors caused by changes in the detected environmental conditions are mixed in the long-sequence temperature data, which affects the application value of the observation data. Methods to reduce such errors in data collection and use are explored. Very necessary. [0003] The longer the time span of the temperature observation sequence is, the more conducive it is to analyze and describe climate change. However, although the temperature measurement is carried out under standardized conditions, the long-term temperature measurement sequence is still frequently affected b...

Claims


Application Information

Patent Timeline
Patent Type & Authority Applications(China)
IPC IPC(8): G01W1/00G06Q10/06G06Q50/26
CPCG01W1/00G06Q10/06393G06Q50/26Y02A90/10
Inventor 贺南赵兴炳杨东夏昕陈乐
Owner 中国气象局成都高原气象研究所
Why Eureka
Try Eureka