Tracer and method of identifying tracer in product
- Summary
- Abstract
- Description
- Claims
- Application Information
AI Technical Summary
Benefits of technology
Problems solved by technology
Method used
Image
Examples
example 1
[0032]130 μl of silver colloid and 130 μl of highly pure water was added to a well (of a 96-well plate) and thoroughly mixed. A 30 μl sample of a tagged pesticide containing 100 ppb w / v (10−7M) of a tracer compound was added to the well. The contents of the well plate were thoroughly mixed by pipette aspiration. Then 10 μl of 0.01 M spermine was added to the mixture and mixed. SERS measurement was then performed on the sample using a Renishaw™ inVia Raman Microscope using a 5× objective, at 532 nm excitation wavelength.
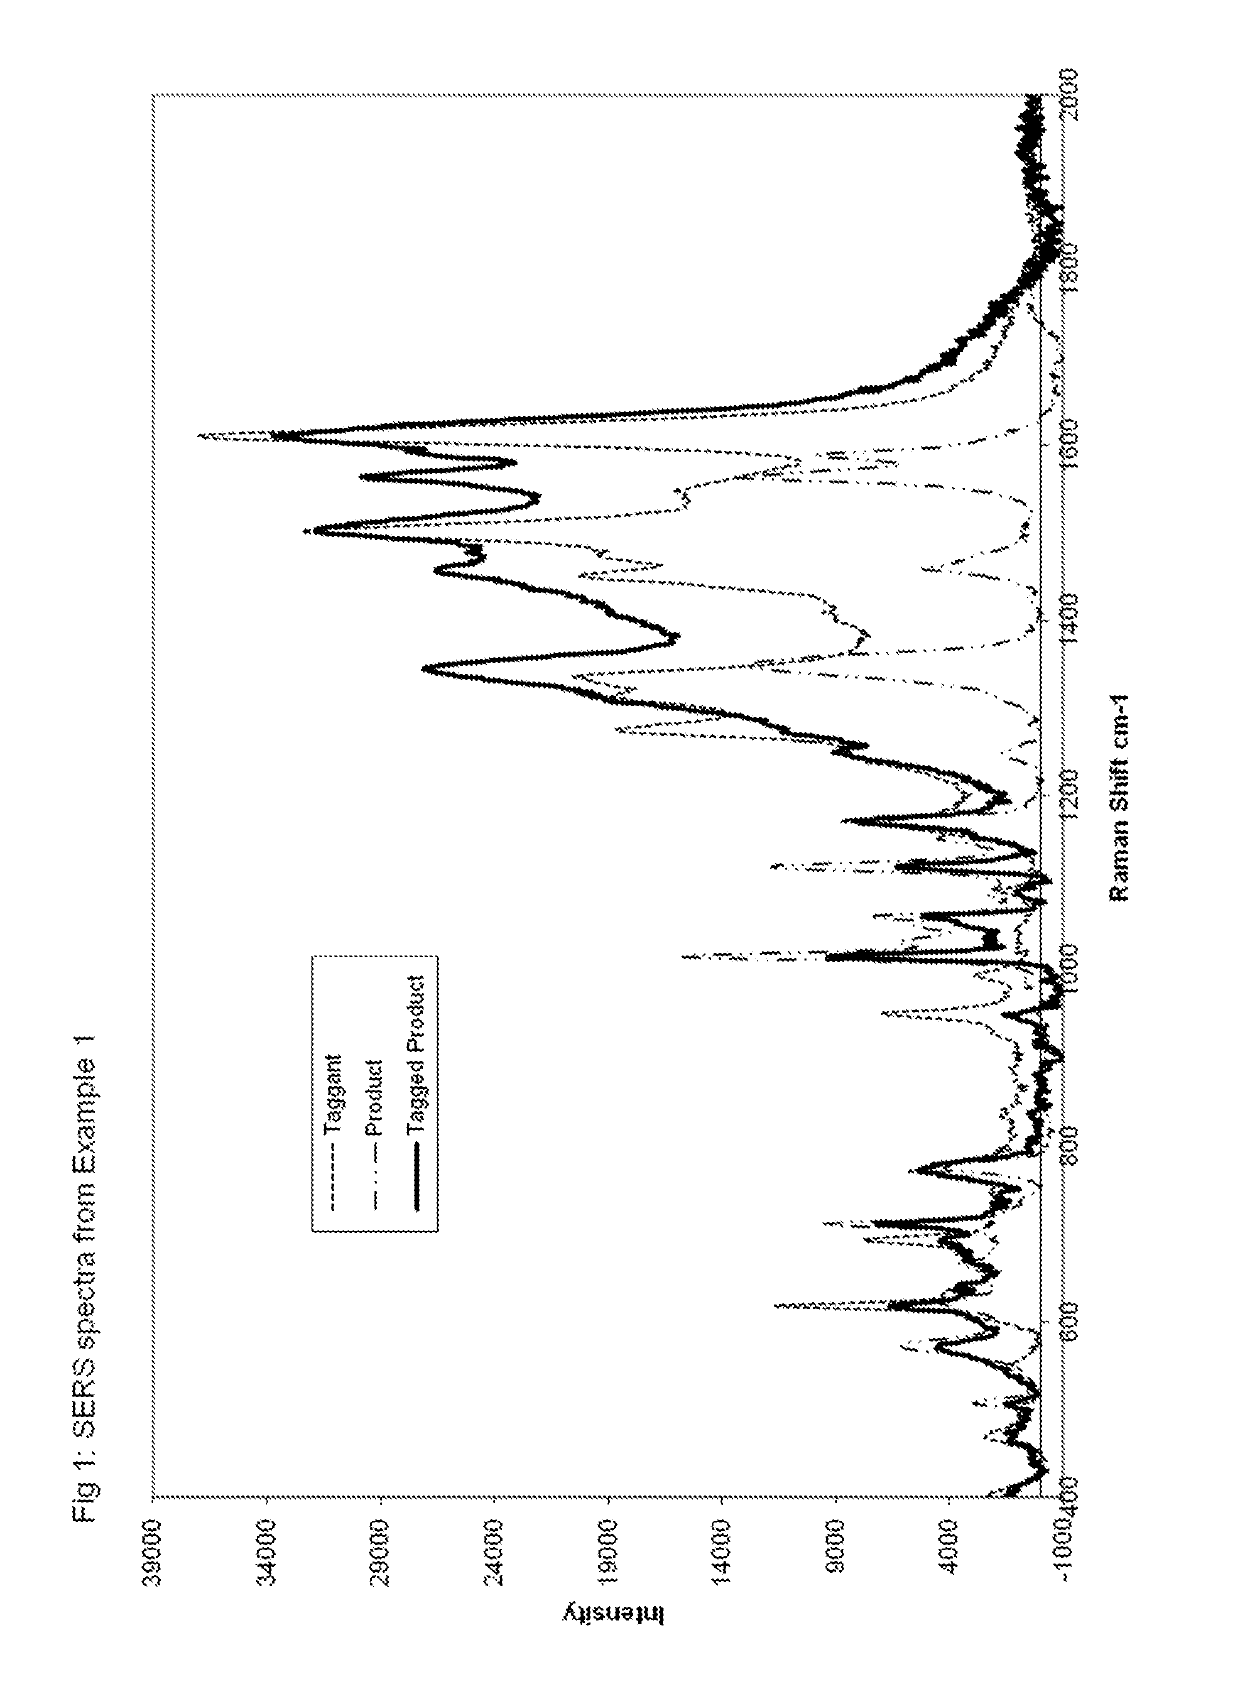
[0033]The Raman spectrum obtained from the sample is shown in FIG. 1 as the bold line of the spectrum. Also shown in FIG. 1 for comparison are spectra of the tracer compound in water (dashed line) and the untagged pesticide product (dot-dashed line).
[0034]Comparing the spectra, it is clear that there are several peaks in the tagged product spectrum which are attributable either to the tracer or the product and that these peaks can be used to determine the relative amo...
example 2
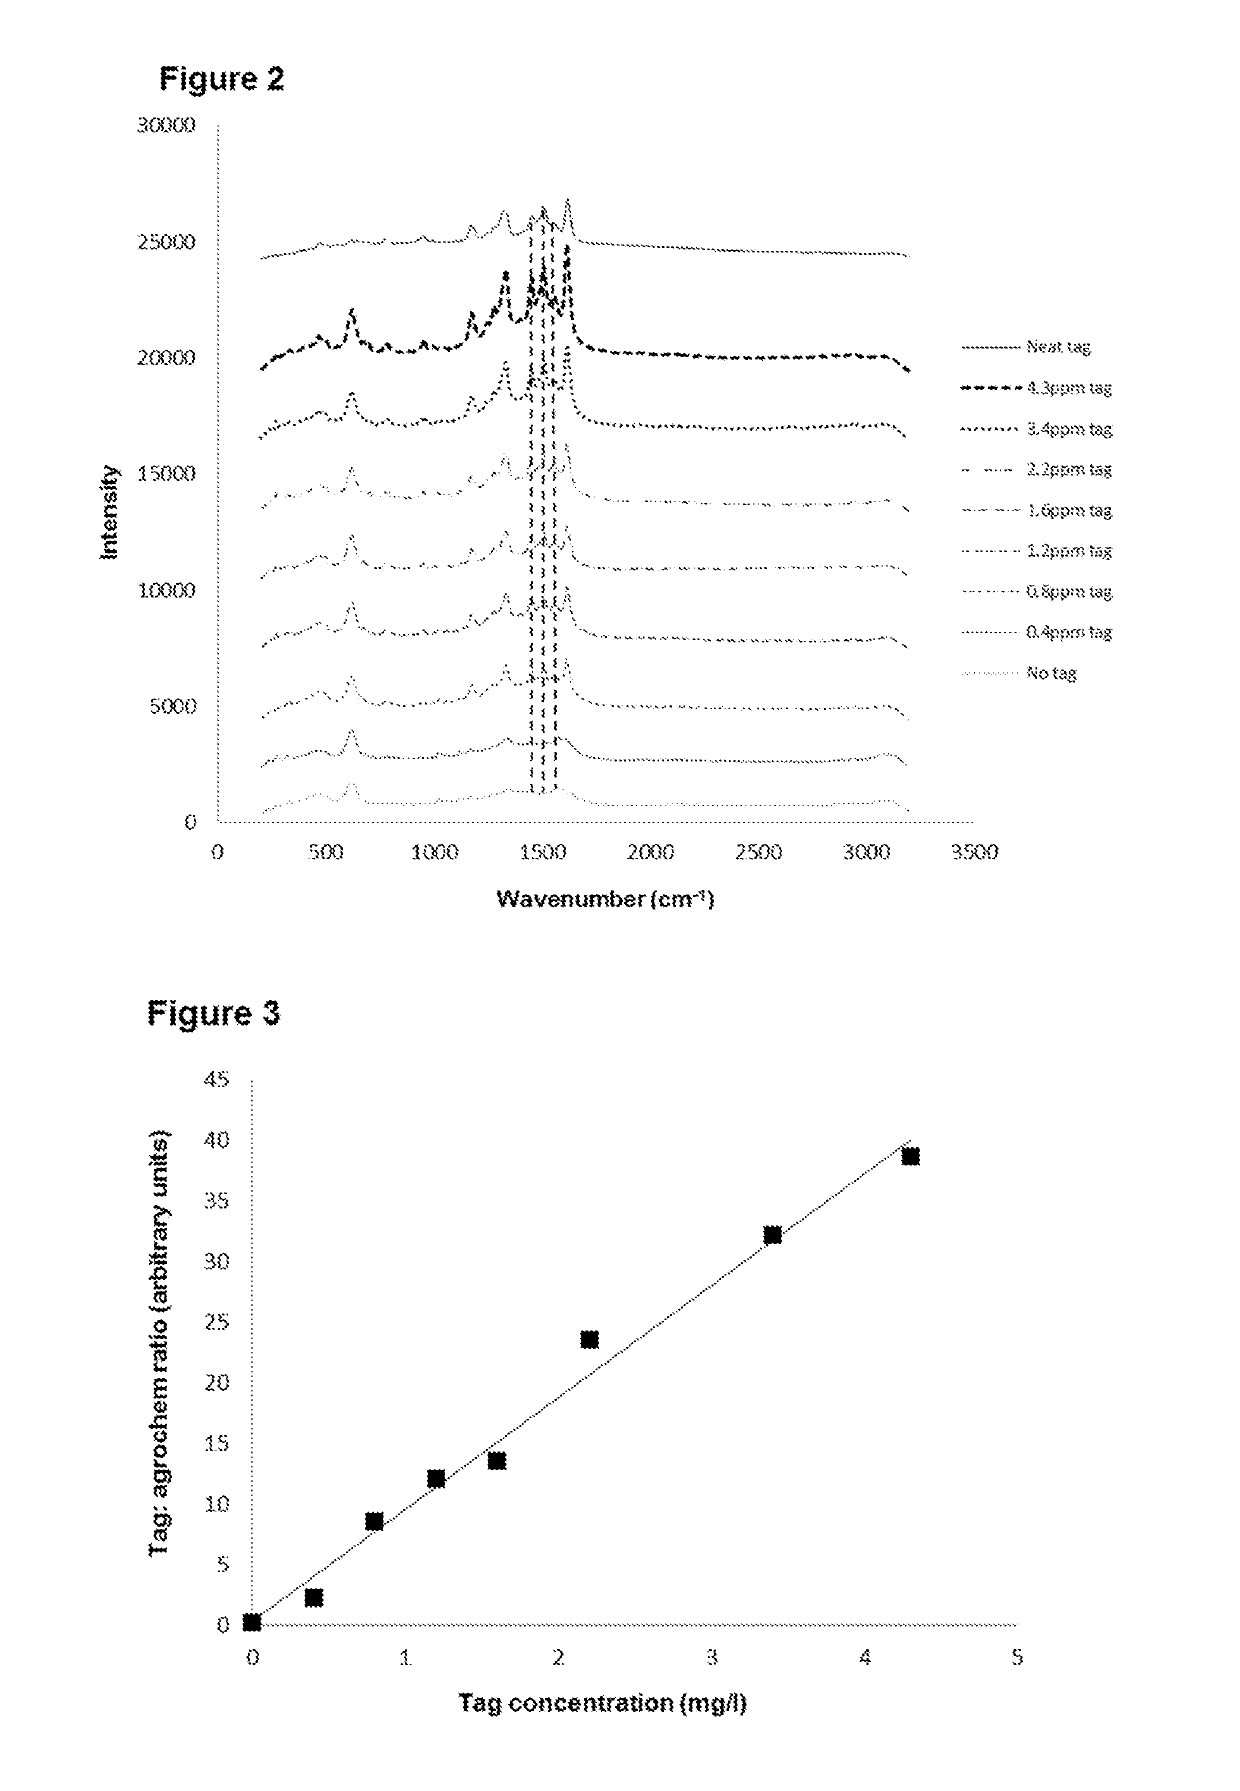
[0035]A Raman active tracer compound, selected from the current list of compounds approved for addition to foods, was used to tag a commercially available agrochemical formulation. A solution containing 100 mg / l of the Raman active tracer compound was prepared in deionised water. Portions of this solution were used to tag samples of an agrochemical product at concentrations of the Raman active compound in the agrochemical formulation ranging from 0 mg / l to 5 mg / l.
[0036]Samples of the tagged and untagged agrochemical product were diluted to at least 1 / 10 concentration with deionised water prior to analysis. The diluted agrochemical product (<10 microliters) was added to water (130 microliters) in a 2 ml screw top glass vial. Silver colloid (130 microliters) was added and then spermine (10 microliters, 0.01 M) was also added as an aggregating agent. The vial was agitated thoroughly. Raman spectra were acquired on a Sierra 532 nm Raman spectrometer from Snowy Range Instruments Inc, wit...
example 3
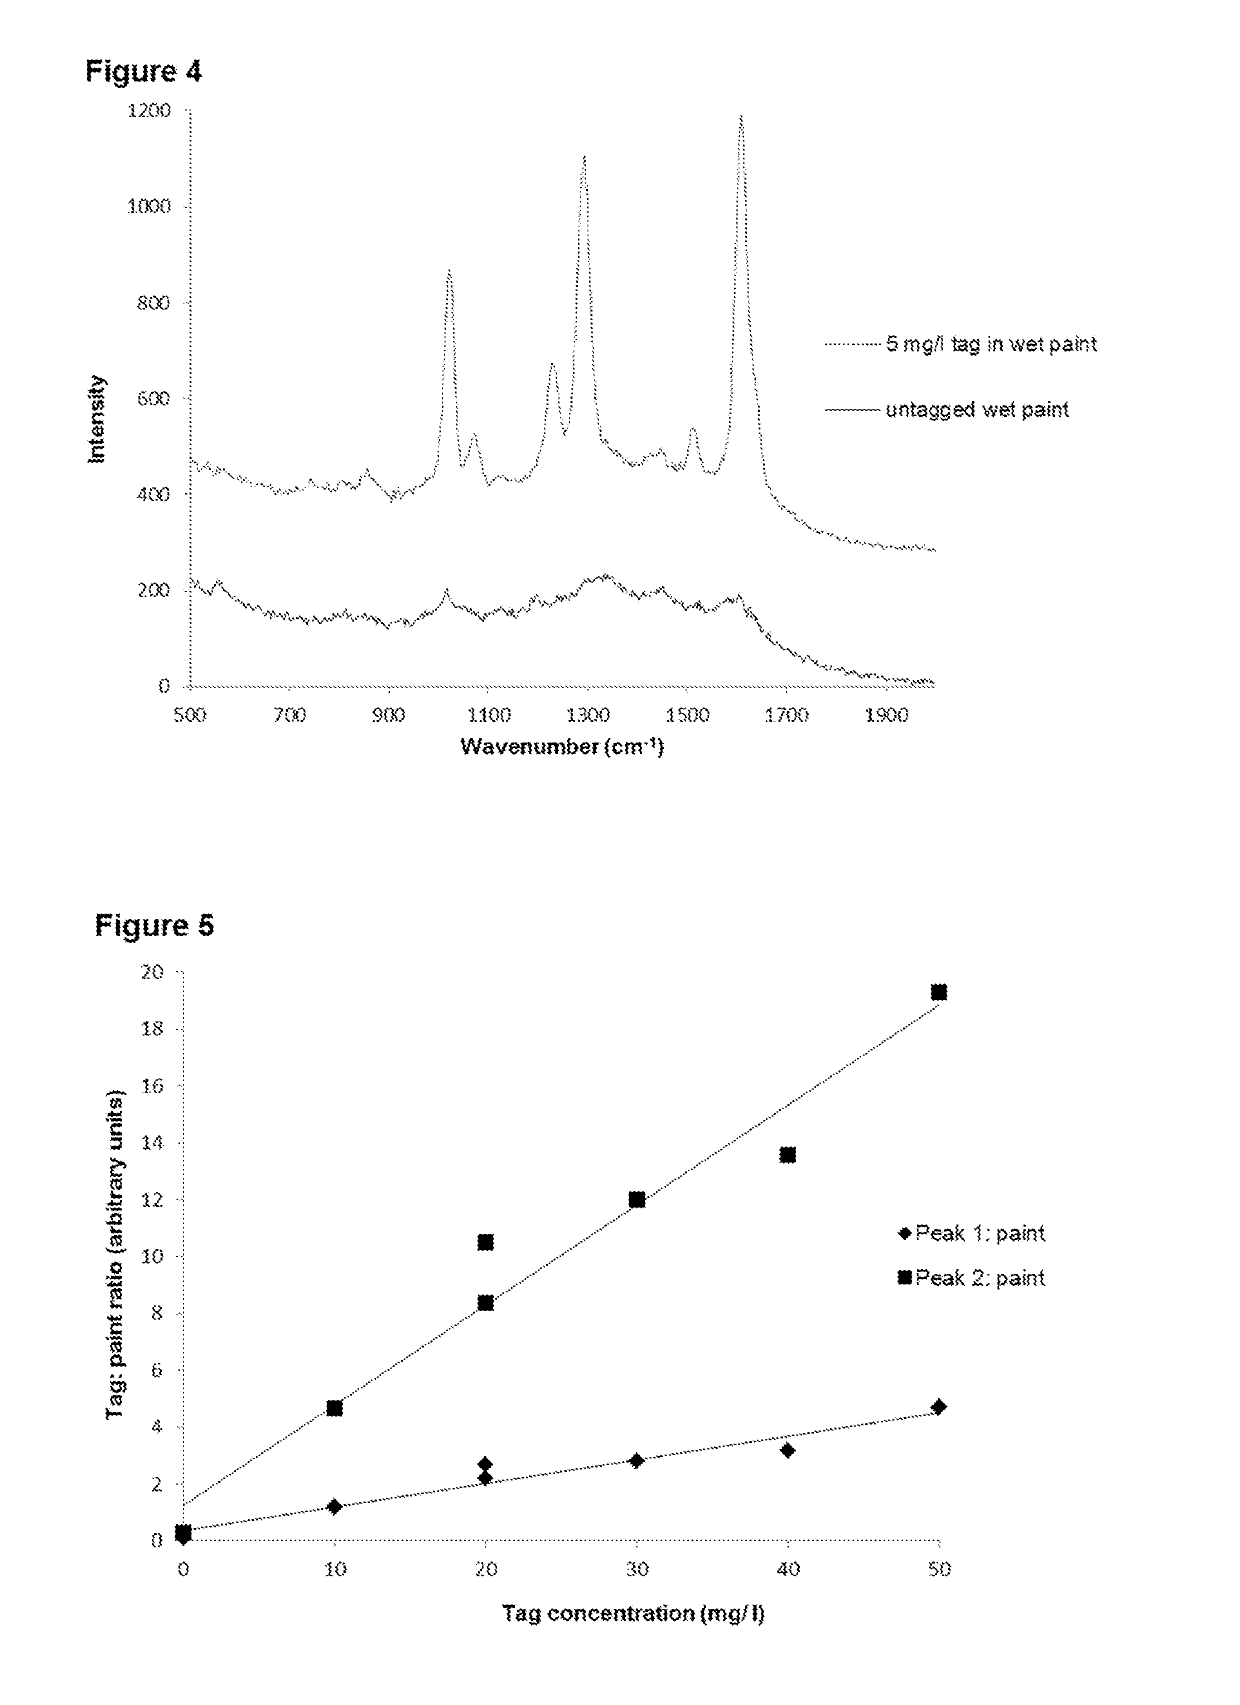
[0039]A Raman active tracer compound was used to tag a commercially available matte white paint. A solution containing 4 mg / l of the Raman active compound was prepared in deionised water. Portions of this solution were used to tag samples of paint at concentrations of the Raman active compound in the paint ranging from 0 mg / l to 50 mg / l.
[0040]Prior to analysis, the sample of paint under test was diluted to 1 / 10 concentration with deionised water. The diluted paint (30 microliters) was added to 90 nm colloidal gold (500 microliters, 0.01% w / vol) in a 2 ml screw top glass vial. This was agitated thoroughly and salt solution (500 microliters, 10% w / vol) was then added. The sample was centrifuged for five minutes at 2500 rpm. Raman spectra were acquired on a 785 nm QE65000 Raman spectrometer from Ocean Optics Inc with a 1 second acquisition time and laser power of 180 mW.
[0041]FIG. 4 compares the Raman spectrum of tagged and untagged paint. The ratio of the height of two peaks from the ...
PUM
 Abstract
Description
Claims
Application Information
 - R&D
- Intellectual Property
- Life Sciences
- Materials
- Tech Scout
- Unparalleled Data Quality
- Higher Quality Content
- 60% Fewer Hallucinations
Browse by: Latest US Patents, China's latest patents, Technical Efficacy Thesaurus, Application Domain, Technology Topic, Popular Technical Reports.
© 2025 PatSnap. All rights reserved.Legal|Privacy policy|Modern Slavery Act Transparency Statement|Sitemap|About US| Contact US: help@patsnap.com


