
Zero crossing method of symbol rate and timing estimation

Active Publication Date: 2004-07-08
NATIONAL INSTRUMENTS
View PDF13 Cites 23 Cited by
  • Summary
  • Abstract
  • Description
  • Claims
  • Application Information

AI Technical Summary

Problems solved by technology

The ever-increasing speeds of data and communication signals result in new or changing design and test challenges--including the increased likelihood of pattern-dependent failures.
As bit rates increase to 10 Gb / s and beyond, pattern-dependent failures become much more common in the generation, transmission, and reception of signals in various data and communication products and systems.
Unfortunately with traditional test technologies, it is often difficult and time-consuming to reliably identify and observe these failures.
Bit error rate testers can be used to determine the total number of bit failures in the generated bit stream, but may not identify the specific patterns that caused the failures.
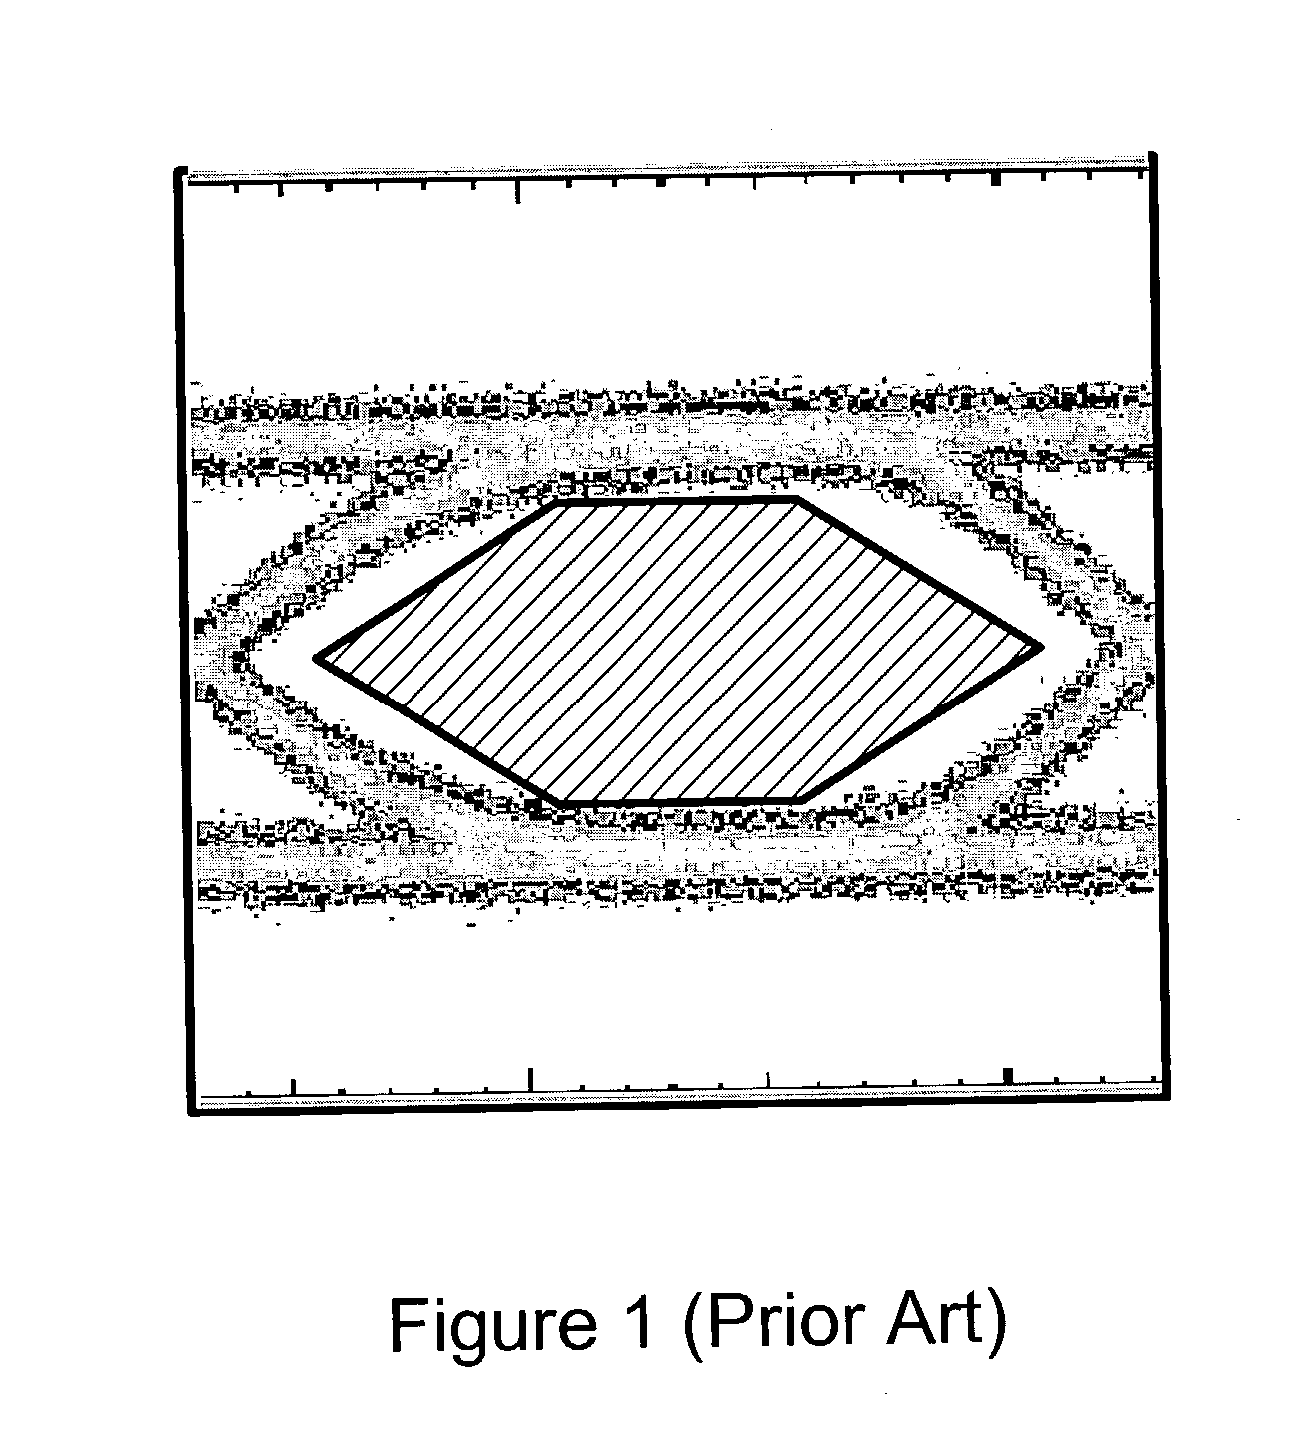
If the eye diagram is not acceptable then the transceiver is not operating properly and must be "tuned", or programmed, with new operating parameters.
Yet, the bus's 12-Mbit / s speed has limited its usefulness for products such as video cameras and DVD players.
The diagram facilitates measurement of a signal's rise time, fall time, undershoot, overshoot, and jitter, and may reveal problems in terminations of USB data lines.
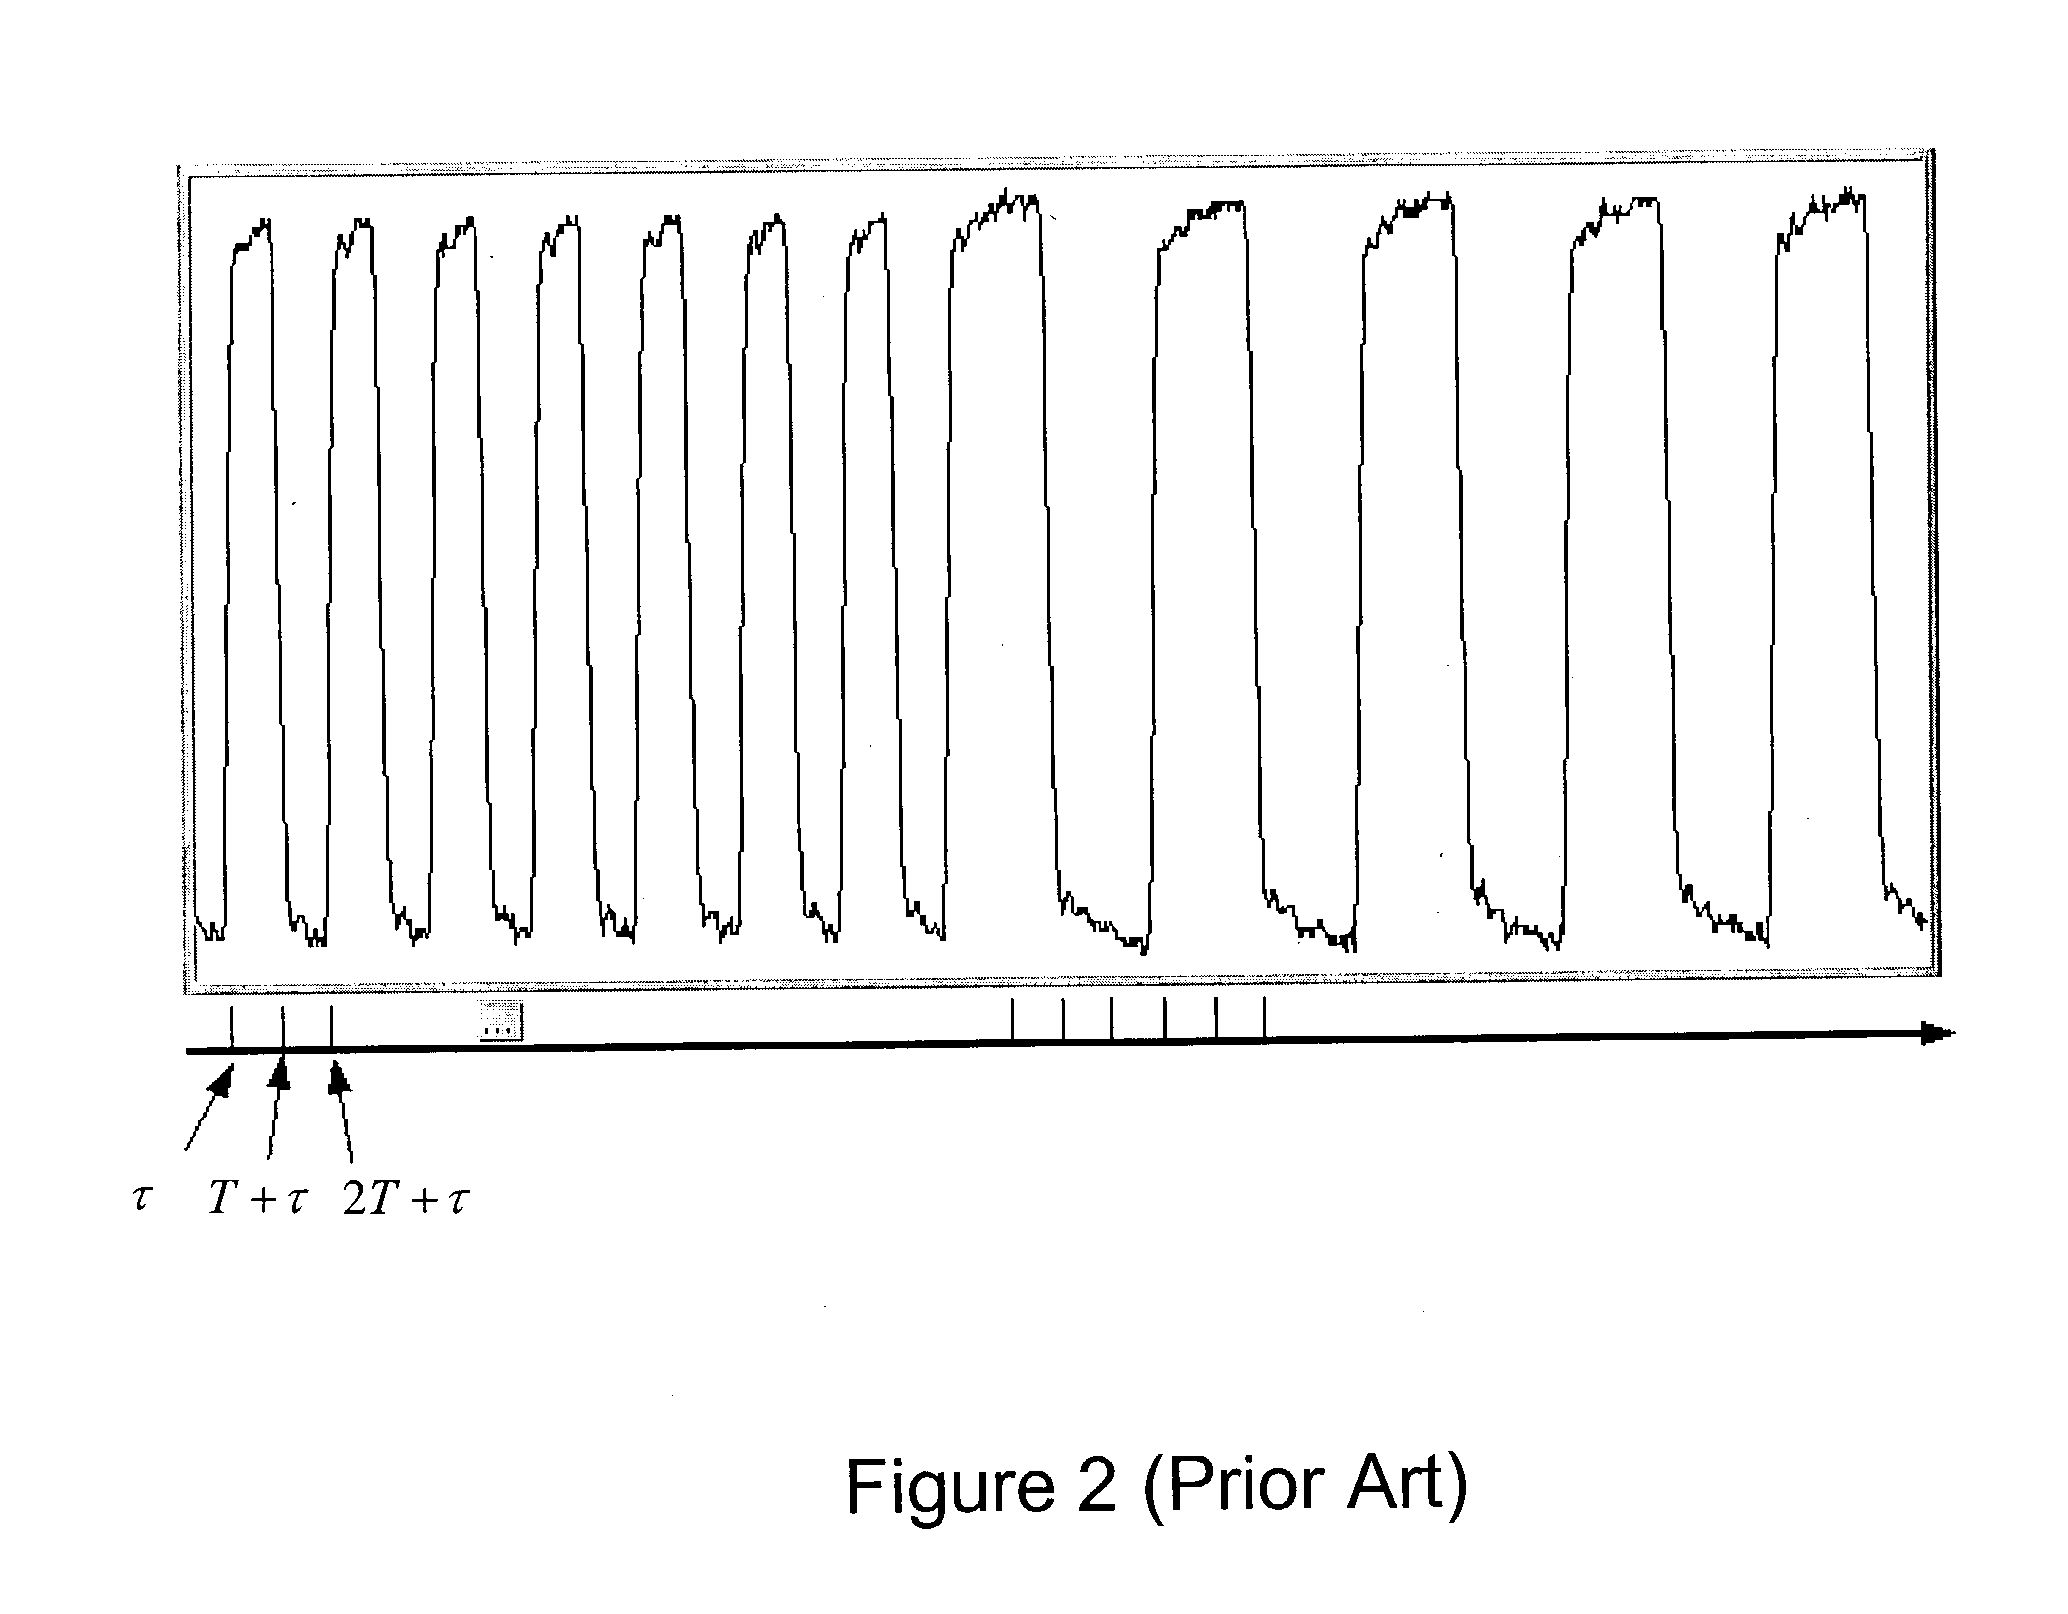
It is noted that in high speed digital communications, even small errors in this estimation, e.g., on the order of a few pico-seconds, may degrade an eye diagram to the point of uselessness. FIG. 3B illustrates an eye diagram resulting from inaccurate estimates of symbol period and offset.
As FIG. 3B shows, such inaccuracies result in significant spread of relative zero crossing points, rendering the eye diagram substantially useless for analyzing the digital signal.
However, these iterative methods are generally fairly complex and computationally expensive, and thus may require significant time to perform.
Additionally, the complexity of the iterative algorithms generally results in significant maintenance effort over the lifetime of the implementation program code.

Method used


Image

  • Zero crossing method of symbol rate and timing estimation
  • Zero crossing method of symbol rate and timing estimation
  • Zero crossing method of symbol rate and timing estimation

Examples


Embodiment Construction

[0045] Incorporation by Reference

[0046] The following publications are hereby incorporated by reference in their entirety as though fully and completely set forth herein:

[0047] The Universal Serial Bus (USB) 2.0 Specification.

[0048] FIG. 4--Signal Analysis System

[0049] FIG. 4 illustrates a signal analysis system 100 which may be operable to perform signal analysis, according to one embodiment of the present invention. As FIG. 3 illustrates, the signal analysis system 100 may include a computer system 102 coupled to an instrument 106, e.g., an oscilloscope or digital sampler, via a bus, or over a network, such as the Internet. The computer system 102 may comprise one or more processors, a memory medium, display, an input device or mechanism, such as a keyboard or mouse, and any other components necessary for a computer system.

[0050] The instrument 106, e.g., the oscilloscope, may be operable to receive signals from a signal source, and generate signal data from the signals. Alternati...


PUM


Abstract

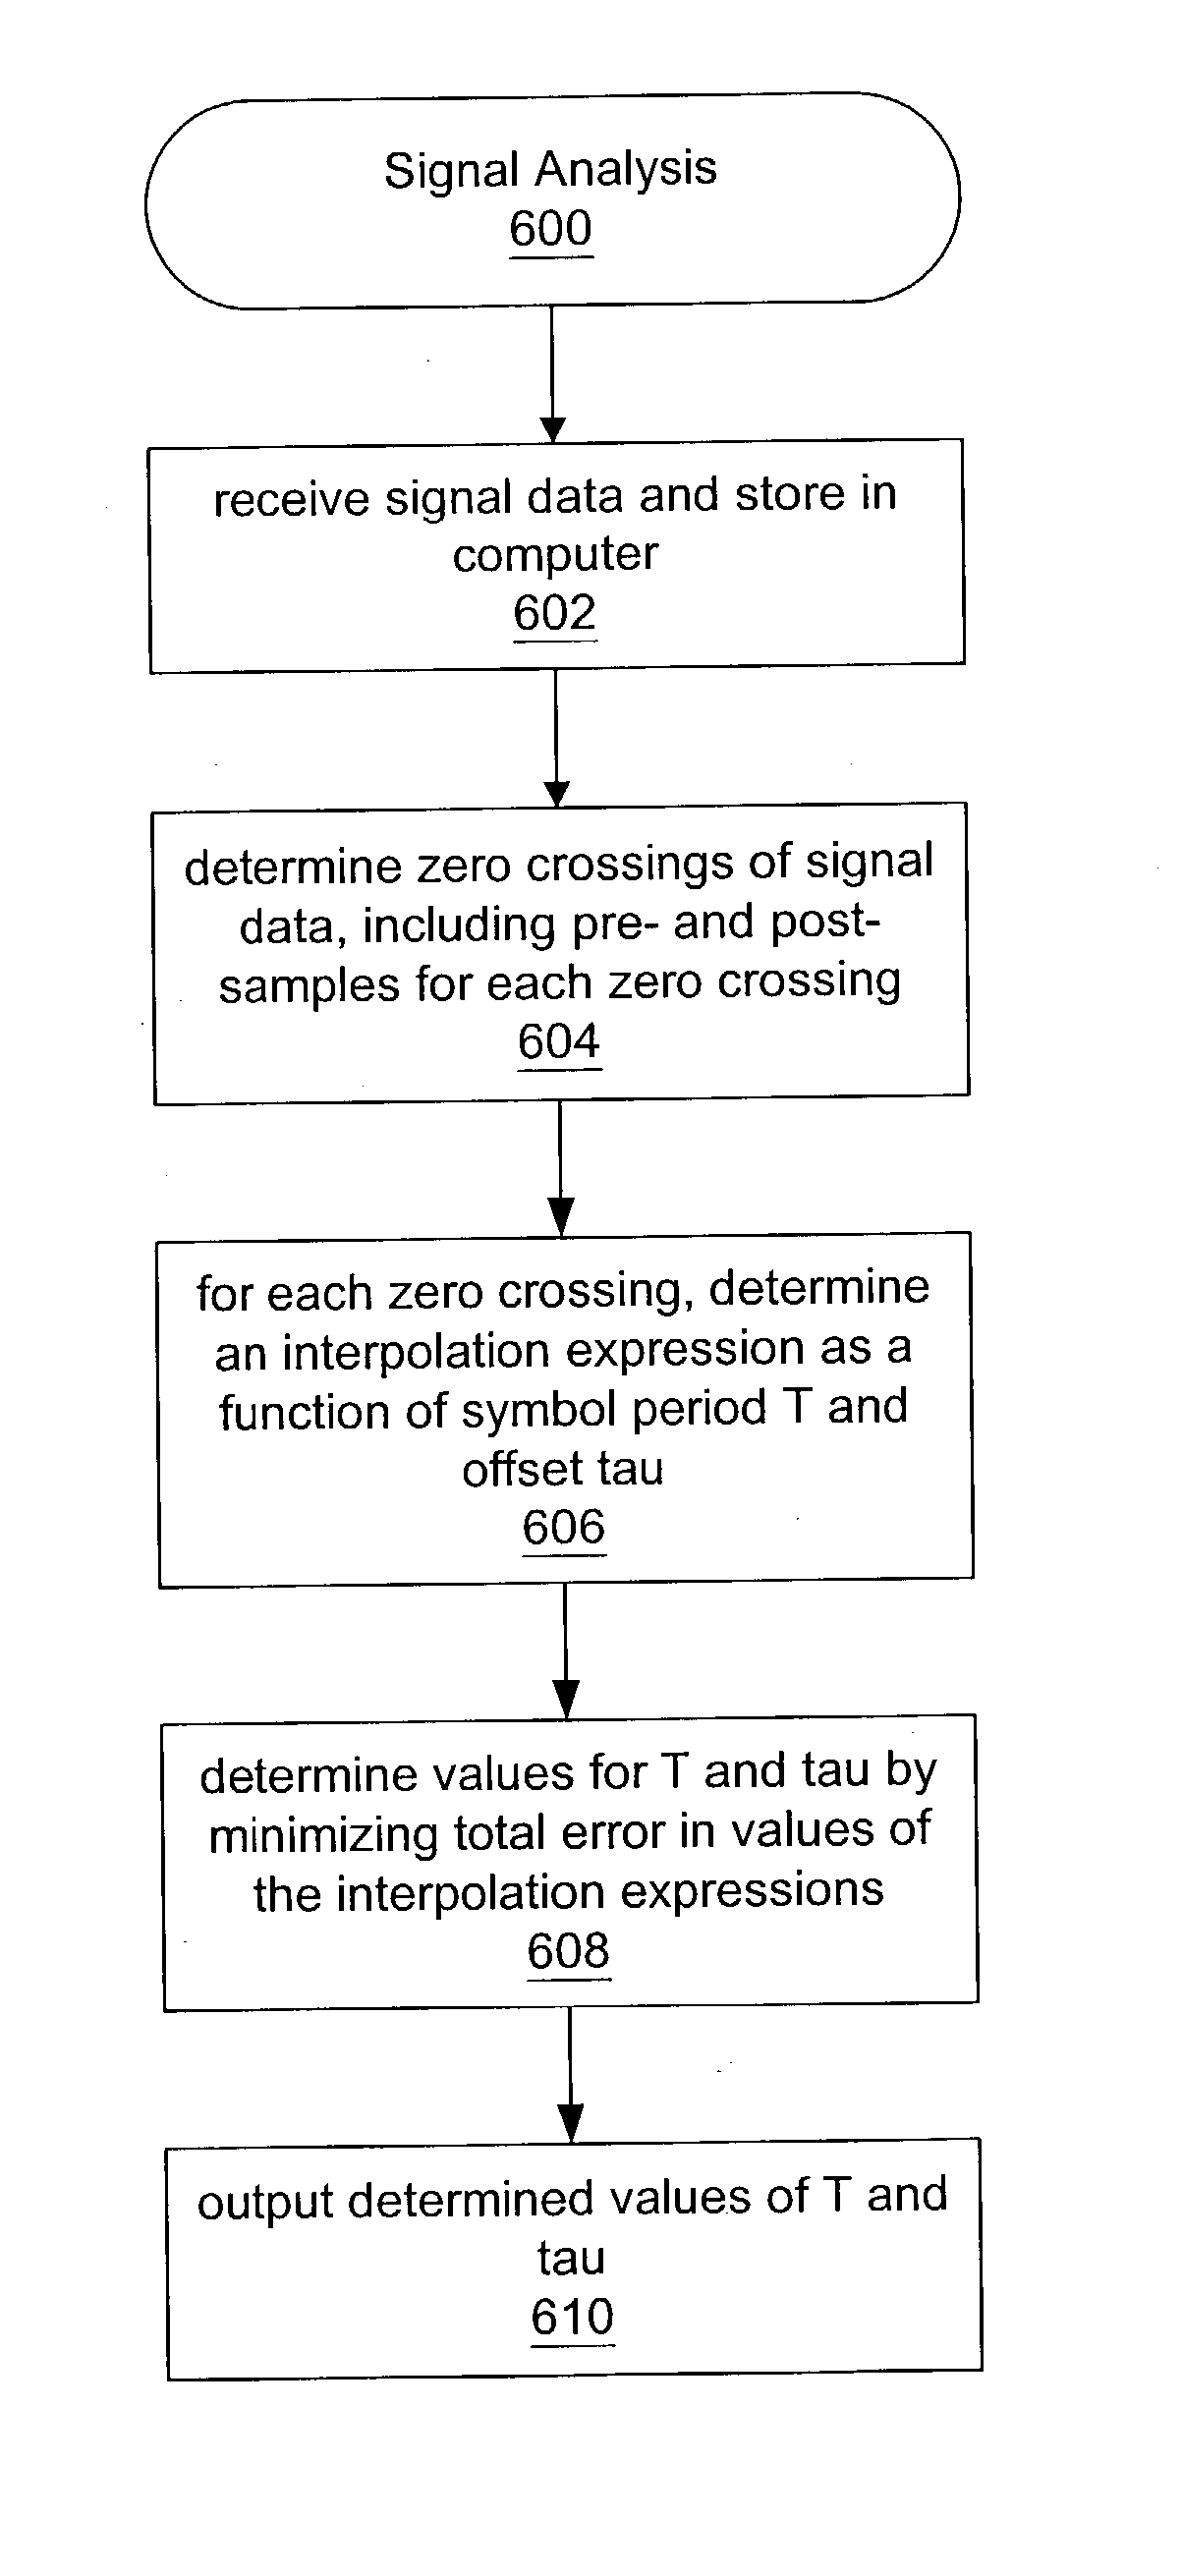
System and method for analyzing communication signals. A digital signal comprising multiple samples is received, representing a plurality of binary symbols. Zero crossings of the signal are determined, each comprising a respective first sample immediately preceding the zero crossing and a respective second sample immediately following the zero crossing. Per zero crossing, an error expression is determined interpolating between the first and second samples as a function of estimated period T and estimated offset tau of the signal. Based on the error expressions, values of T and tau are determined using a linear fit that minimizes a total error of values of the error expressions. T and tau are usable in analyzing the signal, e.g., each zero crossing corresponds to a respective symbol represented by a respective segment of the signal. The segments are overlaid based on T and tau, forming an eye diagram usable to analyze the signal.

Description

[0001] The present invention relates generally to digital signal analysis, and more particularly, to the estimation of symbol rate and timing for a digital signal.DESCRIPTION OF THE RELATED ART[0002] Signal communications have become central to many aspects of the modern world. In fact, virtually all modern business, manufacturing, engineering, and scientific enterprises rely substantially on signal communications to perform their activities. To support this ubiquitous phenomenon, a vast and varied technological infrastructure has been, and continues to be, developed, including wireless and wired telecommunications media, fiber-optic components, routers, transmitters, analog and digital signal processing chips, and myriad software programs for managing, processing, analyzing, and transmitting these signals, among others. These communications related components generally require testing and diagnostic analysis to ensure proper behavior and / or design, as well as calibration and tuning...

Claims


Application Information

Patent Timeline
IPC IPC(8): H04B3/46H04L25/02H04L25/06H04Q1/20
CPCH04L7/0029H04L1/20H04L25/069H04L25/0262
Inventor RAO, YONG
Owner NATIONAL INSTRUMENTS
Learn More