
Method for separating fluorescence spectra of dyes present in a sample

a dye and fluorescence spectra technology, applied in the field of illumination and detection of fluorescence signals, can solve the problems of inability to apply fluorescence measurements using scanning microscopes, and inability to achieve optimal information acquisition,

Active Publication Date: 2005-03-03
LEICA MICROSYSTEMS CMS GMBH
View PDF24 Cites 25 Cited by
  • Summary
  • Abstract
  • Description
  • Claims
  • Application Information

AI Technical Summary

Benefits of technology

A further object of the invention is to create a method that makes possible the acquisition of optimum color information from a fluorescing microscopic specimen.
The method has the advantage that firstly an illuminating light is generated from at least one laser that emits light of one wavelength, the generated illuminating light encompassing a continuous wavelength region. The dyes present in the specimen are communicated to a computer system, and the pertinent excitation and emission spectra, stored in a database, are read out from the database for further calculations. A band of the illuminating light is calculated for each dye present in the specimen. A band of the detected light is likewise calculated for each dye present in the specimen. The excitation and emission spectra read out from the database are employed for calculation.

Problems solved by technology

The method presented here is suitable in particular for determining the spectra of the individual chromosomes, but cannot be applied to fluorescence measurements using a scanning microscope.
Optimum information acquisition is not, however, possible with this method.

Method used


Image

  • Method for separating fluorescence spectra of dyes present in a sample
  • Method for separating fluorescence spectra of dyes present in a sample
  • Method for separating fluorescence spectra of dyes present in a sample

Examples


Embodiment Construction

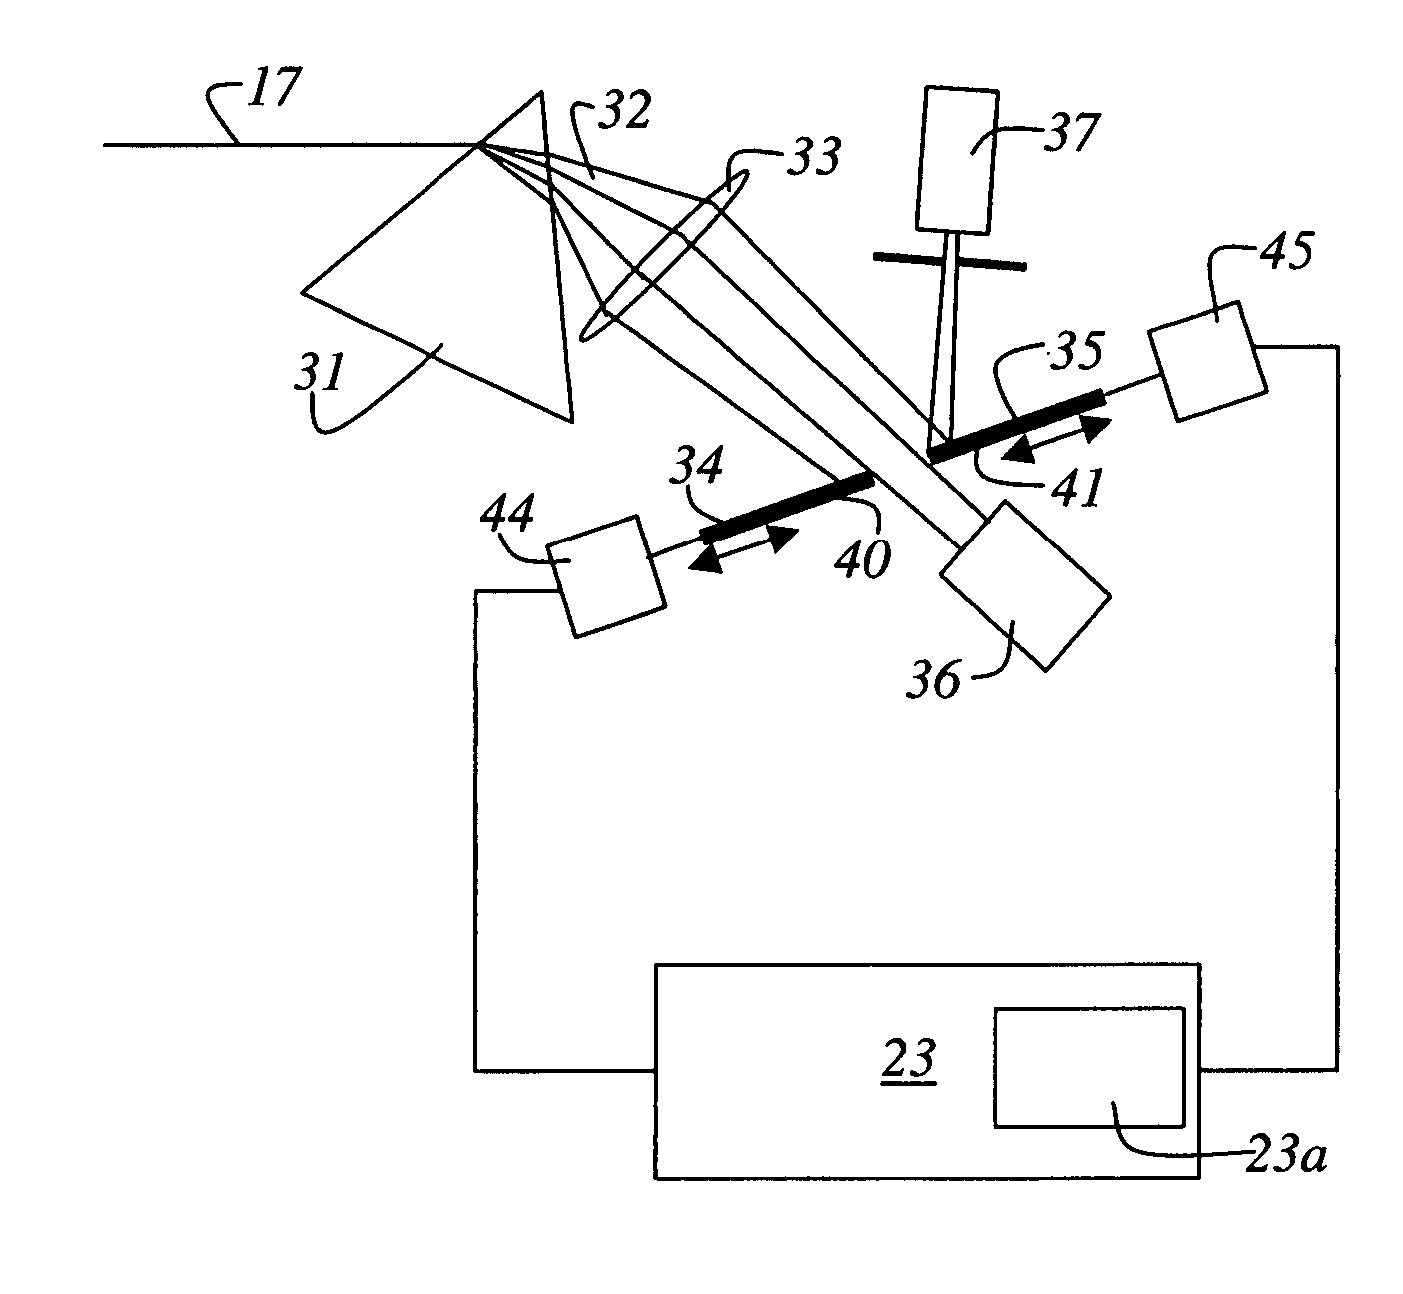
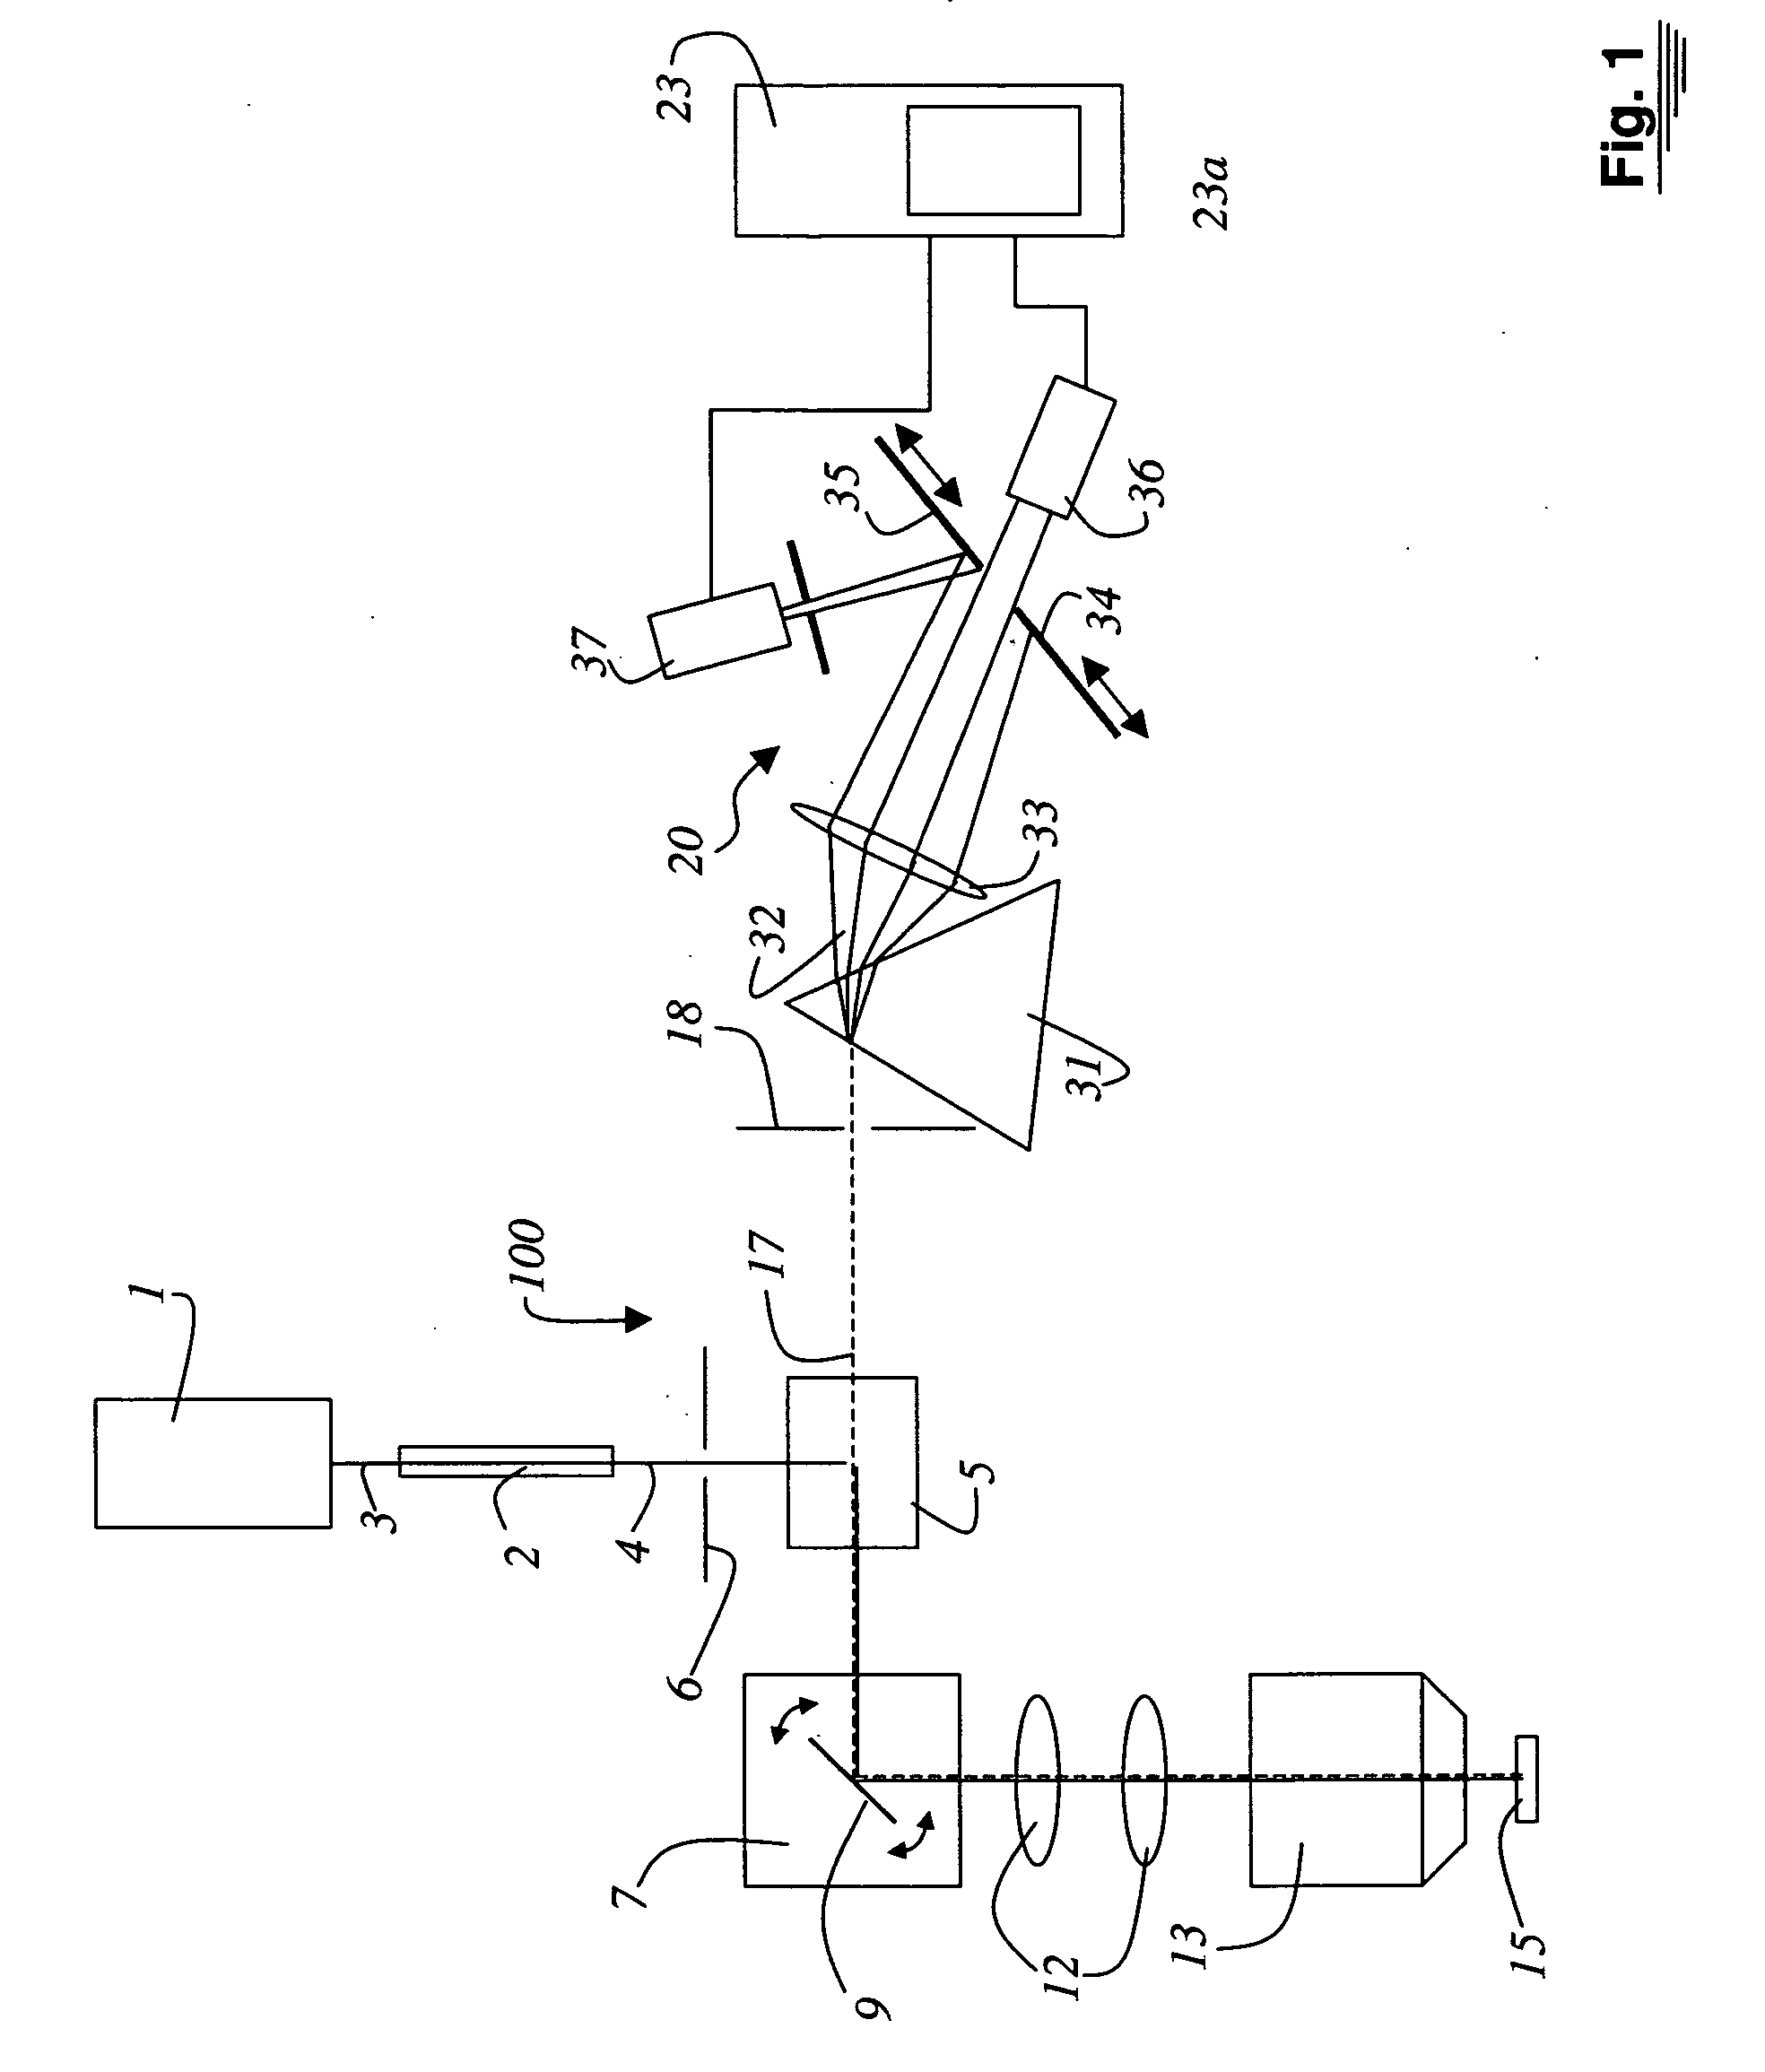
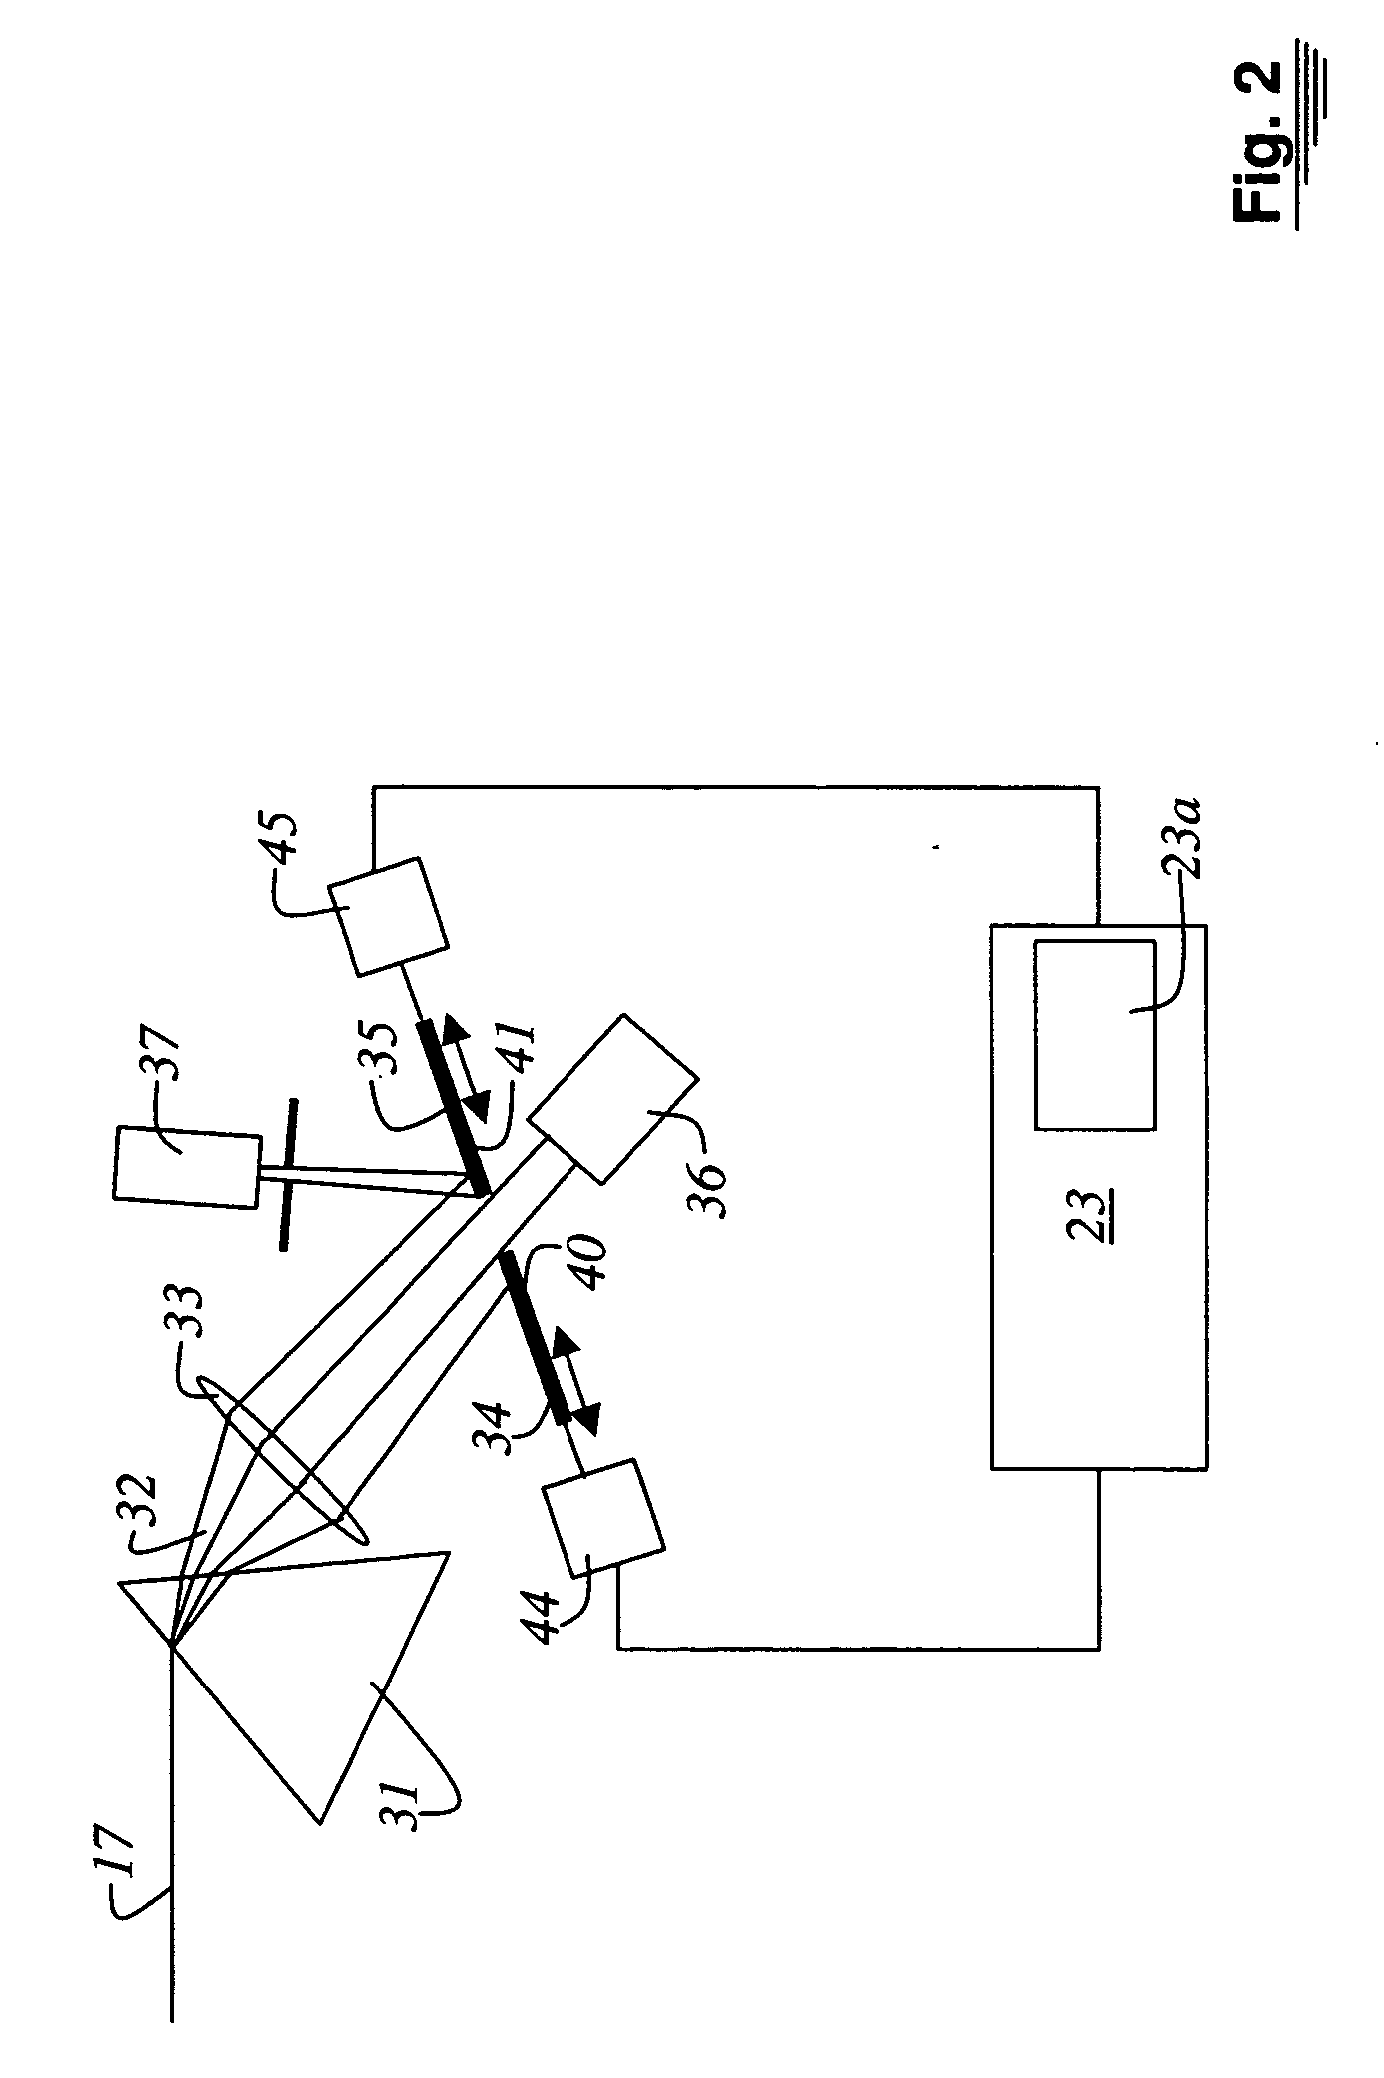
FIG. 1 schematically shows the exemplary embodiment of a confocal scanning microscope 100. This is not, however, to be construed as a limitation of the invention, and one skilled in the art is well aware that the same invention-relevant components can also be installed in fluorometers, cytometers, and microscope systems of different design. Illuminating light 3 coming from at least one illumination system 1 is directed by a beam splitter or a suitable deflection means 5 to a scanning module 7. Before illuminating light 3 encounters deflection means 5, it passes through an illumination pinhole 6. Scanning module 7 encompasses a gimbal-mounted scanning mirror 9 that guides illuminating light 3 through a scanning optical system 12 and a microscope optical system 13 and over or through a specimen 15. A light guiding fiber or a micro structured optical element 2 can be configured in such a way that it generates white light from the light of a laser (the laser is illumination system 1). T...


PUM

PropertyMeasurementUnit
spectral scanning microscopeaaaaaaaaaa
wavelengthaaaaaaaaaa
emission spectraaaaaaaaaaa

Abstract

A system and a method for setting a fluorescence spectrum measurement system for microscopy is disclosed. Using illuminating light (3) from at least one laser that emits light of one wavelength, a continuous wavelength region is generated. Dyes are stored, with the pertinent excitation and emission spectra, in a database of a computer system (23). For each dye present in the specimen (15), a band of the illuminating light (3) and a band of the detected light (17) are calculated, the excitation and emission spectra read out from the database being employed. Setting of the calculated band in the illuminating light and in the detected band [sic] is performed on the basis of the calculation. Lastly, data acquisition is accomplished with the spectral microscope (100).

Description

RELATED APPLICATIONS This application claims priority of the German patent application 103 39 311.0 which is incorporated by reference herein. FIELD OF THE INVENTION The invention concerns a system for illumination and for the detection of fluorescence signals. The invention further concerns a spectral microscope. The invention furthermore discloses a method for determining illumination and detection parameters for the sensing of fluorescence processes. The invention further concerns a method for data acquisition using a spectral microscope. BACKGROUND OF THE INVENTION U.S. Pat. No. 6,097,870 discloses an arrangement for generating a broadband spectrum in the visible and infrared spectral region. The arrangement is based on a microstructured fiber into which the light of a pump laser is coupled. In the microstructured fiber, the pump light is broadened by nonlinear effects. So-called photonic band-gap material or photon crystal fibers, or “holey” fibers, are also used as microst...

Claims


Application Information

Patent Timeline
Patent Type & Authority Applications(United States)
IPC IPC(8): G01J3/28G01J3/44G01N21/64
CPCG01J3/4406G01J2003/2833G01N21/6428G02B21/0076G01N2021/6417G01N2021/6423G02B21/0064G01N21/6458
Inventor OLSCHEWSKI, FRANK
Owner LEICA MICROSYSTEMS CMS GMBH
Learn More