Method for predicting the behavior of dopant and defect components

a technology of defect and component, applied in stochastic cad, instruments, under protective fluid, etc., can solve problems such as kink or non-optimum distribution of boron, degrade performance, and many parts of boron may not have the proper electrical activity, and achieve the effect of higher performance in electronic devices

Inactive Publication Date: 2005-03-10
SEIKO EPSON CORP +1
View PDF1 Cites 13 Cited by
  • Summary
  • Abstract
  • Description
  • Claims
  • Application Information

AI Technical Summary

Benefits of technology

The technical effect of this patent is to use a new method to predict how certain parts will behave in a semiconductor device made up of layers on top of each other. This helps improve the functioning of those devices by making them more efficient or reliable.

Problems solved by technology

The technical problem addressed by this patent is how to improve the performance and value of electronic devices containing memory, CPUs, transmivers, and detector components by reducing their size, noise, and reproducibility while increasing their speed. This involves creating complex heterostructures where different dopants are distributed precisely and processed to achieve desired properties like electricity and mechanics. Modeling and simulating the behavior of these materials down to the atomic scale is crucial to design optimal devices.

Method used


Image

  • Method for predicting the behavior of dopant and defect components
  • Method for predicting the behavior of dopant and defect components
  • Method for predicting the behavior of dopant and defect components

Examples


example

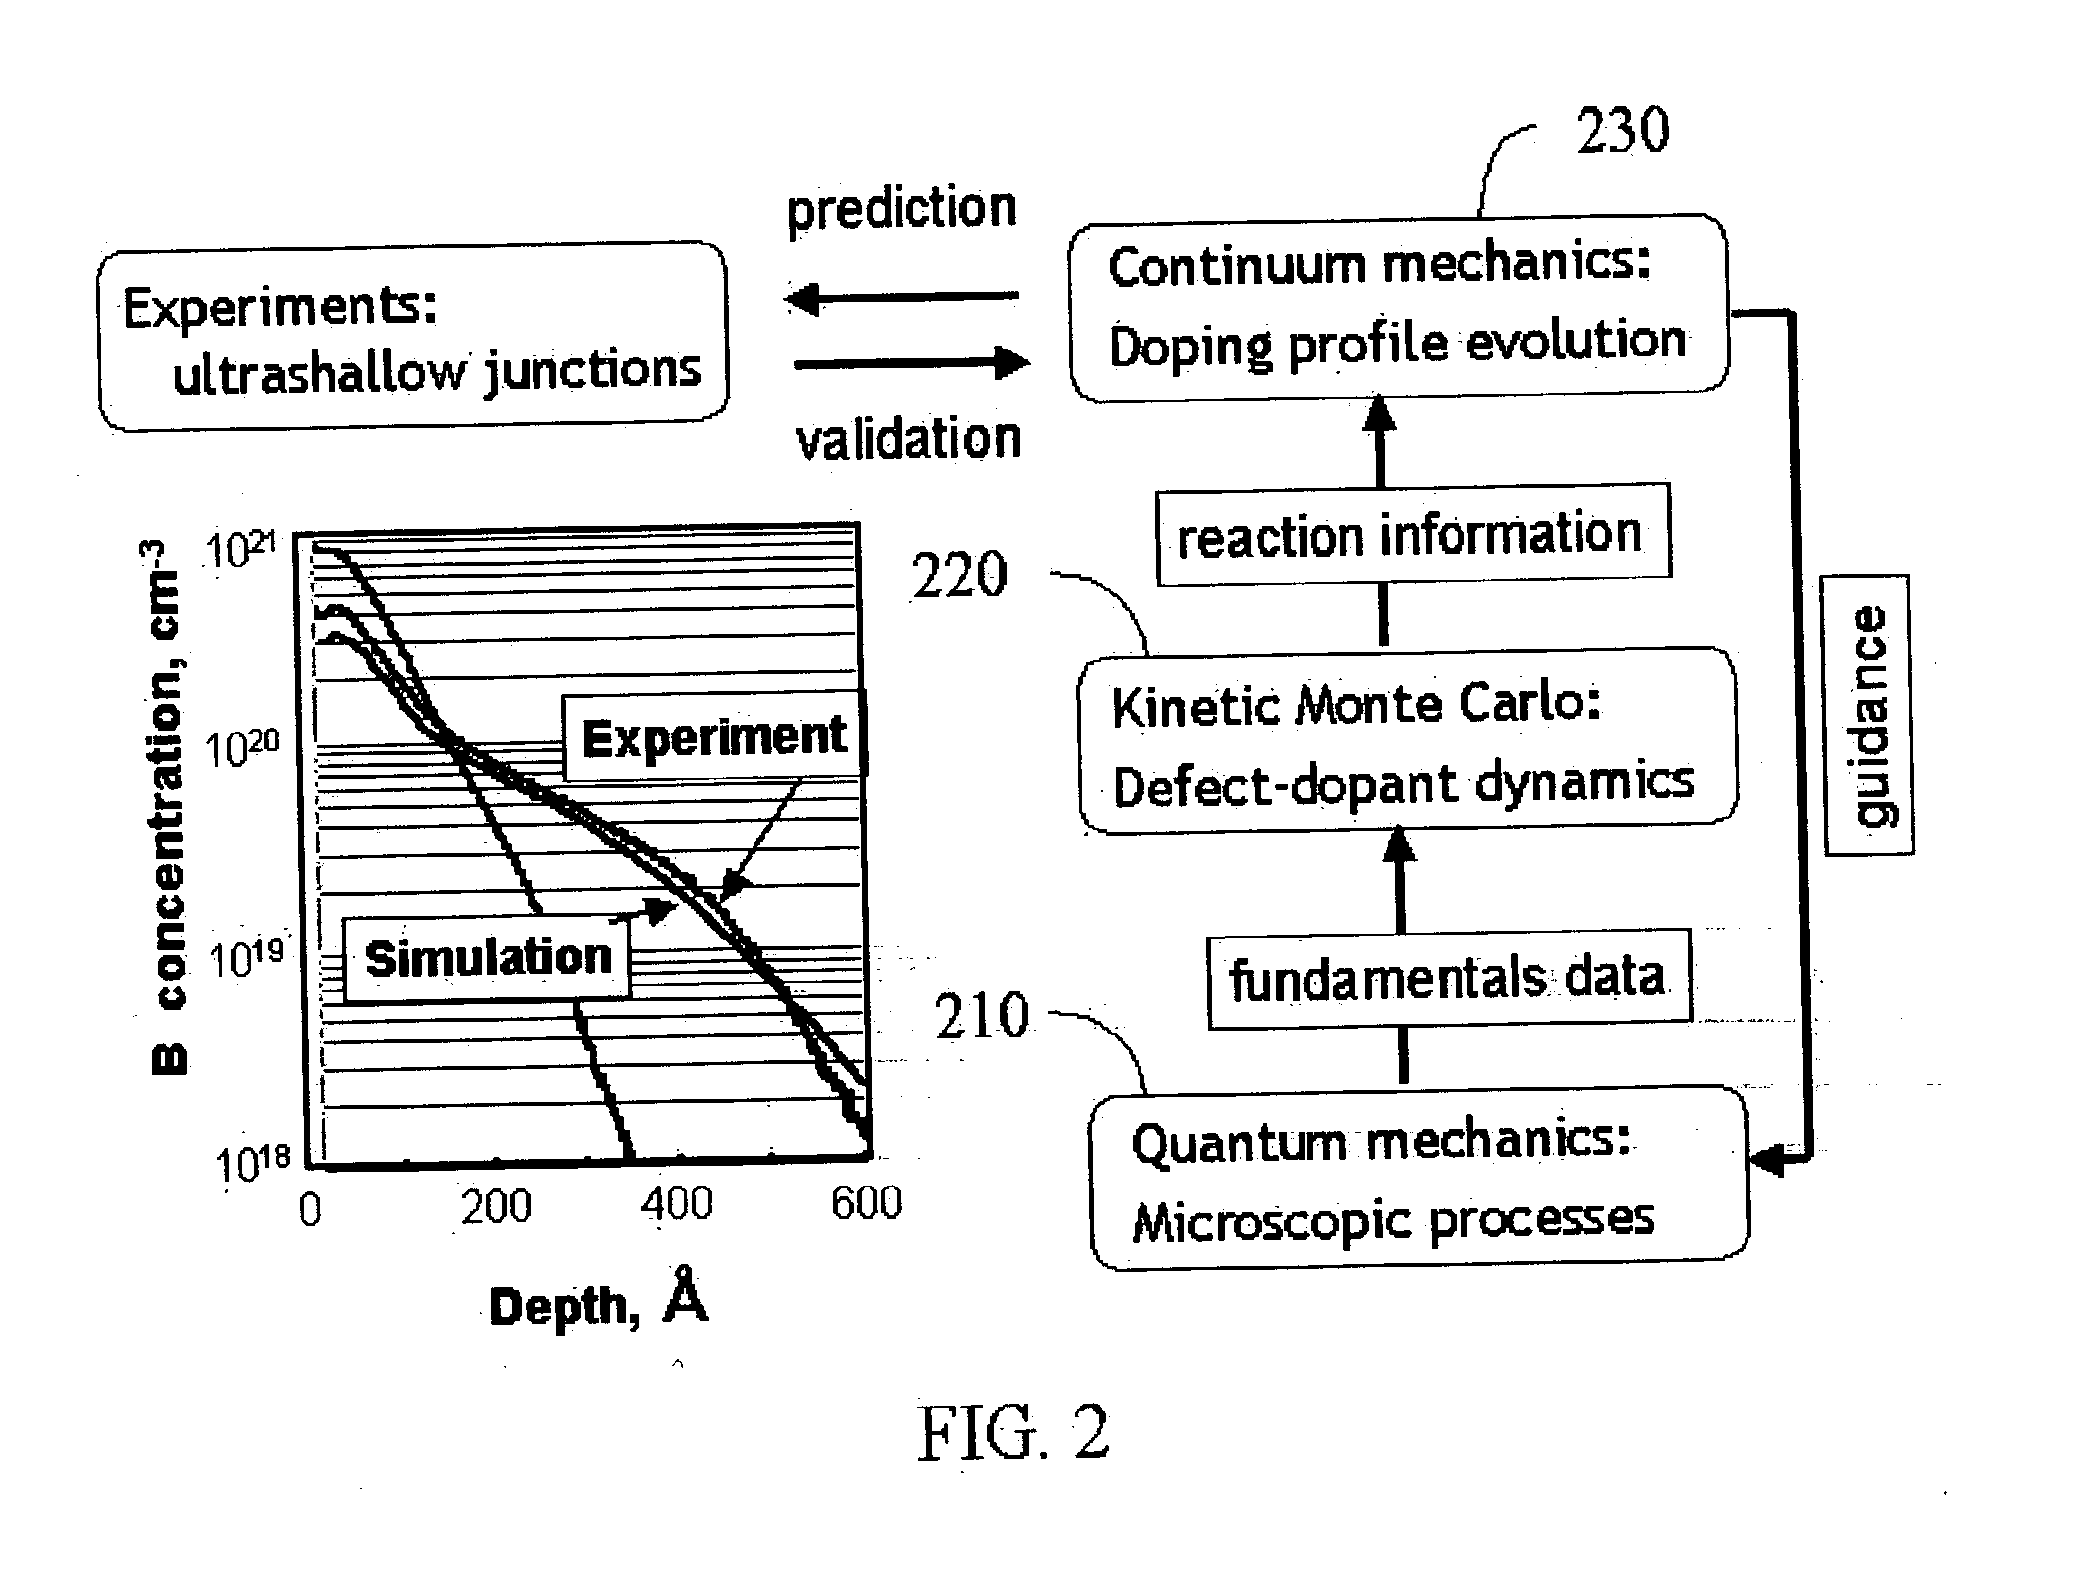
The following example considers the possible distributions of boron, silicon, and vacancies at various substitutional and interstitial sites, including clusters of several atoms and / or defects at any one site. The application of multiscale modeling for ultra shallow junction processing is summarized in FIG. 2.

We first used quantum mechanics calculations 210 to model the relevant microscopic processes. All atomic structures were optimized using the local density approximation (LDA) to density functional theory (DFT), as implemented in the CPMD V3.3 package. Calculation of the energetics of the LDA structures using the generalized gradient approximation (GGA) gave similar-results. We used a non-local, norm-conserving pseudopotential and a plane-wave cutoff energy of 20 Ry. The defect systems considered were modeled using a 192-atom supercell with a fixed volume that yields a Si—Si bond distance of 2.35 Å in pure silicon. All atomic positions were allowed to relax fully until all re...

embodiment 1

FIG. 4 shows the first example. In this example, boron atoms were implanted on a silicon wafer by implantation energy of 1 keV, and the wafer was annealed for 10 seconds at 1000° C. In this calculation, Eb,BsI was set to be 0.75 eV. The distributions of Bs, BsBi, BsBiI2, Bs2Bi, Bs2Bi2, Bs3Bi, and In were calculated by solving the first relationship, Eq. (1), throughout the simulation, and the distributions of I, BsBiI, BsBi2 and BsBi3 were calculated by solving the second relationship, Eq. (5), throughout the simulation. On the other hand, the distribution of BsI was calculated by solving the first relationship in the time period of t≦0.1 μsec, and by solving the second relationship in the time period of t>0.1 μsec. The distributions of BsI2 and BsI3 were calculated by solving the first relationship in the time period of t≦0.1 msec, and by solving the second relationship in the time period of t>0.1 msec. Finally, the doping profile of boron was obtained by summing up the concentrati...

embodiment 2

FIG. 5 shows the second example. In this example, boron atoms were implanted on a silicon wafer by implantation energy of 500 eV, and the wafer was annealed for 10 seconds at 1000° C. In this calculation, Eb,BsI was set to be 0.65 eV. The doping profile of boron was calculated in the same way as that used in Embodiment 1. Experimental data obtained using SIMS measurement is also shown in FIG. 5. Calculated result is in good agreement with experiment.


PUM


Abstract

Techniques for predicting the behavior of dopant and defect components in a substrate lattice formed from a substrate material can be implemented in hardware or software. Fundamental data for a set of microscopic processes that can occur during one or more material processing operations is obtained. Such data can include data representing the kinetics of processes in the set of microscopic processes and the energetics and structure of possible states in the material processing operations. From the fundamental data and a set of external conditions, distributions of dopant and defect components in the substrate lattice are predicted. The distributions of one or more fast components are each predicted by calculating the concentration of the particular fast component for a time period before that fast component reaches its pseudo steady state by solving a first relationship and calculating the concentration of that fast component after the time period by solving a second relationship based on other components, the pseudo steady state of a fast component being a state in which the concentration of that fast component is determined by concentrations of other components. The distribution of Bs3Bi, in addition to the distributions of Bs, BsI, BsI2, BsI3, BsBi, BsBi2, BsBi3, BsBiI, BsBiI2, Bs2Bi, Bs2Bi2, I and In, are calculated by solving the first relationship to predict the distribution of boron after annealing, where Bs and Bi represent substitutional boron and interstitial boron, respectively, and I and In represent interstitial silicon and a cluster of n I's, respectively.

Description


Claims


Application Information

Patent Timeline
Owner SEIKO EPSON CORP
Why Eureka
Try Eureka