Method and apparatus for identifying diagnostic components of a system

Inactive Publication Date: 2005-08-04
COMMONWEALTH SCI & IND RES ORG
View PDF35 Cites 21 Cited by
  • Summary
  • Abstract
  • Description
  • Claims
  • Application Information

AI Technical Summary

Benefits of technology

[0013] (e) identifying a subset of components having com

Problems solved by technology

Where there is a large amount of statistical data, the identification of components from that data which are predictive of a particular feature of a sample from the system is a difficult task, generally because there is a large amount of data to process, the majority of which may not provide any indication or little indication of the features of interest of a particular sample from which the data is taken.
In addition, components that are identified using training sample data are often ineffective at identifying features on test samples data when the test sample data has a high degree of variability relative to the training sample data.
This is often the case in situations when, for example, data is obtained from many different sources, as it is often

Method used


Image

  • Method and apparatus for identifying diagnostic components of a system
  • Method and apparatus for identifying diagnostic components of a system
  • Method and apparatus for identifying diagnostic components of a system

Examples


example 1

Two Group Classification for Prostate Cancer Using a Logistic Regression Model

[0319] In order to identify subsets of genes capable of classifying tissue into prostate of non-prostate groups, the microarray data set reported and analysed by Luo et al. (2001) was subjected to analysis using the method of the invention in which a binomial logistic regression was used as the model. This data set involves microarray data on 6500 human genes. The study contains 16 subjects known to have prostate cancer and 9 subjects with benign prostatic hyperplasia. However, for brevity of presentation only, 50 genes were selected for analysis. The gene expression ratios for all 50 genes (rows) and 25 patients (columns) are shown in Table 4.

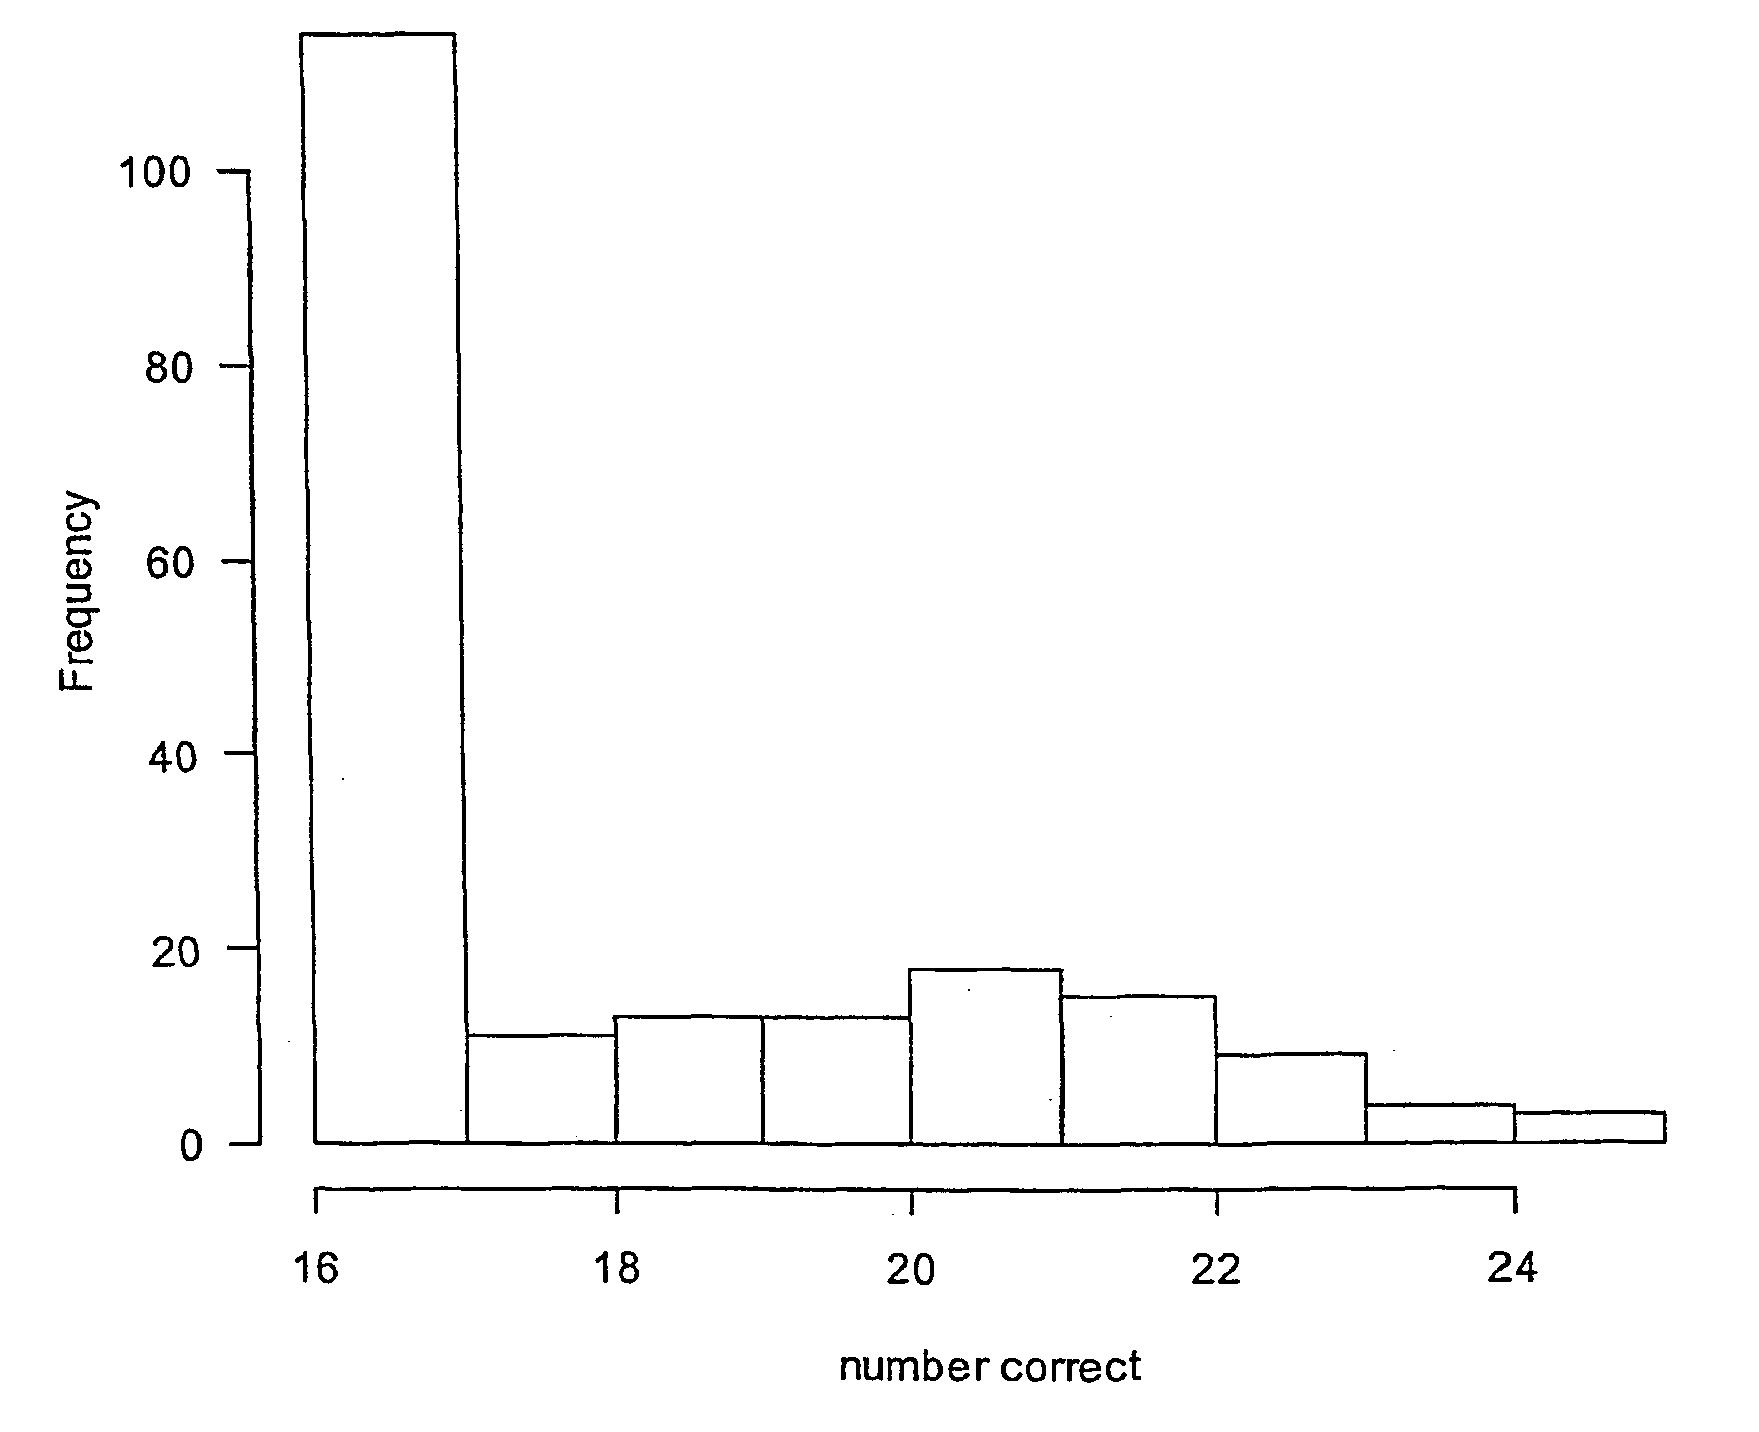
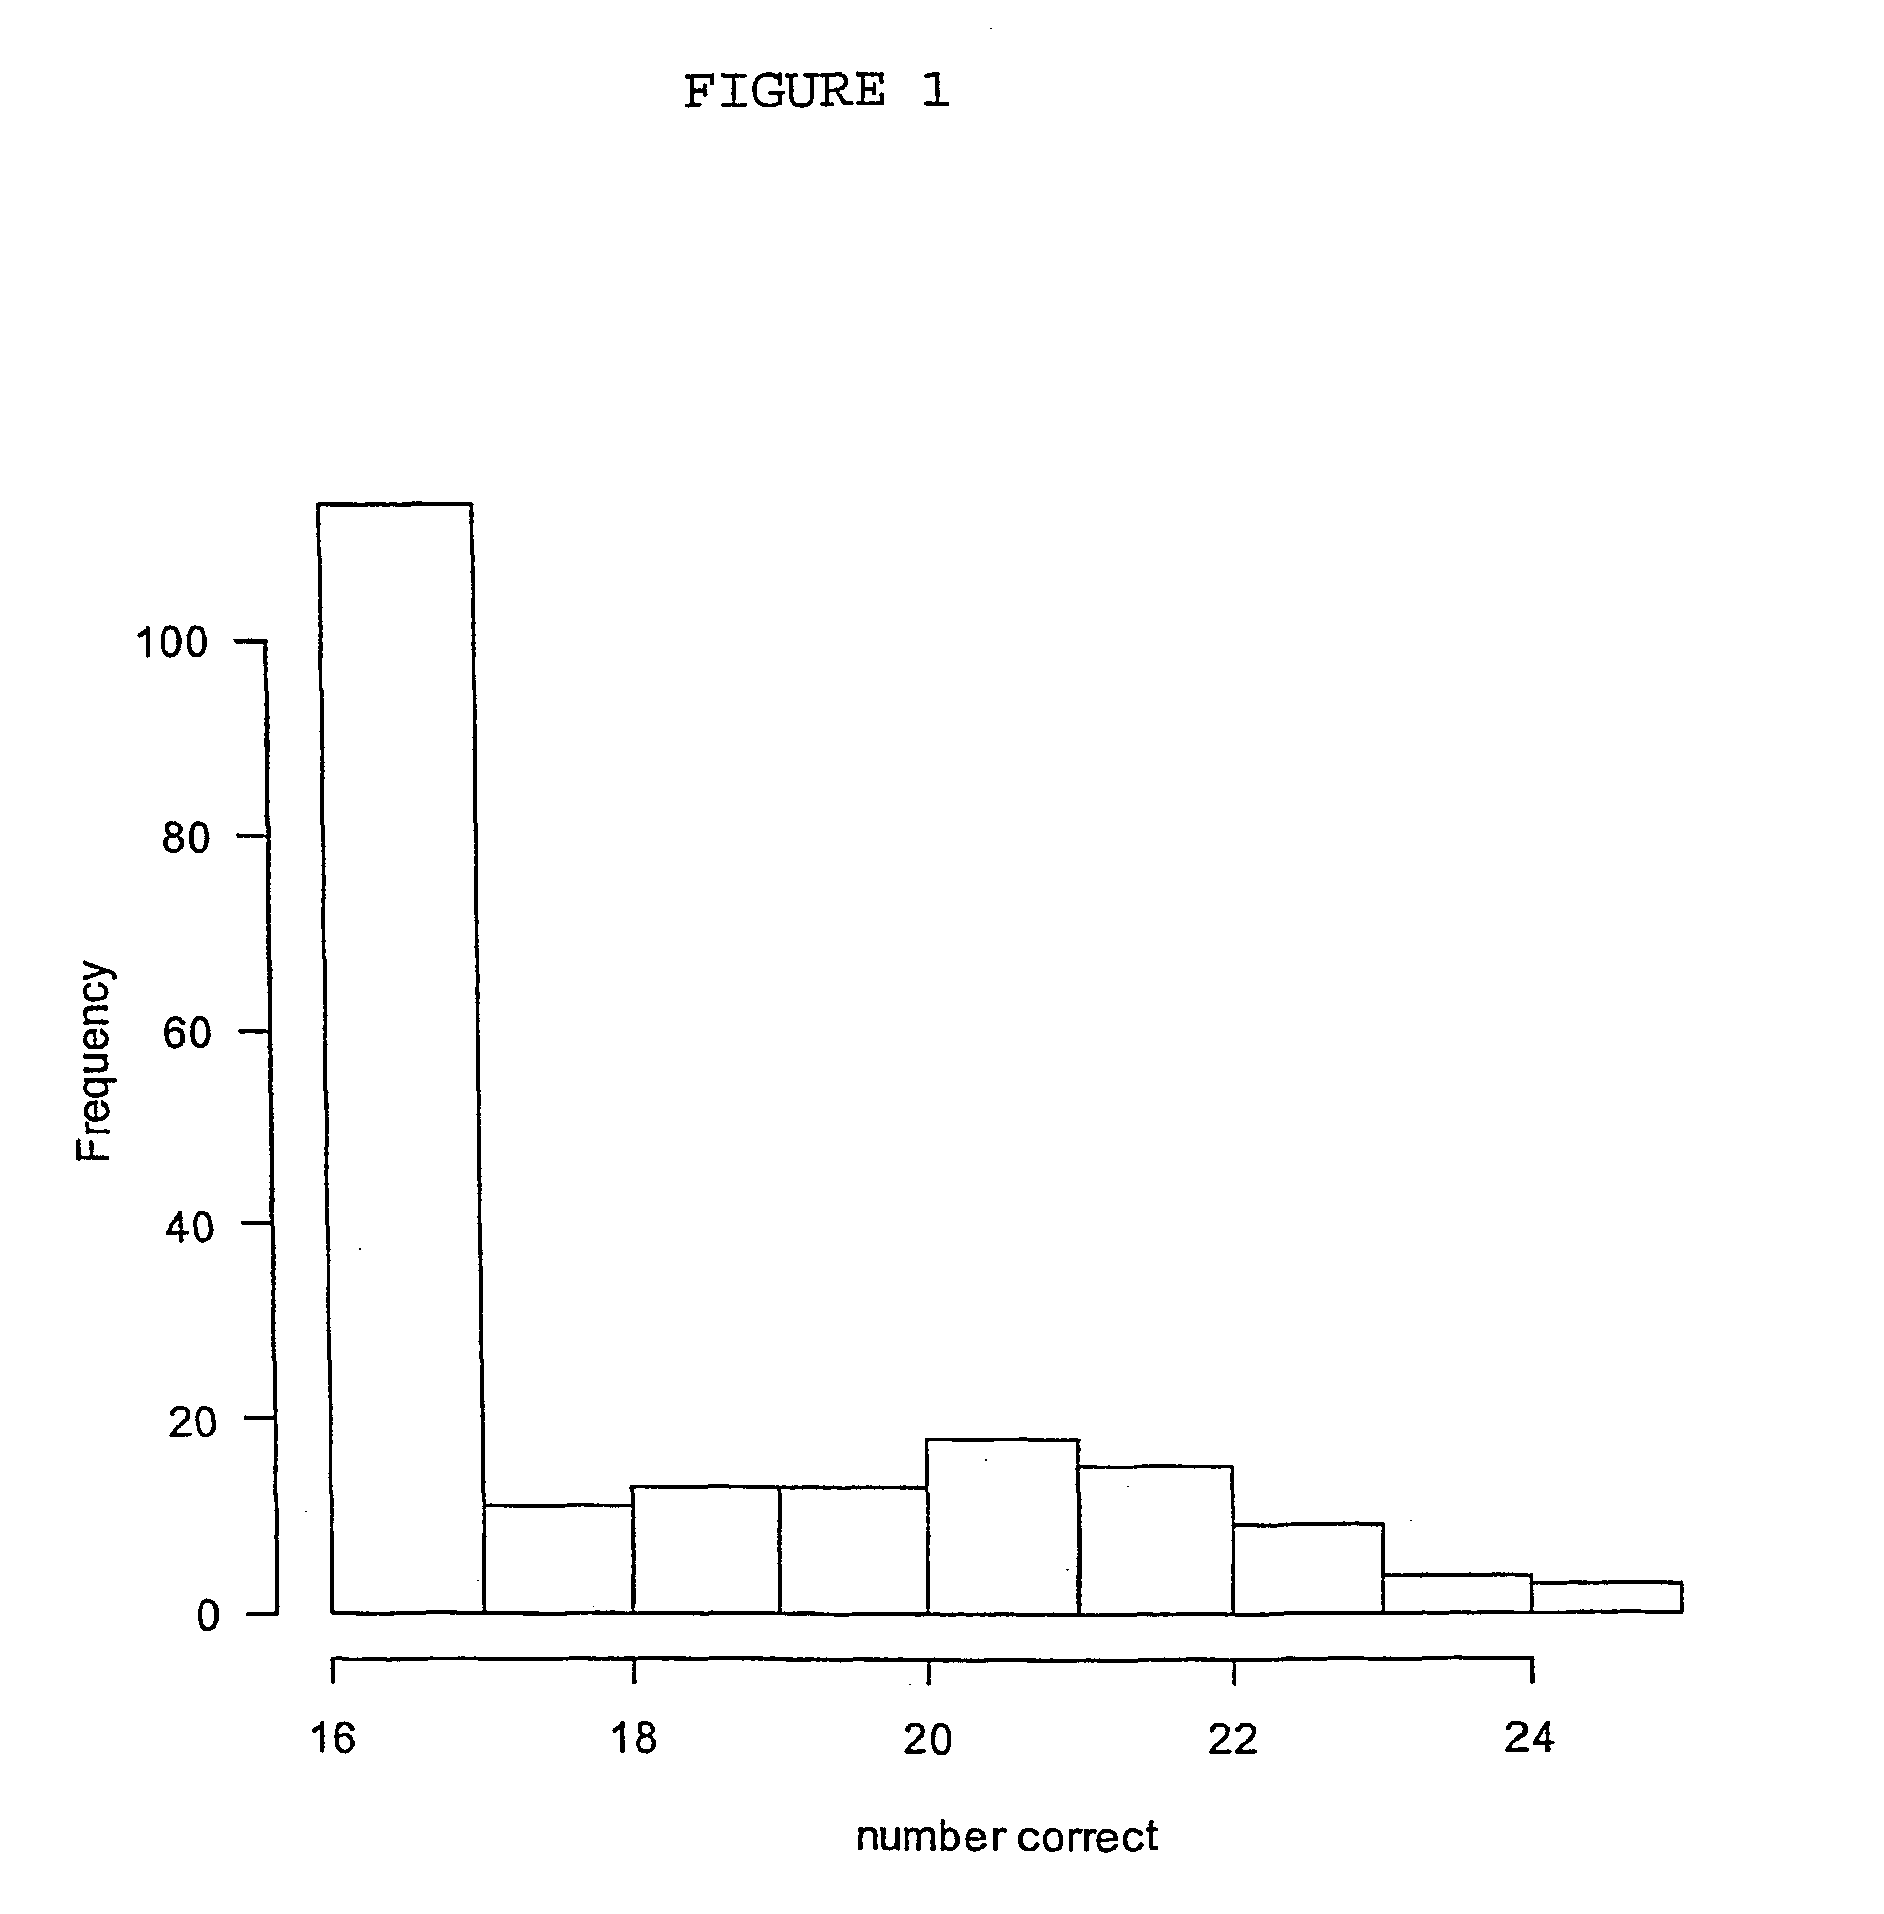
[0320] The results of applying the method are given below. The model had G=2 classes and commenced with all 50 genes as potential variables (components or basis functions) in the model. After 21 iterations (see below) the algorithm found 2 genes, (numbers 36 and 47...

example 2

Two Group Classification Using a Large Data Set and a Binomial Logistic Regression Model

[0366] In order to identify subsets of genes capable of classifying tissue into different clinical types of lymphoma, the data set reported and analysed in Alizadeh, A. A., et al. (2000) Distinct types of diffuse large B-cell lymphoma identified by gene expression profiling. Nature 403:503-511 was subjected to analysis using the method of the invention in which a binomial logistic regression was used as the model.

[0367] In the data set, there are n=4026 genes and n=42 samples. In the following DLBCL refers to “Diffuse large B cell Lymphoma”. The samples have been classified into two disease types GC B-like DLBCL (21 samples) and Activated B-like DLBCL (21 samples). We use this set to illustrate the use of the above methodology for rapidly discovering genes which are diagnostic of different disease types.

[0368] The results of applying the methodology are given below. The model had G=2 classes a...

example 3

Multi Group Classification

[0370] In order to identify genes capable of classifying samples into one of a multitude of classes, the data set reported and analyzed in Yeoh et al. Cancer Cell v1: 133-143 (2002) was subjected to analysis using the method of the invention in which a likelihood was used based on a multinomial logistic regression. The same pre-processing as described in Yeoh et al has been applied. This consisted of the following: [0371] drop the following 8 arrays: BCR.ABL.R4, MLL.R5, Normal.R4, T.ALL.R7, T.ALL.R8,Hyperdip.50.2M.3, Hypodip.2M.3 , and Hypodip.2M.2 [0372] set the mean response value of each array to 2500 [0373] thresholding—values over 45000 are set to 45000 values less than 100 are set to 1 [0374] genes with less than 0.01 present are eliminated—this amounted to 1607 genes [0375] genes for which the difference between the maximum and the minimum value was less than 100 are eliminated (1604 genes)

[0376] After preprocessing there are n=11005 genes and n=24...


PUM


Abstract

Method and apparatus is described for identifying a subset of components of a system, the subset being capable of predicting a feature of a test sample. The method comprises generating a linear combination of components and component weights in which values for each component are determined from data generated from a plurality of training samples, each training sample having a known feature. A model is defined for the probability distribution of a feature wherein the model is conditional on the linear combination and wherein the model is not a combination of a binomial distribution for a two class response with a probit function linking the linear combination and the expectation of the response. A prior distribution is constructed for the component weights of the linear combination comprising a hyperprior having a high probability density close to zero, and the prior distribution and the model are combined to generate a posterior distribution. A subset of components is identified having component weights that maximise the posterior distribution.

Description

FIELD OF THE INVENTION [0001] The present invention relates to a method and apparatus for identifying components of a system from data generated from samples from the system, which components are capable of predicting a feature of the sample within the system and, particularly, but not exclusively, the present invention relates to a method and apparatus for identifying components of a biological system from data generated by a biological method, which components are capable of predicting a feature of interest associated with a sample from the biological system. BACKGROUND OF THE INVENTION [0002] There are any number of “systems” in existence which can be classified into different features of interest. The term “system” essentially includes all types of systems for which data can be provided, including chemical systems, financial systems (e.g. credit systems for individuals, groups or organisations, loan histories), geological systems, and many more. It is desirable to be able to uti...

Claims


Application Information

Patent Timeline
IPC IPC(8): G06F17/18G16B40/20
CPCG06F19/24G06F17/18G16B40/00G16B40/20
Inventor KIIVERI, HARRITRAJSTMAN, ALBERTTHOMAS, MERVYN
Owner COMMONWEALTH SCI & IND RES ORG
Why Eureka
Try Eureka