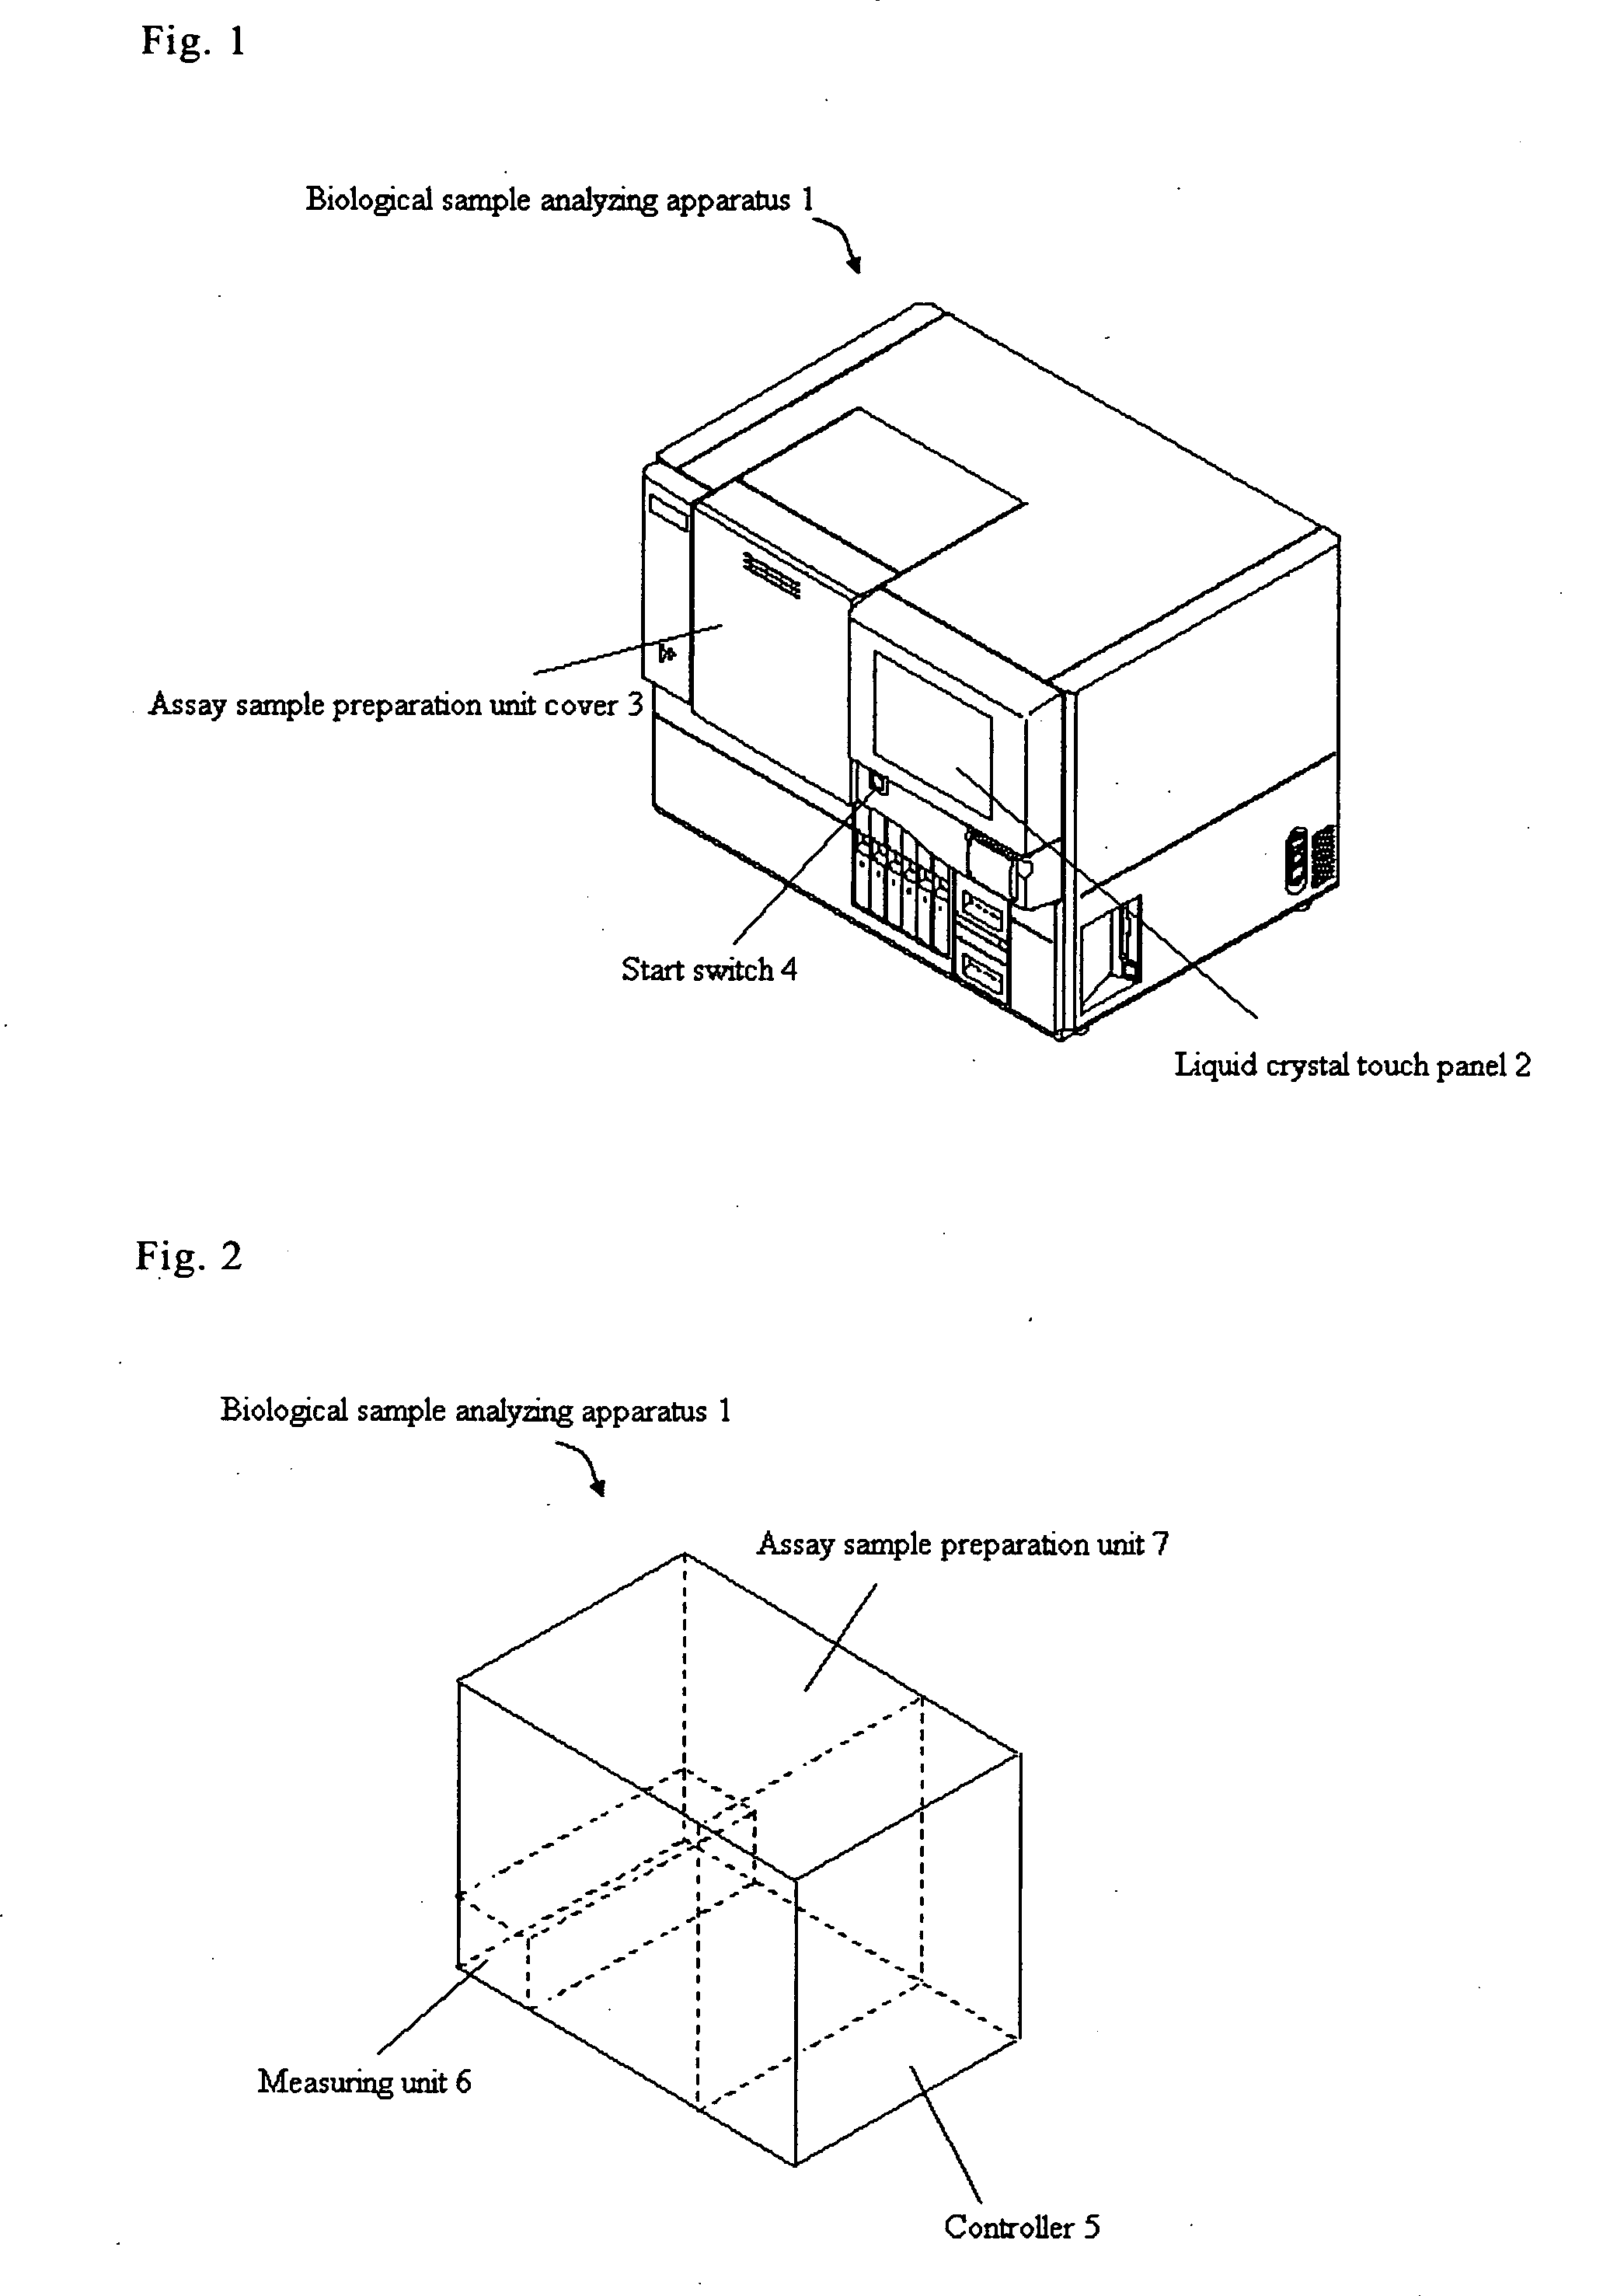
Biological sample analyzing apparatus and biological sample analyzing method
a biological sample and apparatus technology, applied in the field of apparatus and methods for analyzing assay materials, can solve the problem of limited concentration range in which assay materials can be measured, and achieve the effect of improving the efficiency of biological sample analysis
- Summary
- Abstract
- Description
- Claims
- Application Information
AI Technical Summary
Benefits of technology
Problems solved by technology
Method used
Image
Examples
example 2
(Measurement Example 2)
[0117] Next, the calibration curve T2 was prepared at various reaction times T2 using the previously described biological sample analyzing apparatus 1.
[0118] Each type of reagent and the T2 standard solutions used in the present example were identical to the reagents and T2 standard solutions used in measurement example 1.
[0119]FIG. 18 shows the calibration curve T2 at each reaction time. These calibration curves T2 are calculated at reaction time T2 of 95 sec, 3.0 min, 5.0 min, 10.0 min, and 15.0 min; curve e is 95 sec, f is 3.0 min, g is 5.0 min, h is 10.0 min, and i is 15.0 min.
[0120] In FIG. 18, the change in the agglutination rate per unit concentration increases in conjunction with the lengthening of reaction time T2. In this way the agglutination rate sensitivity becomes greater as the time set as the reaction time T2 increases. That is, effective measurement is possible by setting the reaction time T2 in accordance with the measurement range require...
example 3
(Measurement Example 3)
[0122] The measurement results shown were taken when the reaction time T1 was set at 20 sec, and reaction time T2 was set at 95 sec, using the previously described biological sample analyzing apparatus 1. In the present example, the agglutination rate threshold value α(T1) was set at 7%. In this way the concentration of CRP contained in a specimen could be calculated based on the agglutination rate A and calculation curve T1 at reaction time T1 when the agglutination rate A was 7% or greater. Moreover, the concentration of CRP contained in a specimen could be calculated based on the agglutination rate B at reaction time T2 when the agglutination rate A was less than 7%.
[0123] Each type of reagent and standard solutions used in the present example were identical to the reagents and standard solutions used in measurement example 1. In the present example, blood plasma 1˜5 and blood sera 1˜3 containing various concentrations of CRP are used as specimens. The sam...
example 4
(Measurement Example 4)
[0126] The measurement results in this case sows the results when whole blood was assayed using the previously described biological sample analyzing apparatus 1. The whole blood further contained hemocytes. Therefore, when whole blood is used as the specimen and the same quantity is used as when assaying serum and plasma, the assay values are lower because they reflect the hemocyte component (hemocyte volume). Therefore, the hemocyte volume must be compensated when assaying whole blood. In the present example, this compensation is made using the method disclosed in U.S. Application Patent Publication No. 2003-0082662. Specifically, whole blood specimens were assayed using a completely automated hemocyte analyzer model XE-2100 manufactured by Sysmex Corporation to determine the number of hemocytes beforehand. Compensation was accomplished using the following equation.
C=C0 / {1−(B / A)}
[0127] (Where C represents the concentration of assay material after compensatio...
PUM
 Abstract
Description
Claims
Application Information
 - R&D
- Intellectual Property
- Life Sciences
- Materials
- Tech Scout
- Unparalleled Data Quality
- Higher Quality Content
- 60% Fewer Hallucinations
Browse by: Latest US Patents, China's latest patents, Technical Efficacy Thesaurus, Application Domain, Technology Topic, Popular Technical Reports.
© 2025 PatSnap. All rights reserved.Legal|Privacy policy|Modern Slavery Act Transparency Statement|Sitemap|About US| Contact US: help@patsnap.com


