Method of monitoring treating agent residuals and controlling treating agent dosage in water treatment processes

Inactive Publication Date: 2006-07-20
ECOLAB USA INC
View PDF9 Cites 22 Cited by
  • Summary
  • Abstract
  • Description
  • Claims
  • Application Information

AI Technical Summary

Benefits of technology

[0005] This invention is a method of monitoring residual treating agent and determining optimal treating agent dosage in process water treated with the treating agent comprising sequentially
[0006] v-b) correlating the change in the measured fluorescence intensity of the process water a

Problems solved by technology

Conversely, overdosing the treating agent would be at best uneconomical and at worst could result in damage to the proce

Method used


Image

  • Method of monitoring treating agent residuals and controlling treating agent dosage in water treatment processes
  • Method of monitoring treating agent residuals and controlling treating agent dosage in water treatment processes
  • Method of monitoring treating agent residuals and controlling treating agent dosage in water treatment processes

Examples


example 1

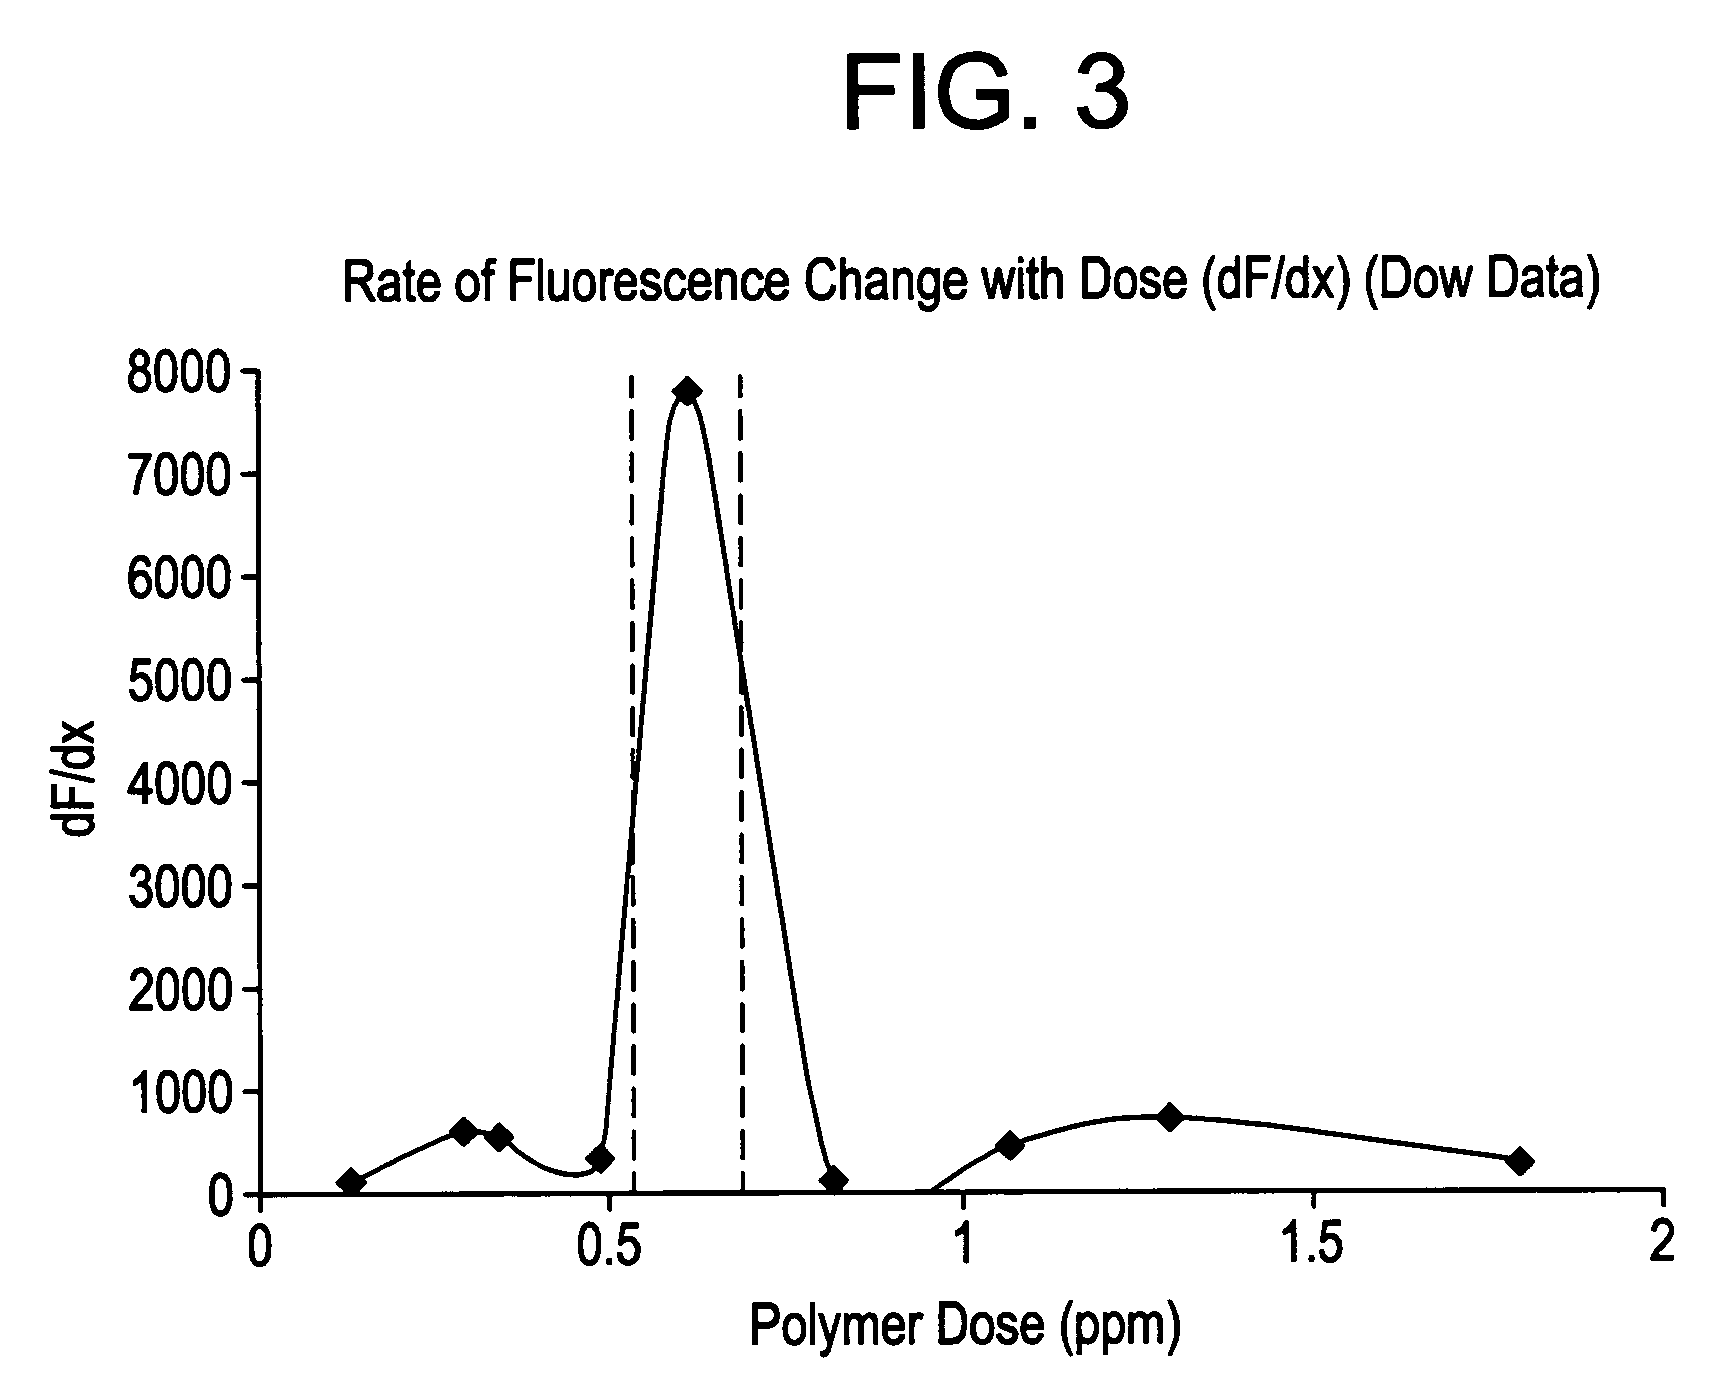
[0087] As discussed above, the optimal treating agent dosage is calculated using the inverse derivative of fluorescence response with respect to treating agent dose and correlating to a water quality parameter, in this case turbidity, using standard jar test methods to measure fluorescence and turbidity.

[0088] For purposes of this example, jar tests are accomplished using a four-unit jar tester from A&F Machine Products Co., Berea, Ohio (model number “JAR MIXER”) according to the following protocol. [0089] 1) Place a 250-1,000 mL test sample in a sample jar and initiate stirring at 200 rpm. [0090] 2) Add treating agent via syringe into the vortex of the stirred sample and continue stirring for 30 seconds. [0091] 3) Slow the stirring to 15 to 60 rpm and continue stirring for 5 minutes. [0092] 4) Stop stirring, remove the paddles from the sample and allow the sample to settle for 5 minutes. [0093] 5) Remove a sample of the supernatant via pipette or syringe from a level about 1 cm be...

example 2

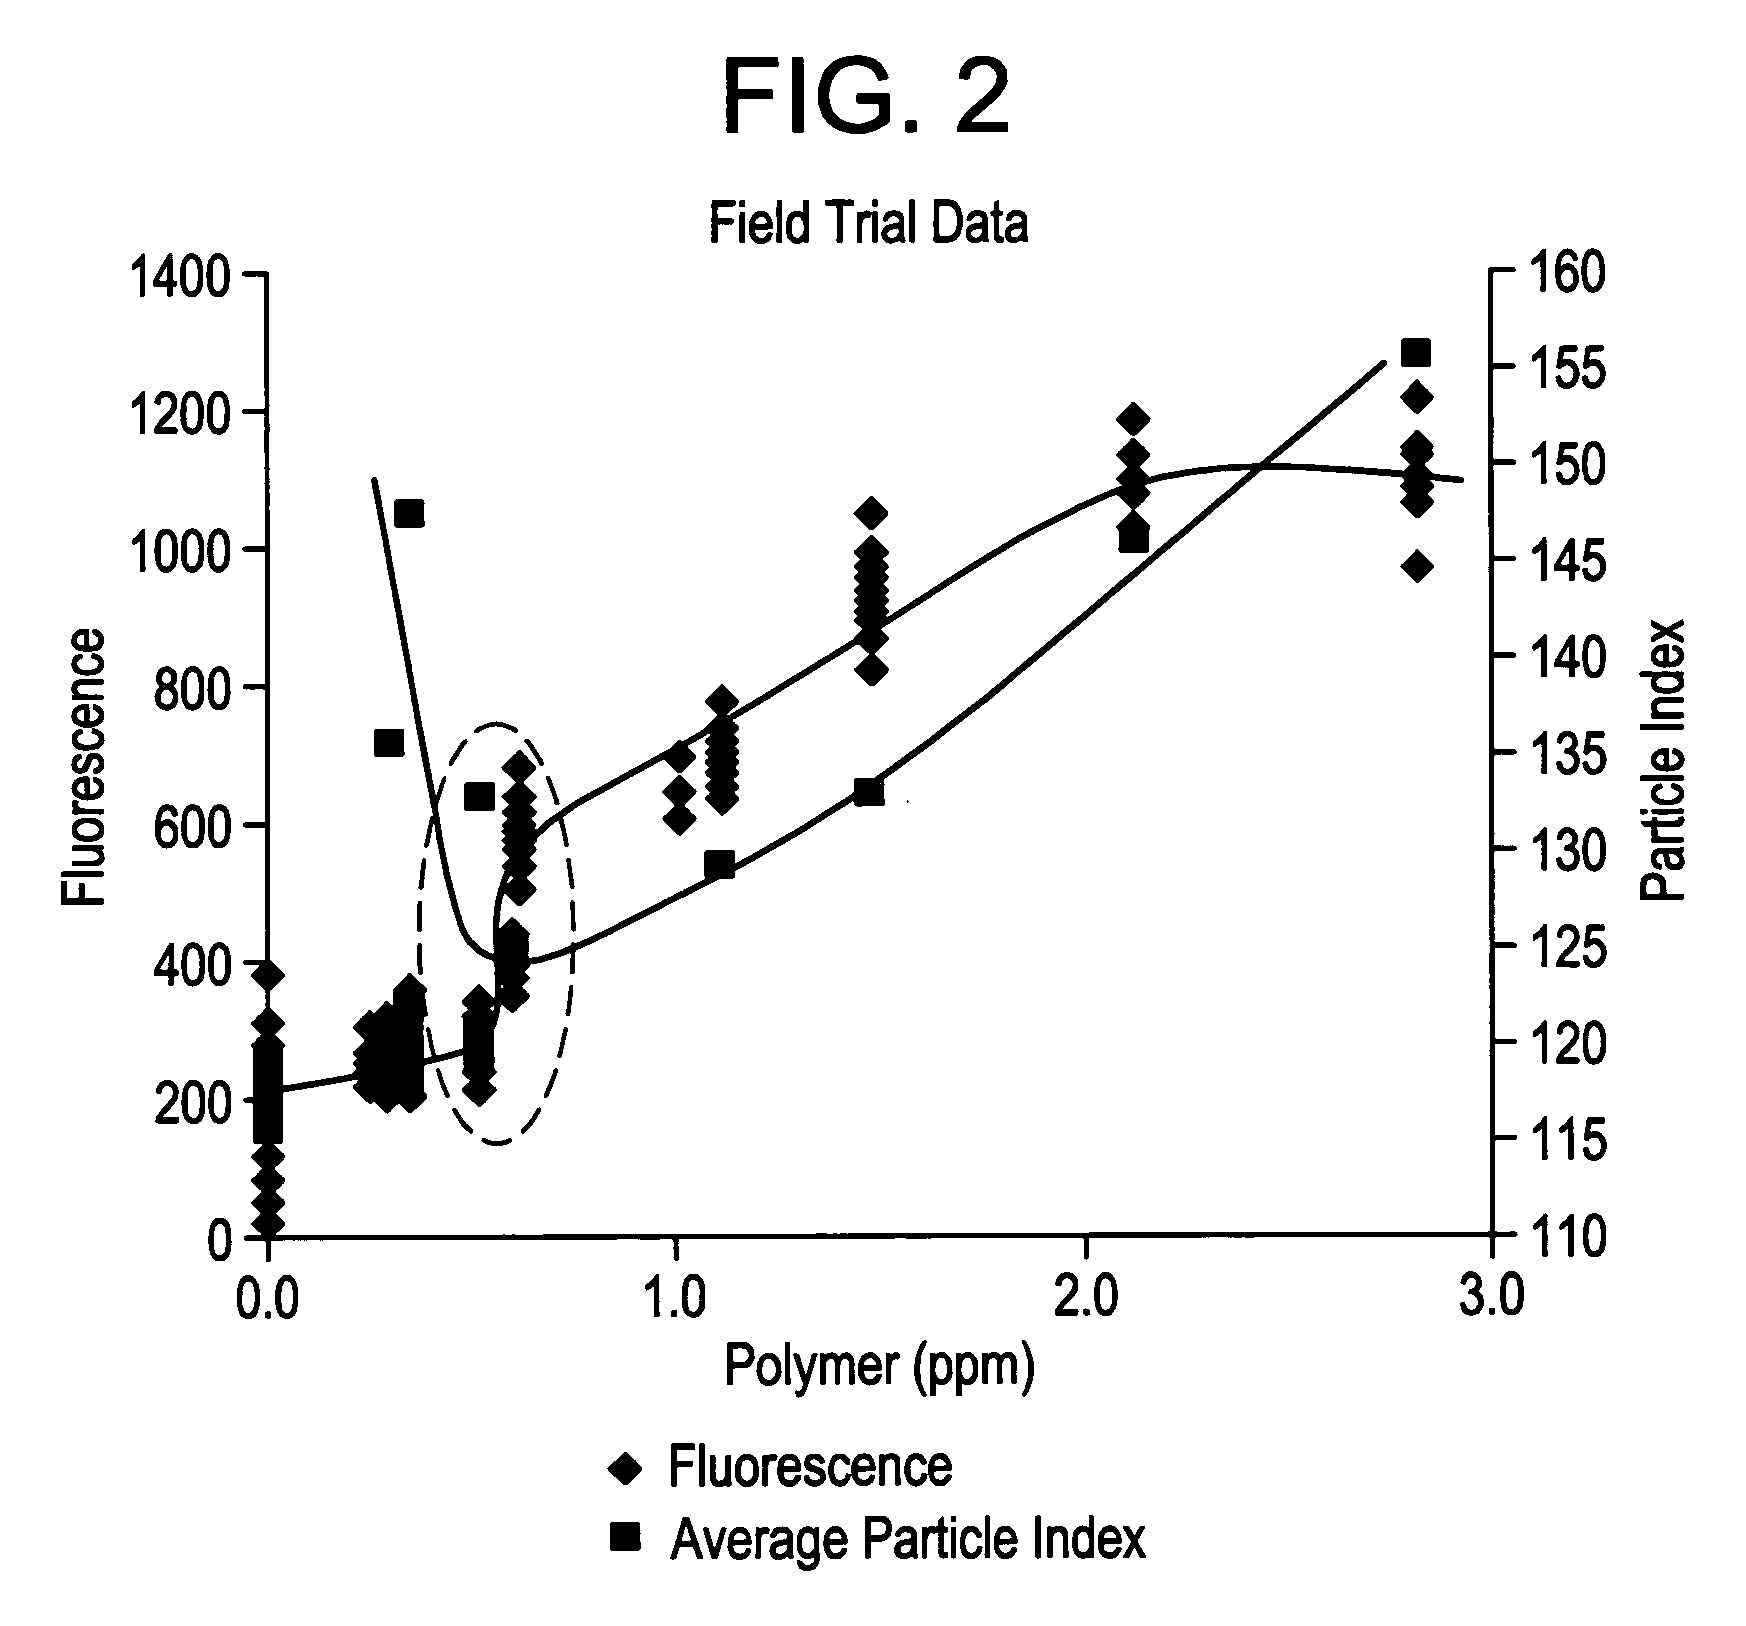
[0099] Testing is also accomplished in the field according to the method of Example 1 using the Hach 2100P turbidimeter on Mississippi River water that has been previously treated for turbidity removal resulting in a turbidity of about 1 NTU. Fluorescence data is obtained using a TRASAR 8000 Fluorometer from Nalco Company, Naperville, Ill. The TRASAR 8000 requires a correction at zero added fluorescein with the correction being a subtraction of 0.06 ppb fluorescein. This correction is attributed to less precise optics versus the research grade Hitachi. PolyDADMAC is the treating agent. The fast mix is 30 seconds, slow mix three minutes and settling time five minutes. The Fluorescence Intensity, ppb is without the 0.06 ppb fluorescein background correction, while the Corrected Quenching is the inverse of the corrected Fluorescence Intensity, so it has units of ppb−1. The results are shown in Table 2

TABLE 25 umFilteredFluorescenceCorrectedppm1 / ppmNTUIntensity, ppbQuenching0.42.50000....

example 3

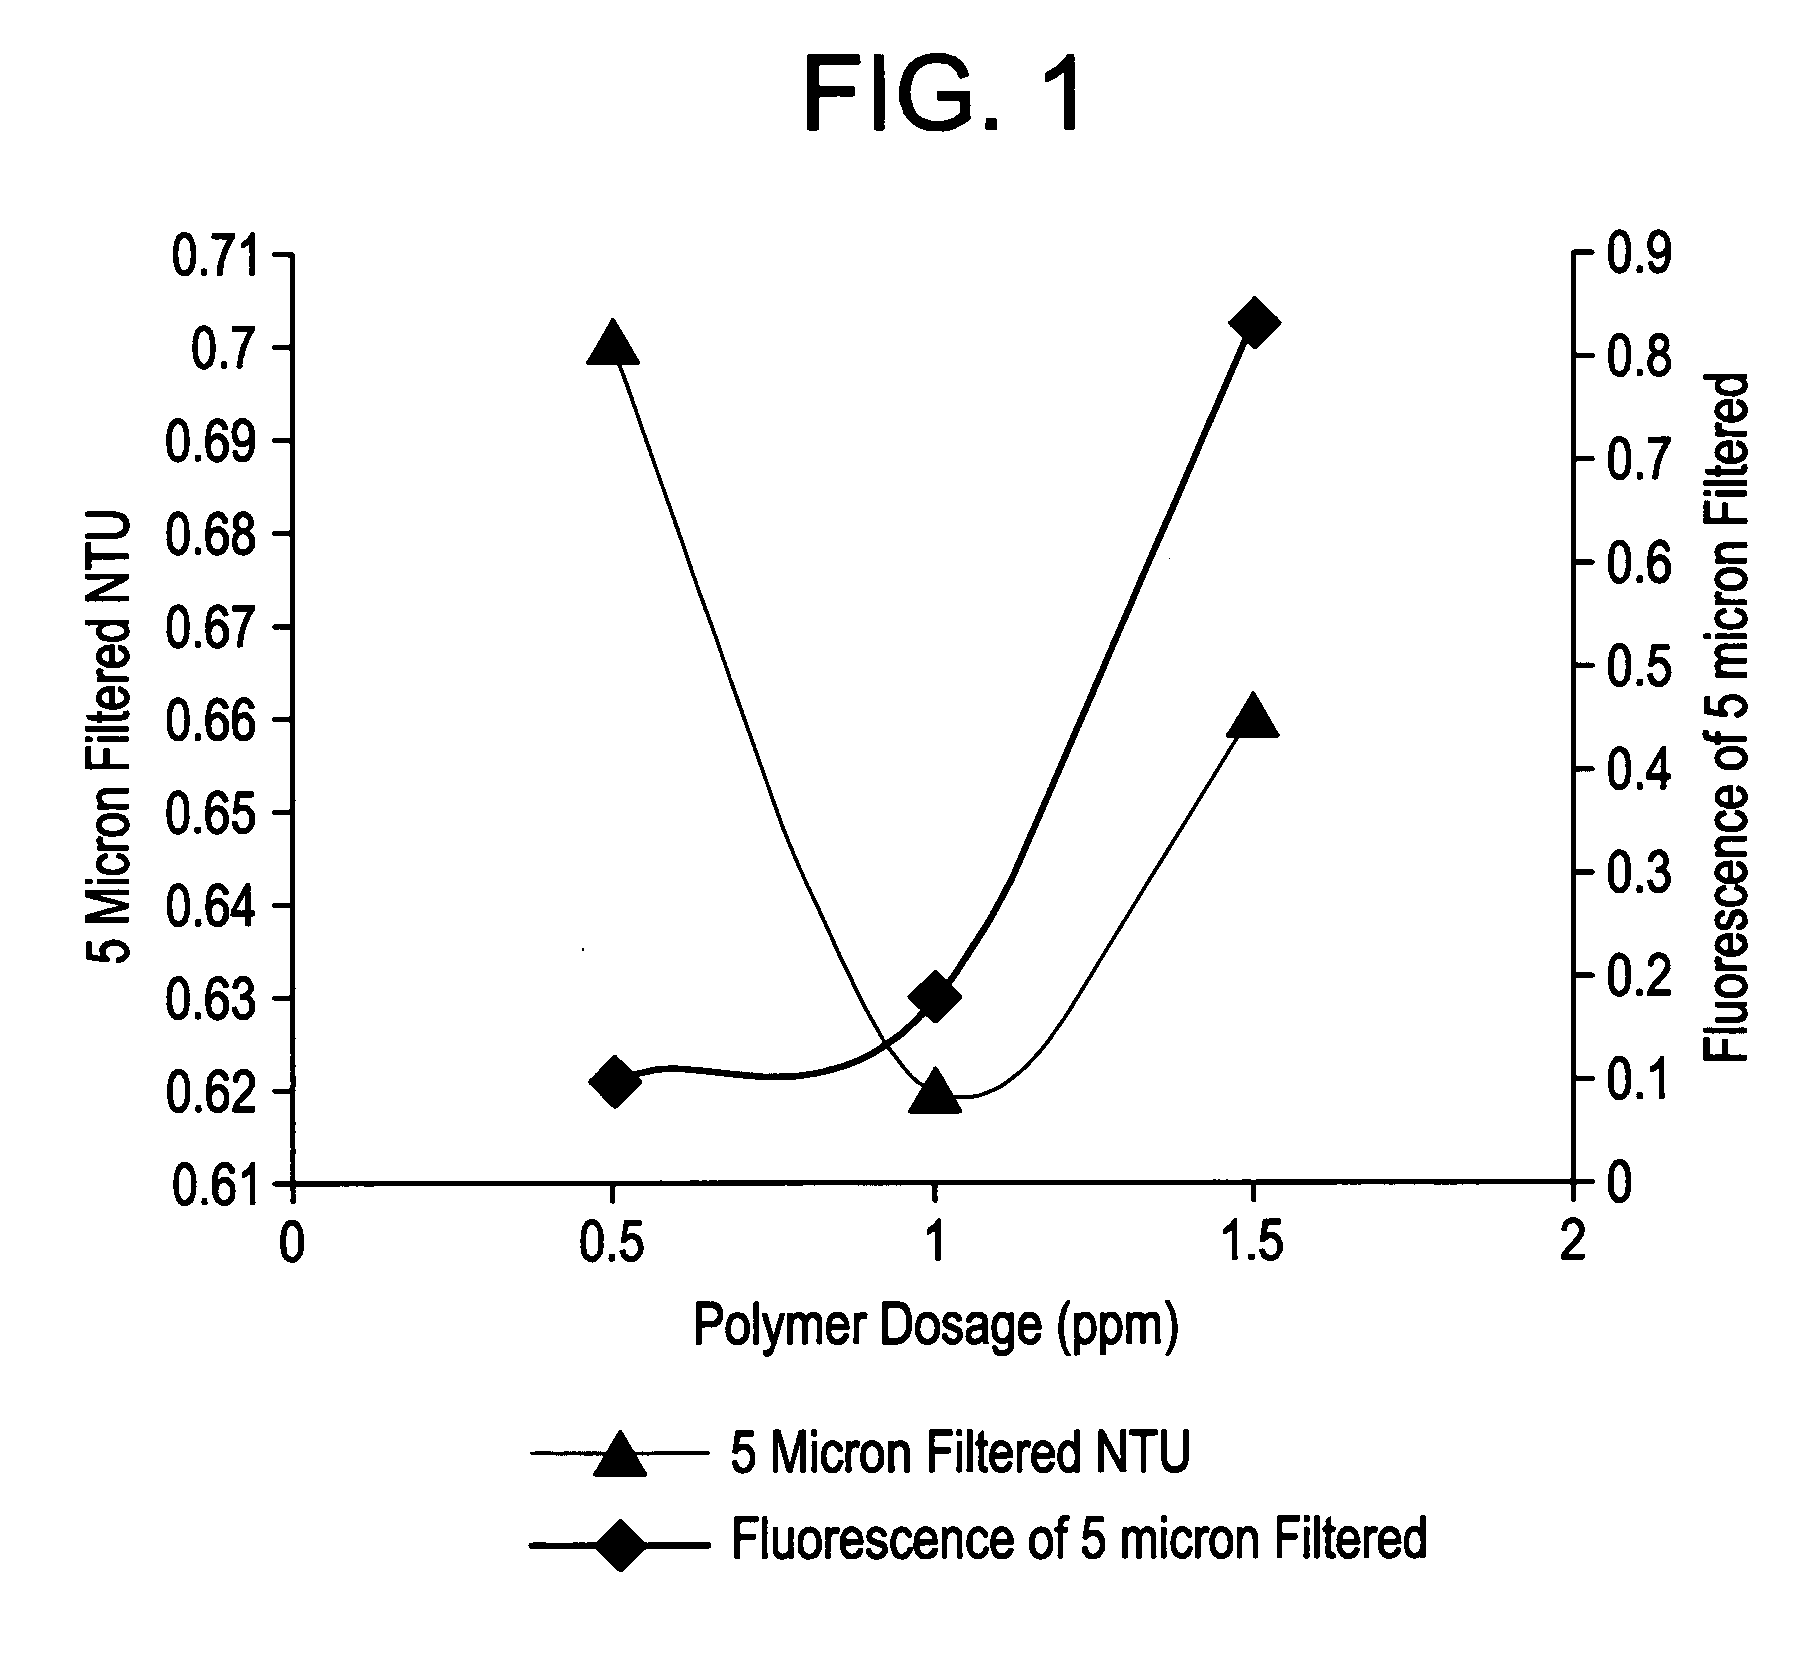
[0101] Natural surface water from a lake in Montana, USA, is treated with a dual filter aid program using ferric sulfate solution and polyDADMAC, as summarized in Table 3. The fast mix is two minutes, slow mix ten minutes and no settling time and the 0.057 ppb fluorescein correction is subtracted from the measured fluorescence intensity. The results are summarized in Table 3.

TABLE 35 umFilteredFluorescenceCorrectedppm1 / ppmNTUIntensity, ppbQuenching0.502.00001.050.4082.84901.001.00000.740.6151.79211.500.66670.640.7921.36052.000.50000.521.2600.8313

[0102] Note that in Table 3, 0.057 ppb is subtracted to correct the fluorescence.

[0103] As shown in Table 4, non-weighted regression analysis of Stern-Volmer plots for the above data have ‘goodness-of-fit’ (r2) of approximately 90% for the field data and 99% for the laboratory data. Data using the Hitachi research grade Fluorometer presumably has a higher fit due to more accurate fluorescence measurements with significantly lower backgrou...


PUM


Abstract

Methods of monitoring residual treating agent in treated water wherein the fluorescence intensity of the water at at least two different dosages of treating agent tagged or traced with fluorescent tracers are correlated with the residual concentration of treating agent. The fluorescence response at the different treating agent dosages is also used to automatically determine an optimal treating agent dose on a continuous basis and to control treating agent dose accordingly.

Description

CROSS REFERENCE TO RELATED APPLICATIONS [0001] This is a continuation-in-part of Ser. No. 11 / 038,718 filed Jan. 20, 2005.TECHNICAL FIELD [0002] This invention relates to water treatment. More particularly, this invention concerns methods of using fluorescent tracers to monitor the residual concentration of treating agents in treated water, to determine an optimal water treatment agent dosage and to automatically re set the optimal treating agent dosage as necessary to account for fluctuations in the characteristics of the treated water. BACKGROUND OF THE INVENTION [0003] Water, in the course of its use in industrial, municipal and agricultural applications may be treated with an astounding array of treatment agents including, for example, chemicals that enhance solid-liquid separation, membrane separation process performance enhancers, antiscalants and anticorrosives that retard or prevent corrosion or scale formation and deposition on surfaces in contact with the treated water, ant...

Claims


Application Information

Patent Timeline
IPC IPC(8): G01N33/00
CPCC02F1/44C02F1/441C02F1/5209Y10T436/13C02F2209/003G01N21/643Y10T436/12C02F1/56
Inventor SETHUMADHAVAN, GOPI NATHJOHNSON, BRIAN SCOTT
Owner ECOLAB USA INC
Why Eureka
Try Eureka