
Method and apparatus of signal processing for use in spectrometry using an improved apodization function

a signal processing and spectrometry technology, applied in the field of signal processing for use in spectrometry using an improved apodization function, can solve the problems of difficult use of theoretical methods, difficulty in analysis of the resulting auto-referenced spectra, and difficulty in analyzing the original and deresolved interferogram signals to remove artifacts, so as to reduce, if not eliminate, the background and artifact signals of low and medium frequency instruments.

Active Publication Date: 2006-10-26
MKS INSTR INC
View PDF10 Cites 11 Cited by
  • Summary
  • Abstract
  • Description
  • Claims
  • Application Information

AI Technical Summary

Benefits of technology

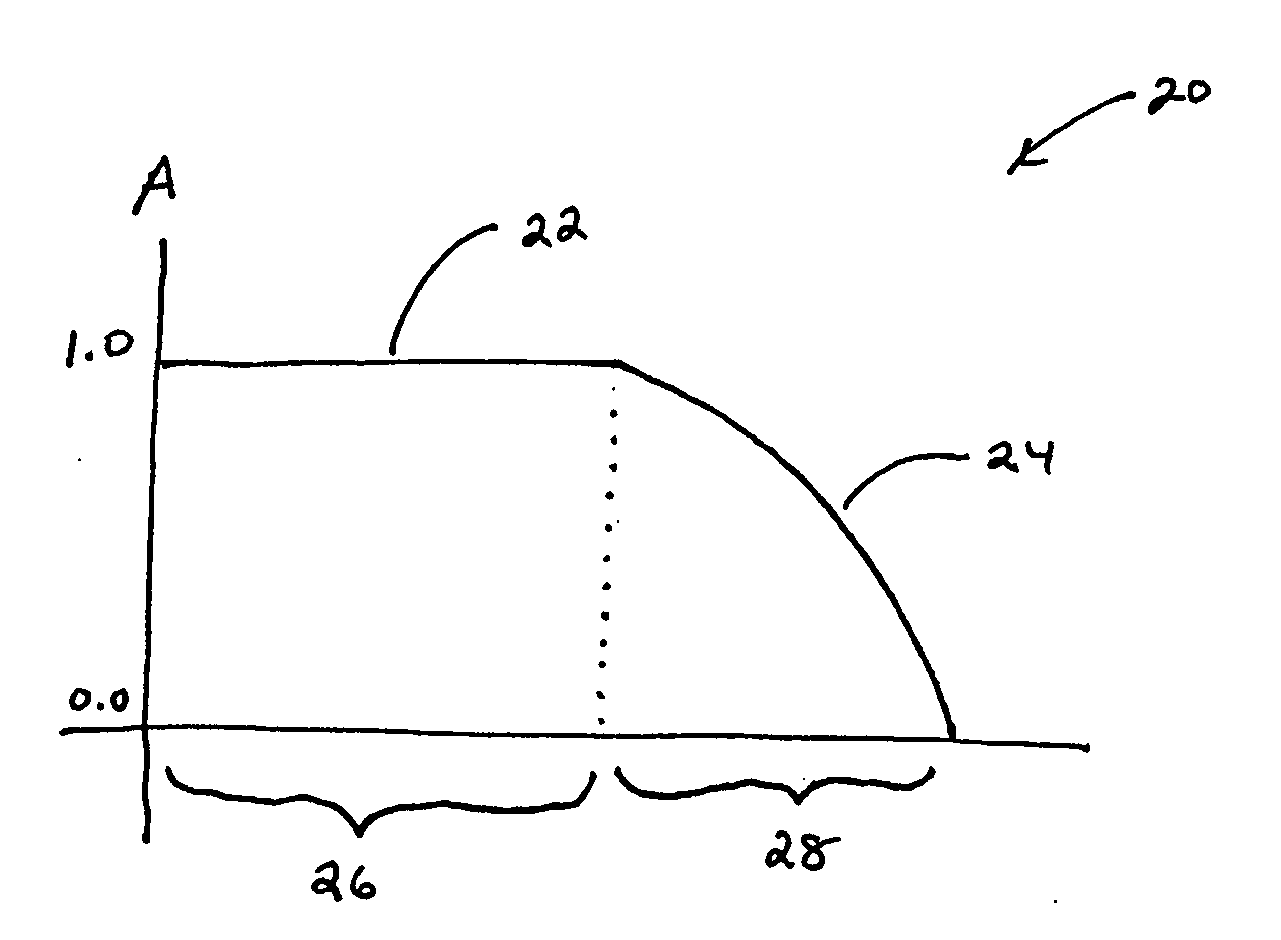
The present invention is an improved apodization function and corresponding waveform that can be used in signal processing to reduce or eliminate low and medium frequency instrument background and artifact signals in time-varying spectroscopic techniques, such as infrared spectrometry. This apodization function and waveform render the original and deresolved frequency spectra more similar for low and medium frequency signals, while retaining the high frequency signals only in the raw, original spectrum. This improves the detection limit of low concentration components, increases the precision and accuracy of constituent analysis, and facilitates more effective use of theoretical references and calibration transfer methods. The apodization function and waveform can be used in various spectroscopies that require a trade-off between signal-to-noise ratio and resolution.

Problems solved by technology

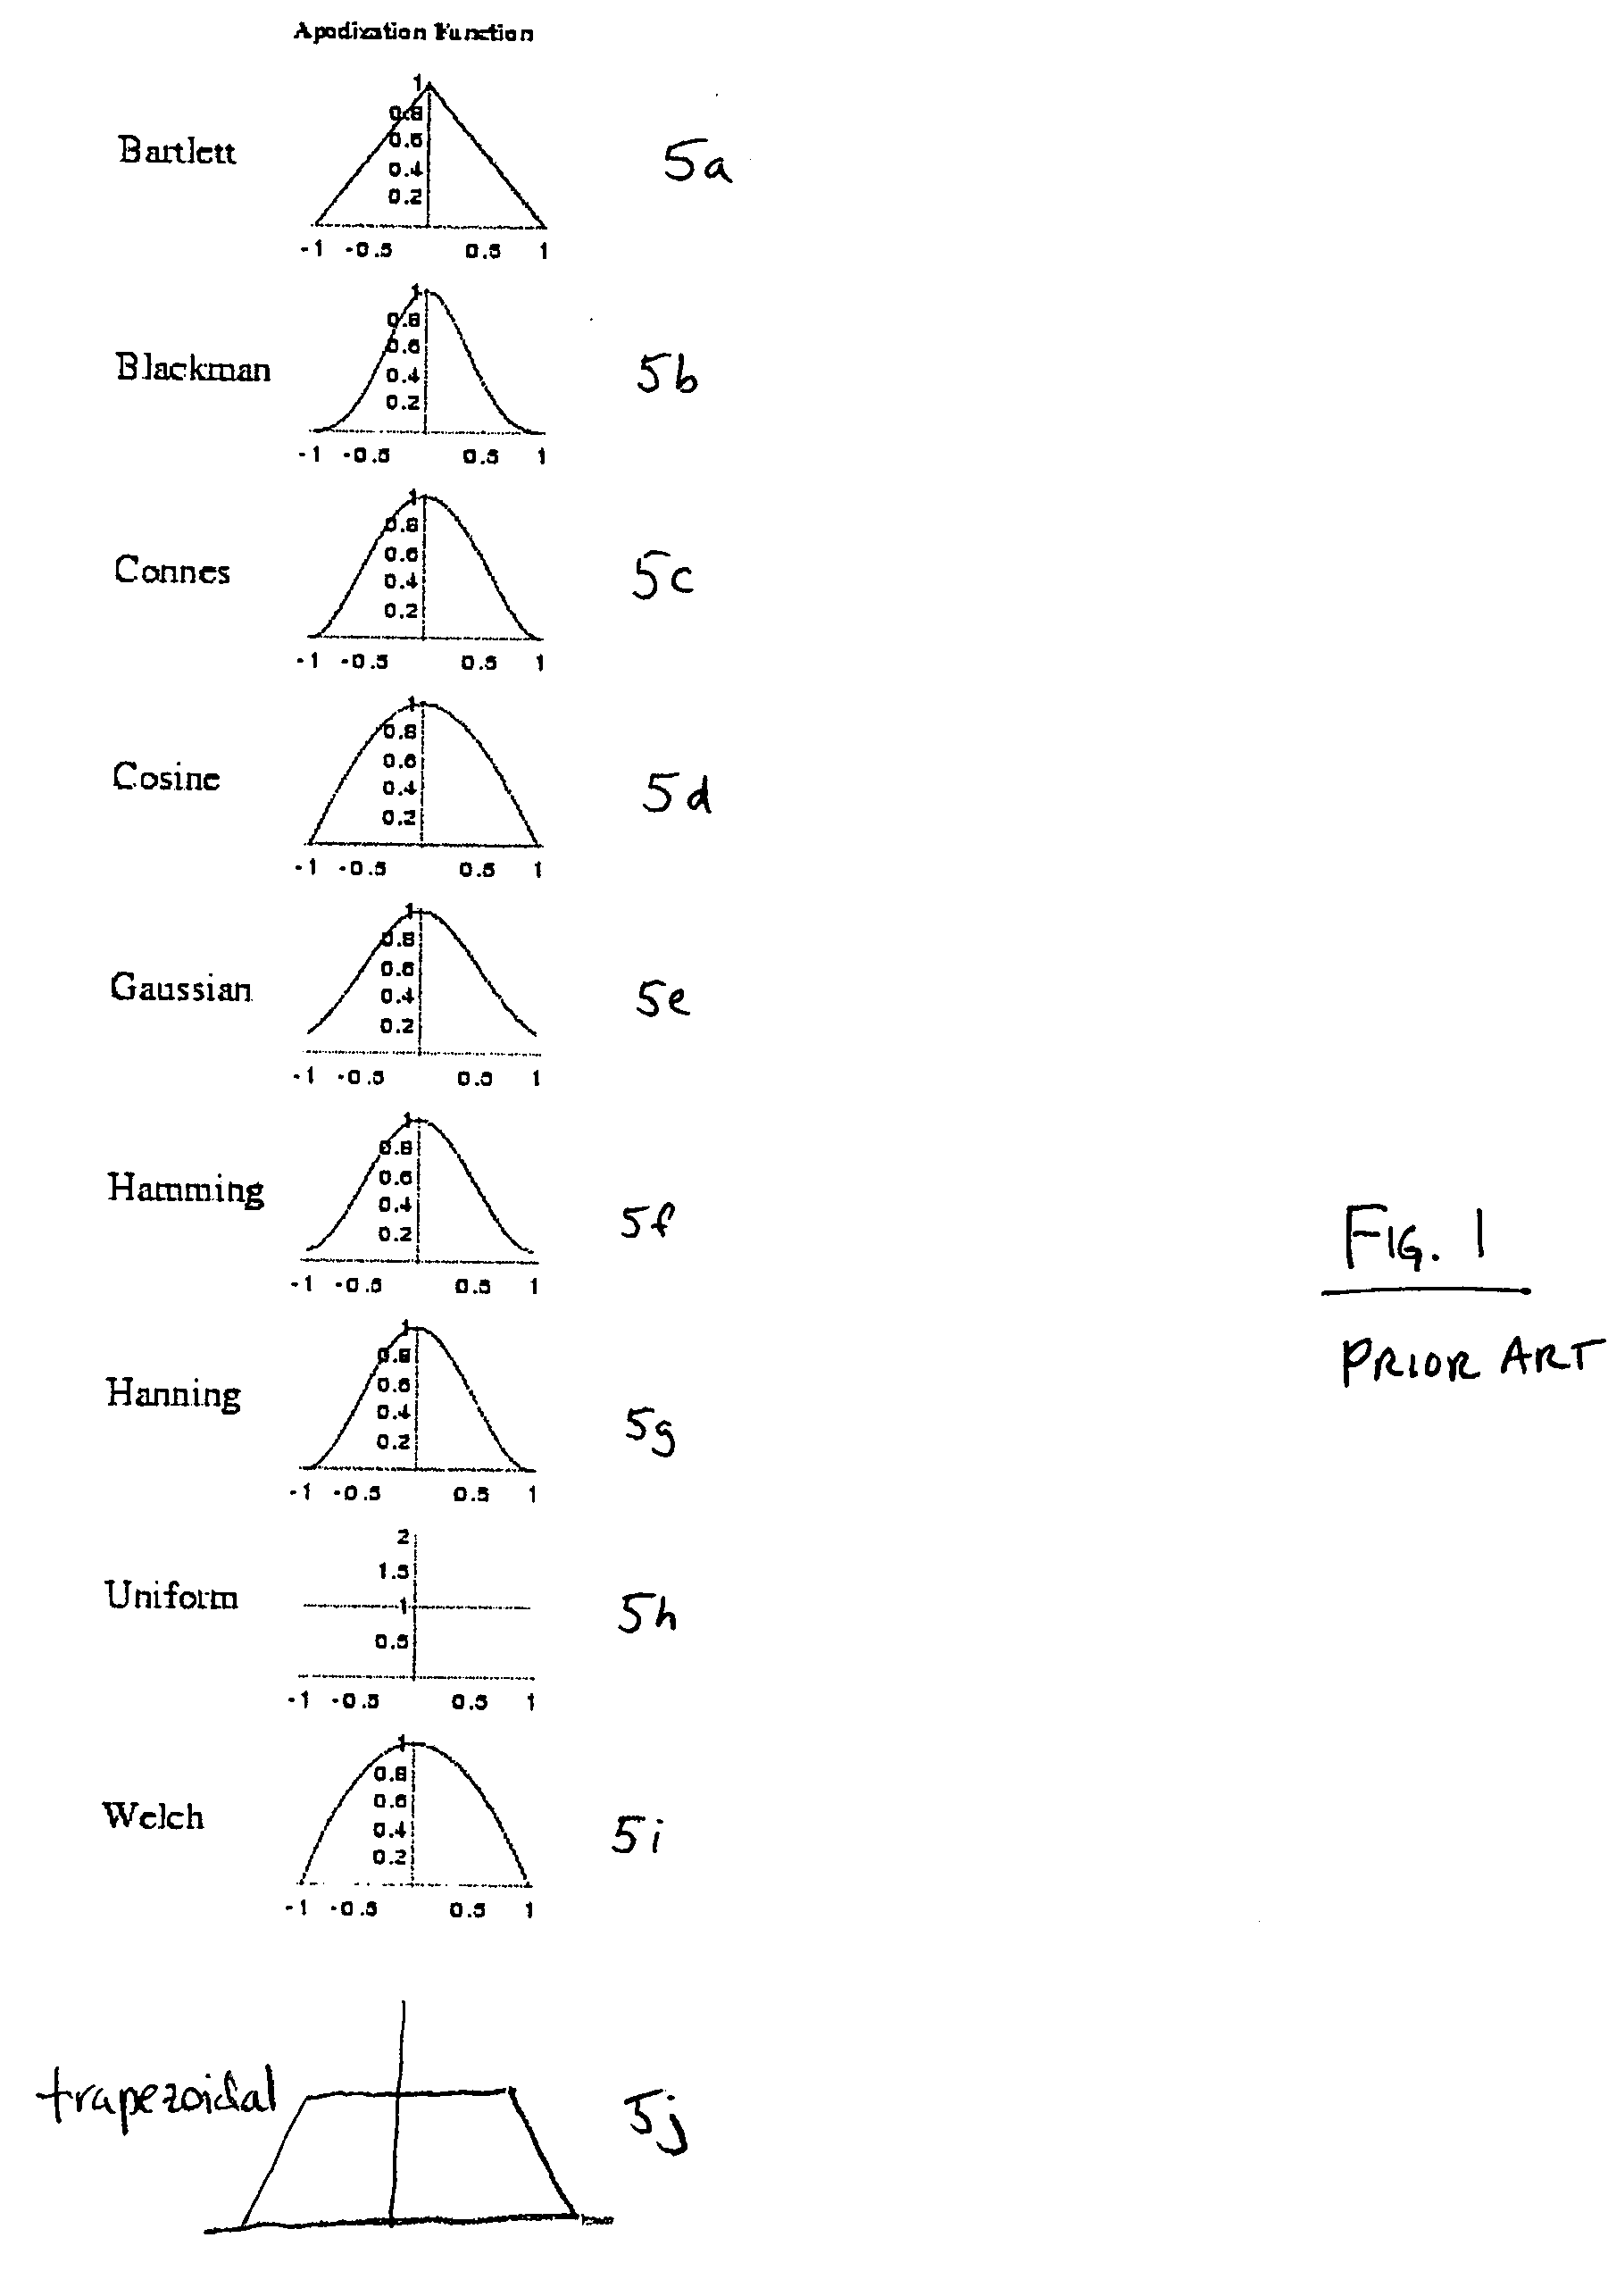
However, known apodization functions do not effectively weight the original and deresolved interferogram signals to remove artifacts due to, for example, instrument functions in the auto-referenced spectra.
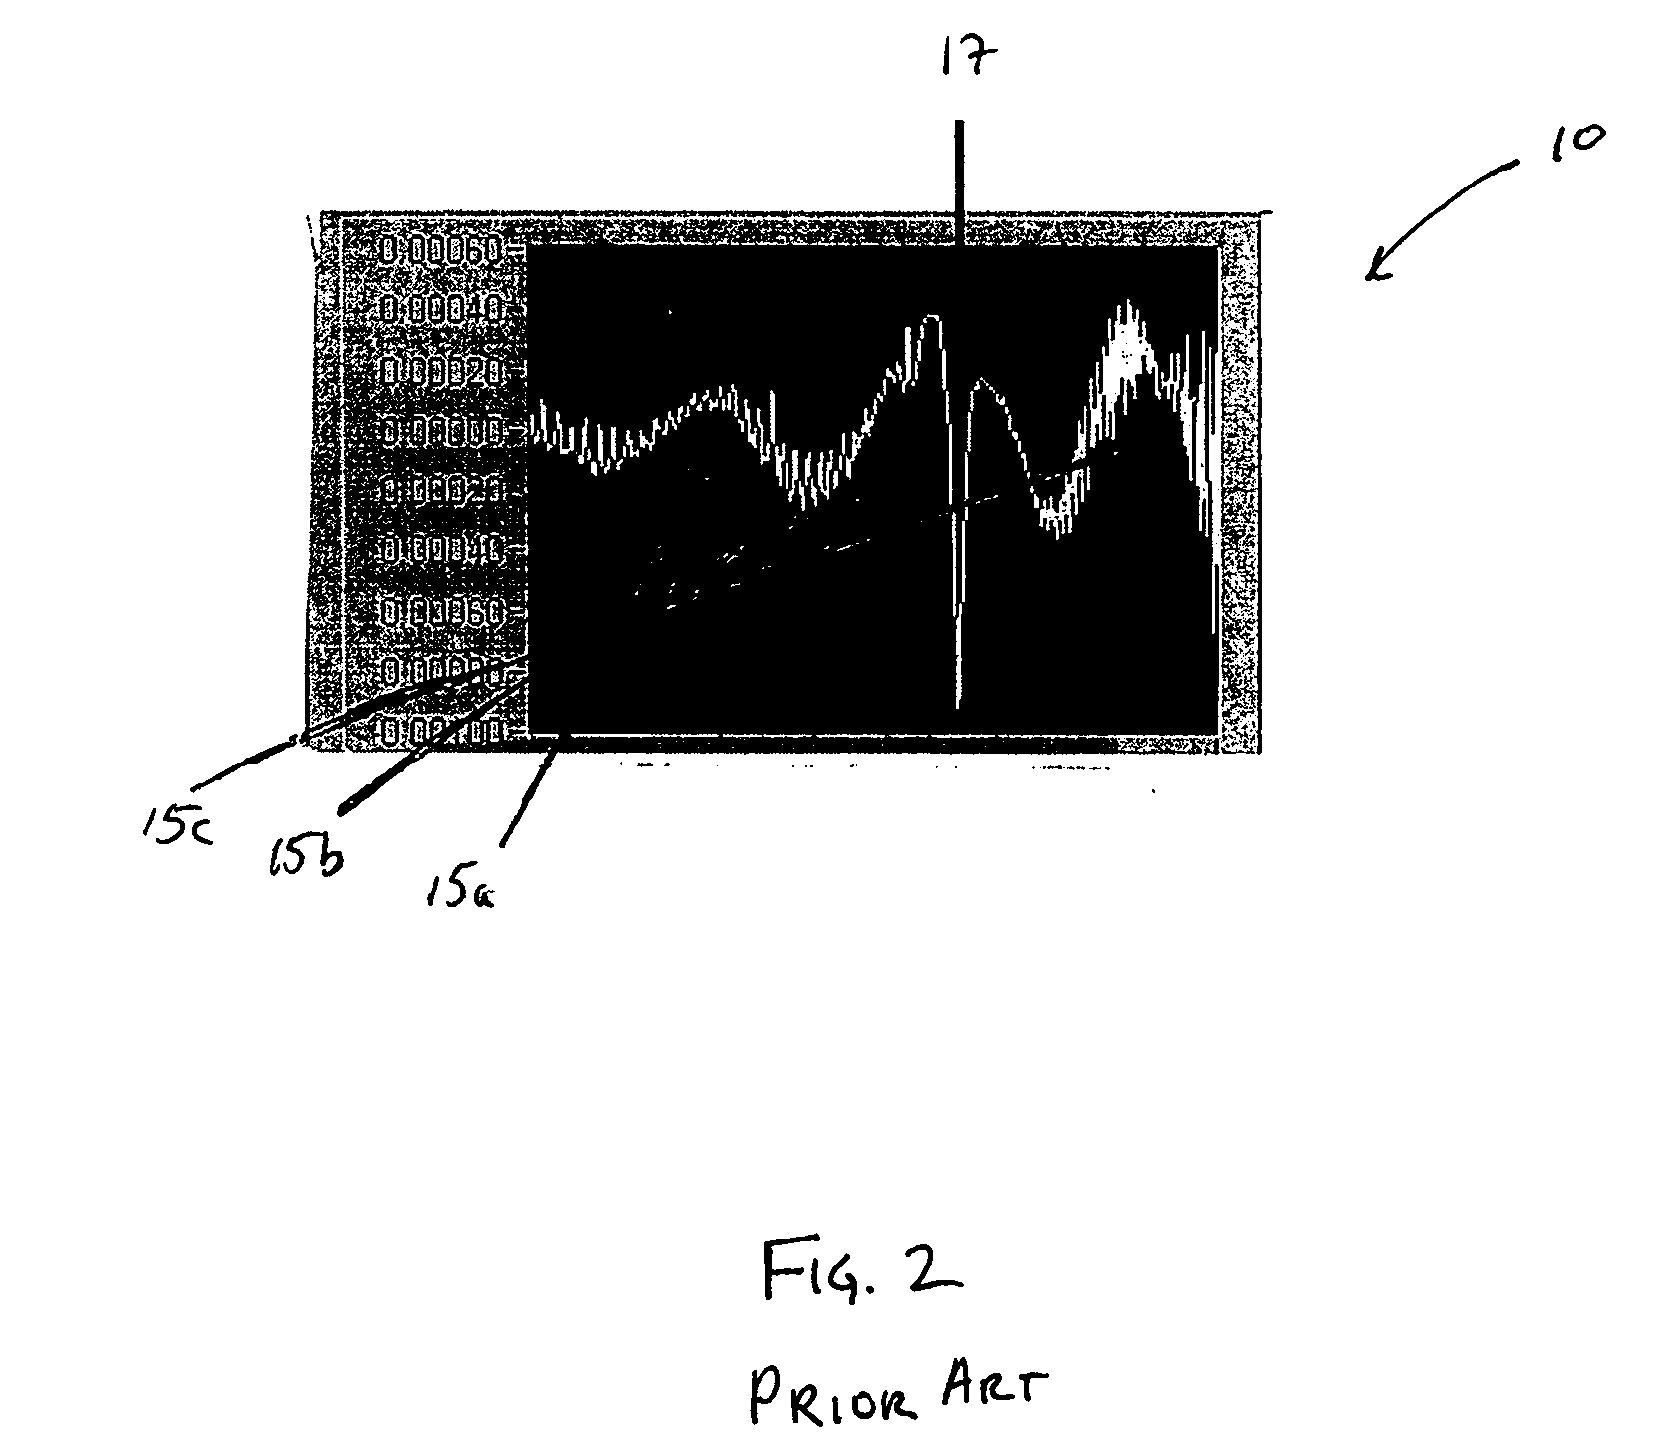
Such low and medium frequency artifacts can cause difficulty in analysis of the resulting auto-referenced spectra.
Also, such signals render the use of theoretical, noise-free references difficult, resulting in the need to create references for each instrument or some other form of calibration or instrument function transform.

Method used


Image

  • Method and apparatus of signal processing for use in spectrometry using an improved apodization function
  • Method and apparatus of signal processing for use in spectrometry using an improved apodization function
  • Method and apparatus of signal processing for use in spectrometry using an improved apodization function

Examples


Embodiment Construction

[0047] An improved apodization function is provided that is capable of being executed by a processor or other computing device to generate an apodization waveform, for use in signal processing, such as infrared spectrometry. According to the invention, the apodization waveform includes multiple segments in series whereby each segment corresponds to a different weight profile. According to one embodiment, the apodization function can be a summation of two or more constituent apodization functions in series, capable of producing an apodization waveform where each segment of the waveform has a weight profile of one of the constituent apodization functions. The two or more constituent apodization functions can be selected depending on the particular application.

[0048] For example, FIG. 3A is a diagram illustrating an apodization waveform that corresponds to an apodization function according to one embodiment. In this embodiment, the apodization function is a series summation of a unit ...


PUM


Abstract

A method and apparatus is disclosed for signal spectrometry using an improved apodization function. Such method and apparatus involve (i) obtaining sample and reference time domain waveforms; (ii) applying sample and reference apodization waveforms to the sample and reference time domain waveforms, such that substantially same weight is applied to corresponding substantially coextensive regions of the sample and reference time domain waveforms, (iii) transforming the sample and reference apodized waveforms from the time domain into the frequency domain; and (iv) generating referenced spectral analysis waveform for signal analysis from a ratio of the transformed sample and reference frequency spectra, the spectral analysis waveform substantially excluding frequencies associated with the corresponding substantially coextensive regions of the apodized sample and reference time domain waveforms.

Description

BACKGROUND [0001] In spectrometry, an interferogram or free induction decay contains the raw signals from different signal components produced by the excitation method of a spectrometer. Such excitation results in an oscillating signal that is a function of amplitude versus time. Different regions of the interferogram in the time domain contain information that can increase the signal-to-noise ratio or increase the resolution between neighboring peaks of its corresponding spectrum in the frequency domain. The increase in one, however, typically results in a tradeoff of the other. [0002] Since interferograms can only be measured out to some finite time, all experimental interferograms are finite. Upon transforming the finite time-based interferogram into the frequency domain using a technique such as the Fourier Transform, the resulting spectrum includes an observableringing,” sometimes referred to as Gibbs phenomenon. This ringing, also described as truncation error, is preferably...

Claims


Application Information

Patent Timeline
Patent Type & Authority Applications(United States)
IPC IPC(8): A61B6/00
CPCG01J3/45G01N21/27G01N21/35
Inventor BOSCH-CHARPENAY, SYLVIEMARSHIK-GEURTS, BARBARA J.KAMLET, LEONARD I.NEIRA, JORGE E.MARRAN, DAVID F.
Owner MKS INSTR INC
Learn More