Coagulation tests at ambient temperature
a technology of ambient temperature and coagulation, which is applied in the direction of microbiological testing/measurement, measurement devices, material testing goods, etc., can solve the problems of 37° c. presenting a hurdle in the design of test procedures, adding hardware and costs to the currently available instruments, and preventing the development of point-of-care (poc) testing
- Summary
- Abstract
- Description
- Claims
- Application Information
AI Technical Summary
Benefits of technology
Problems solved by technology
Method used
Image
Examples
example 1
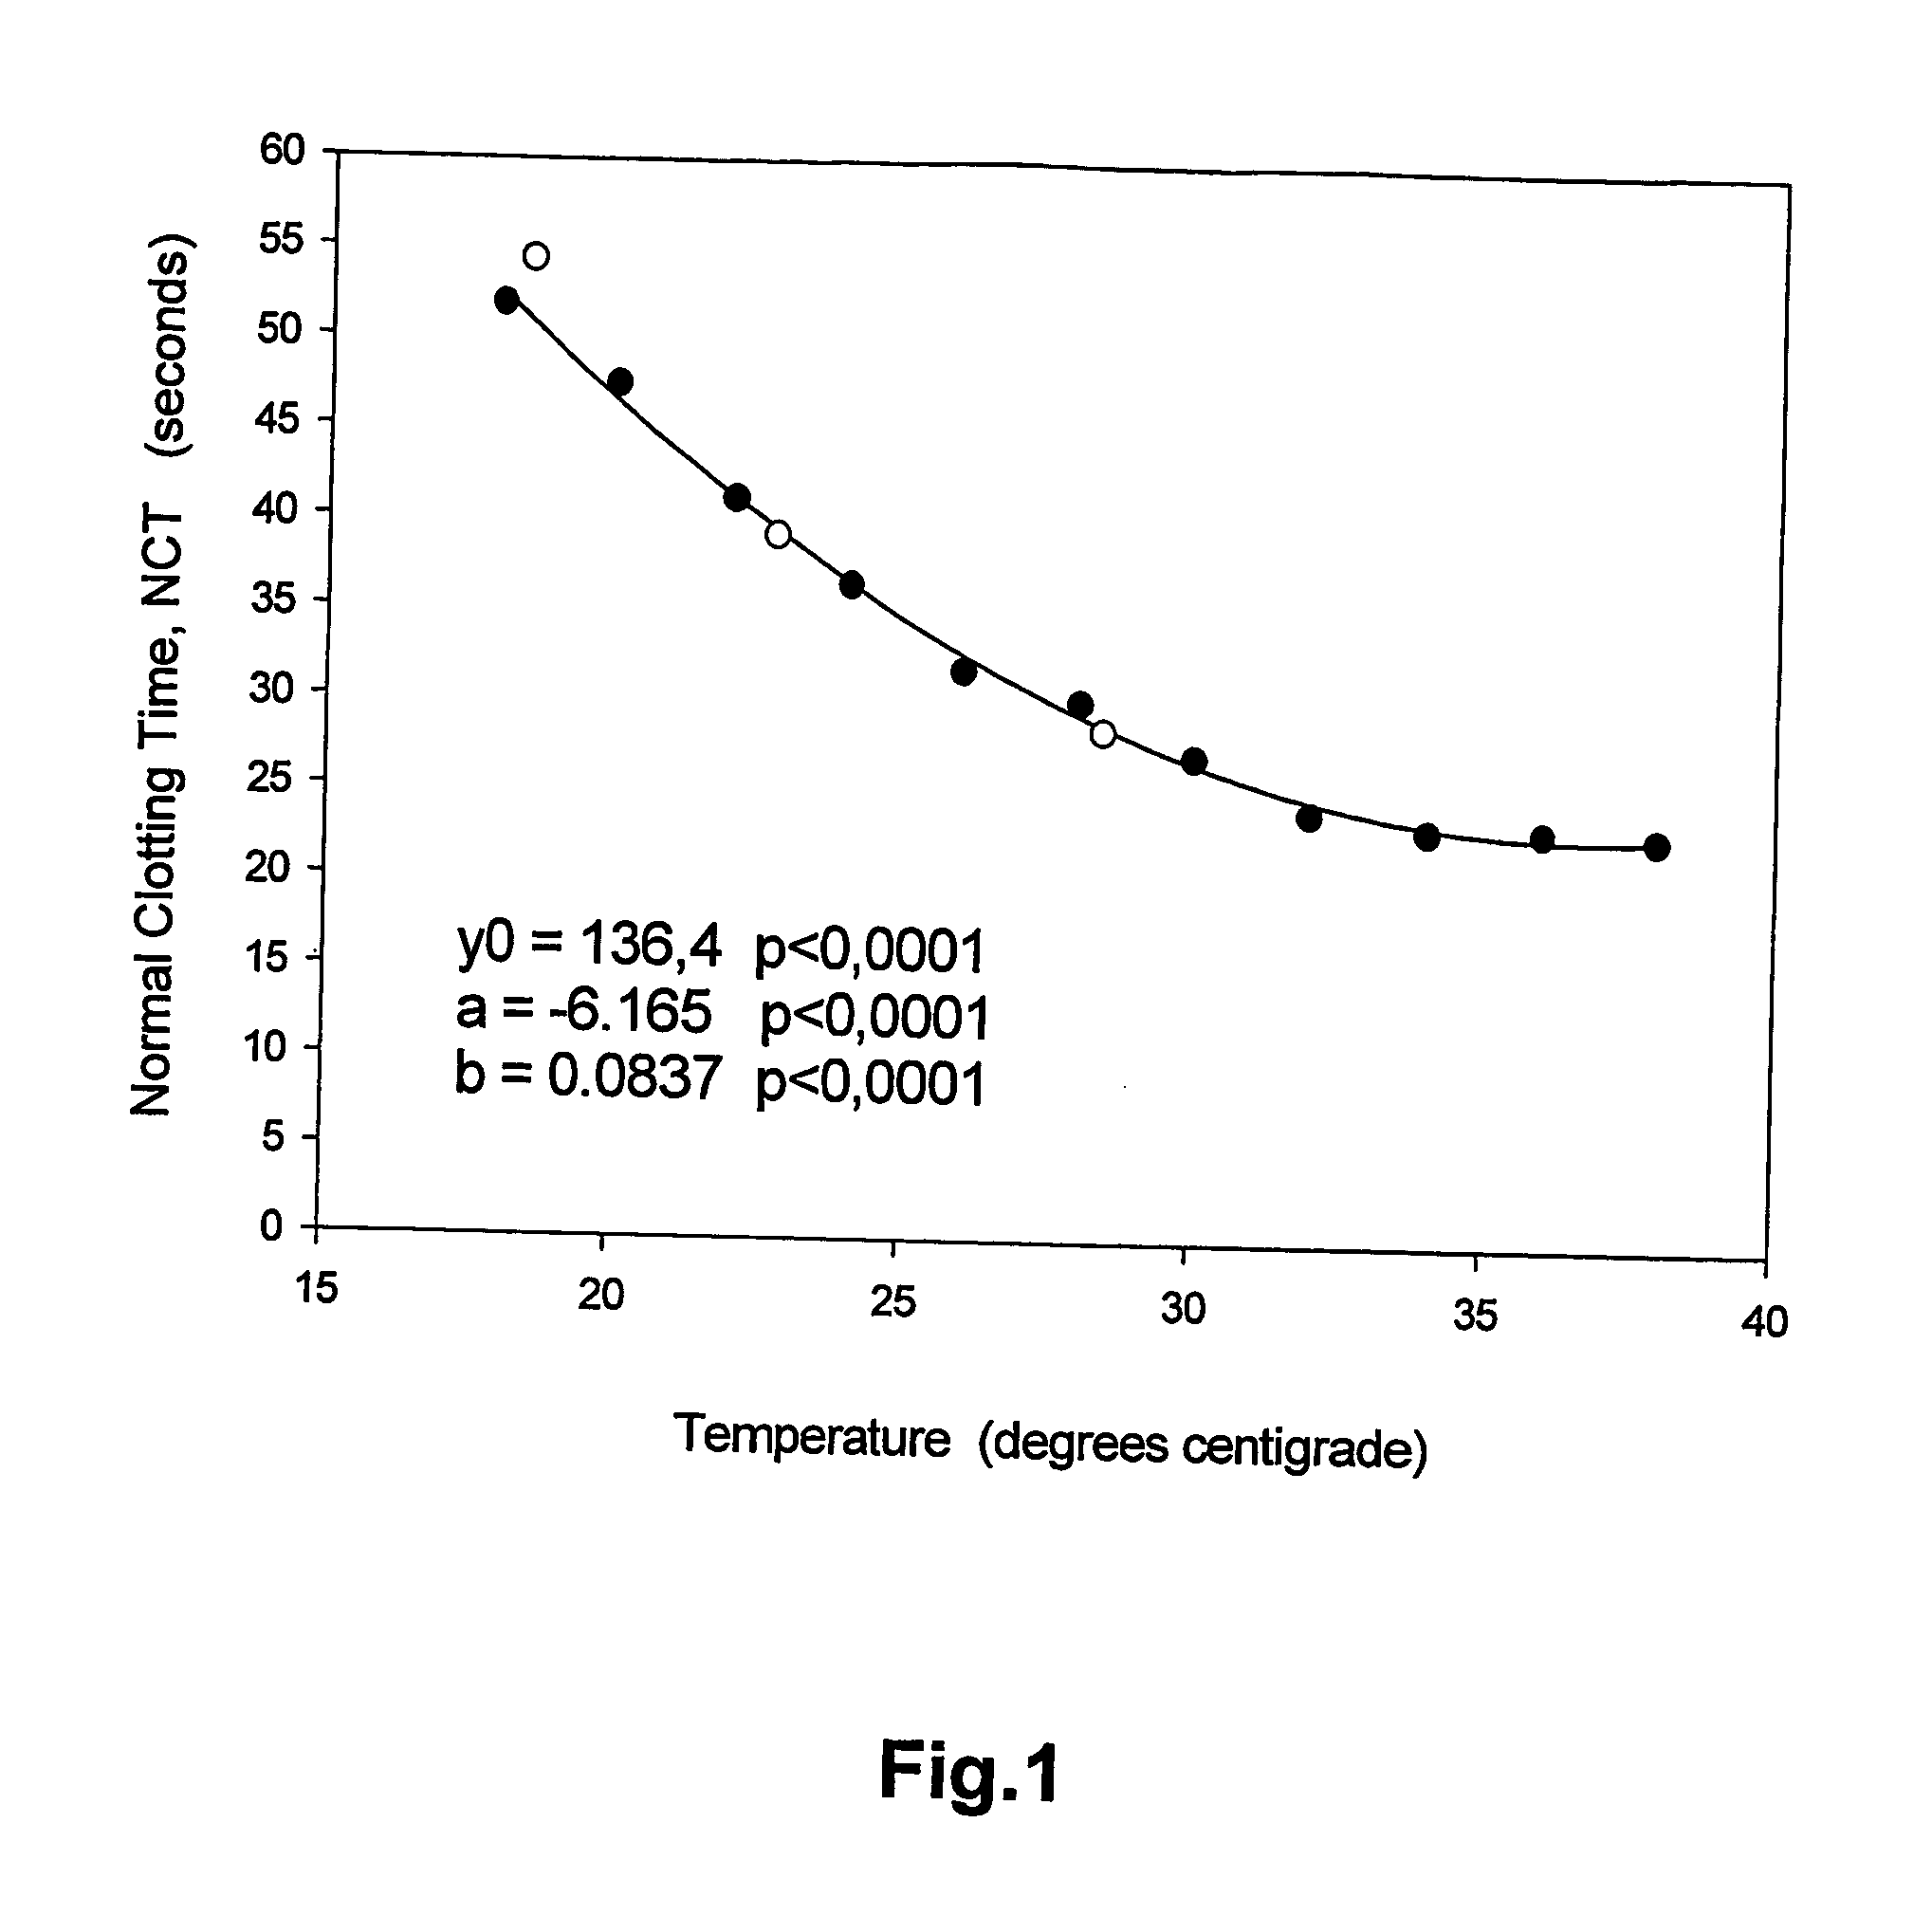
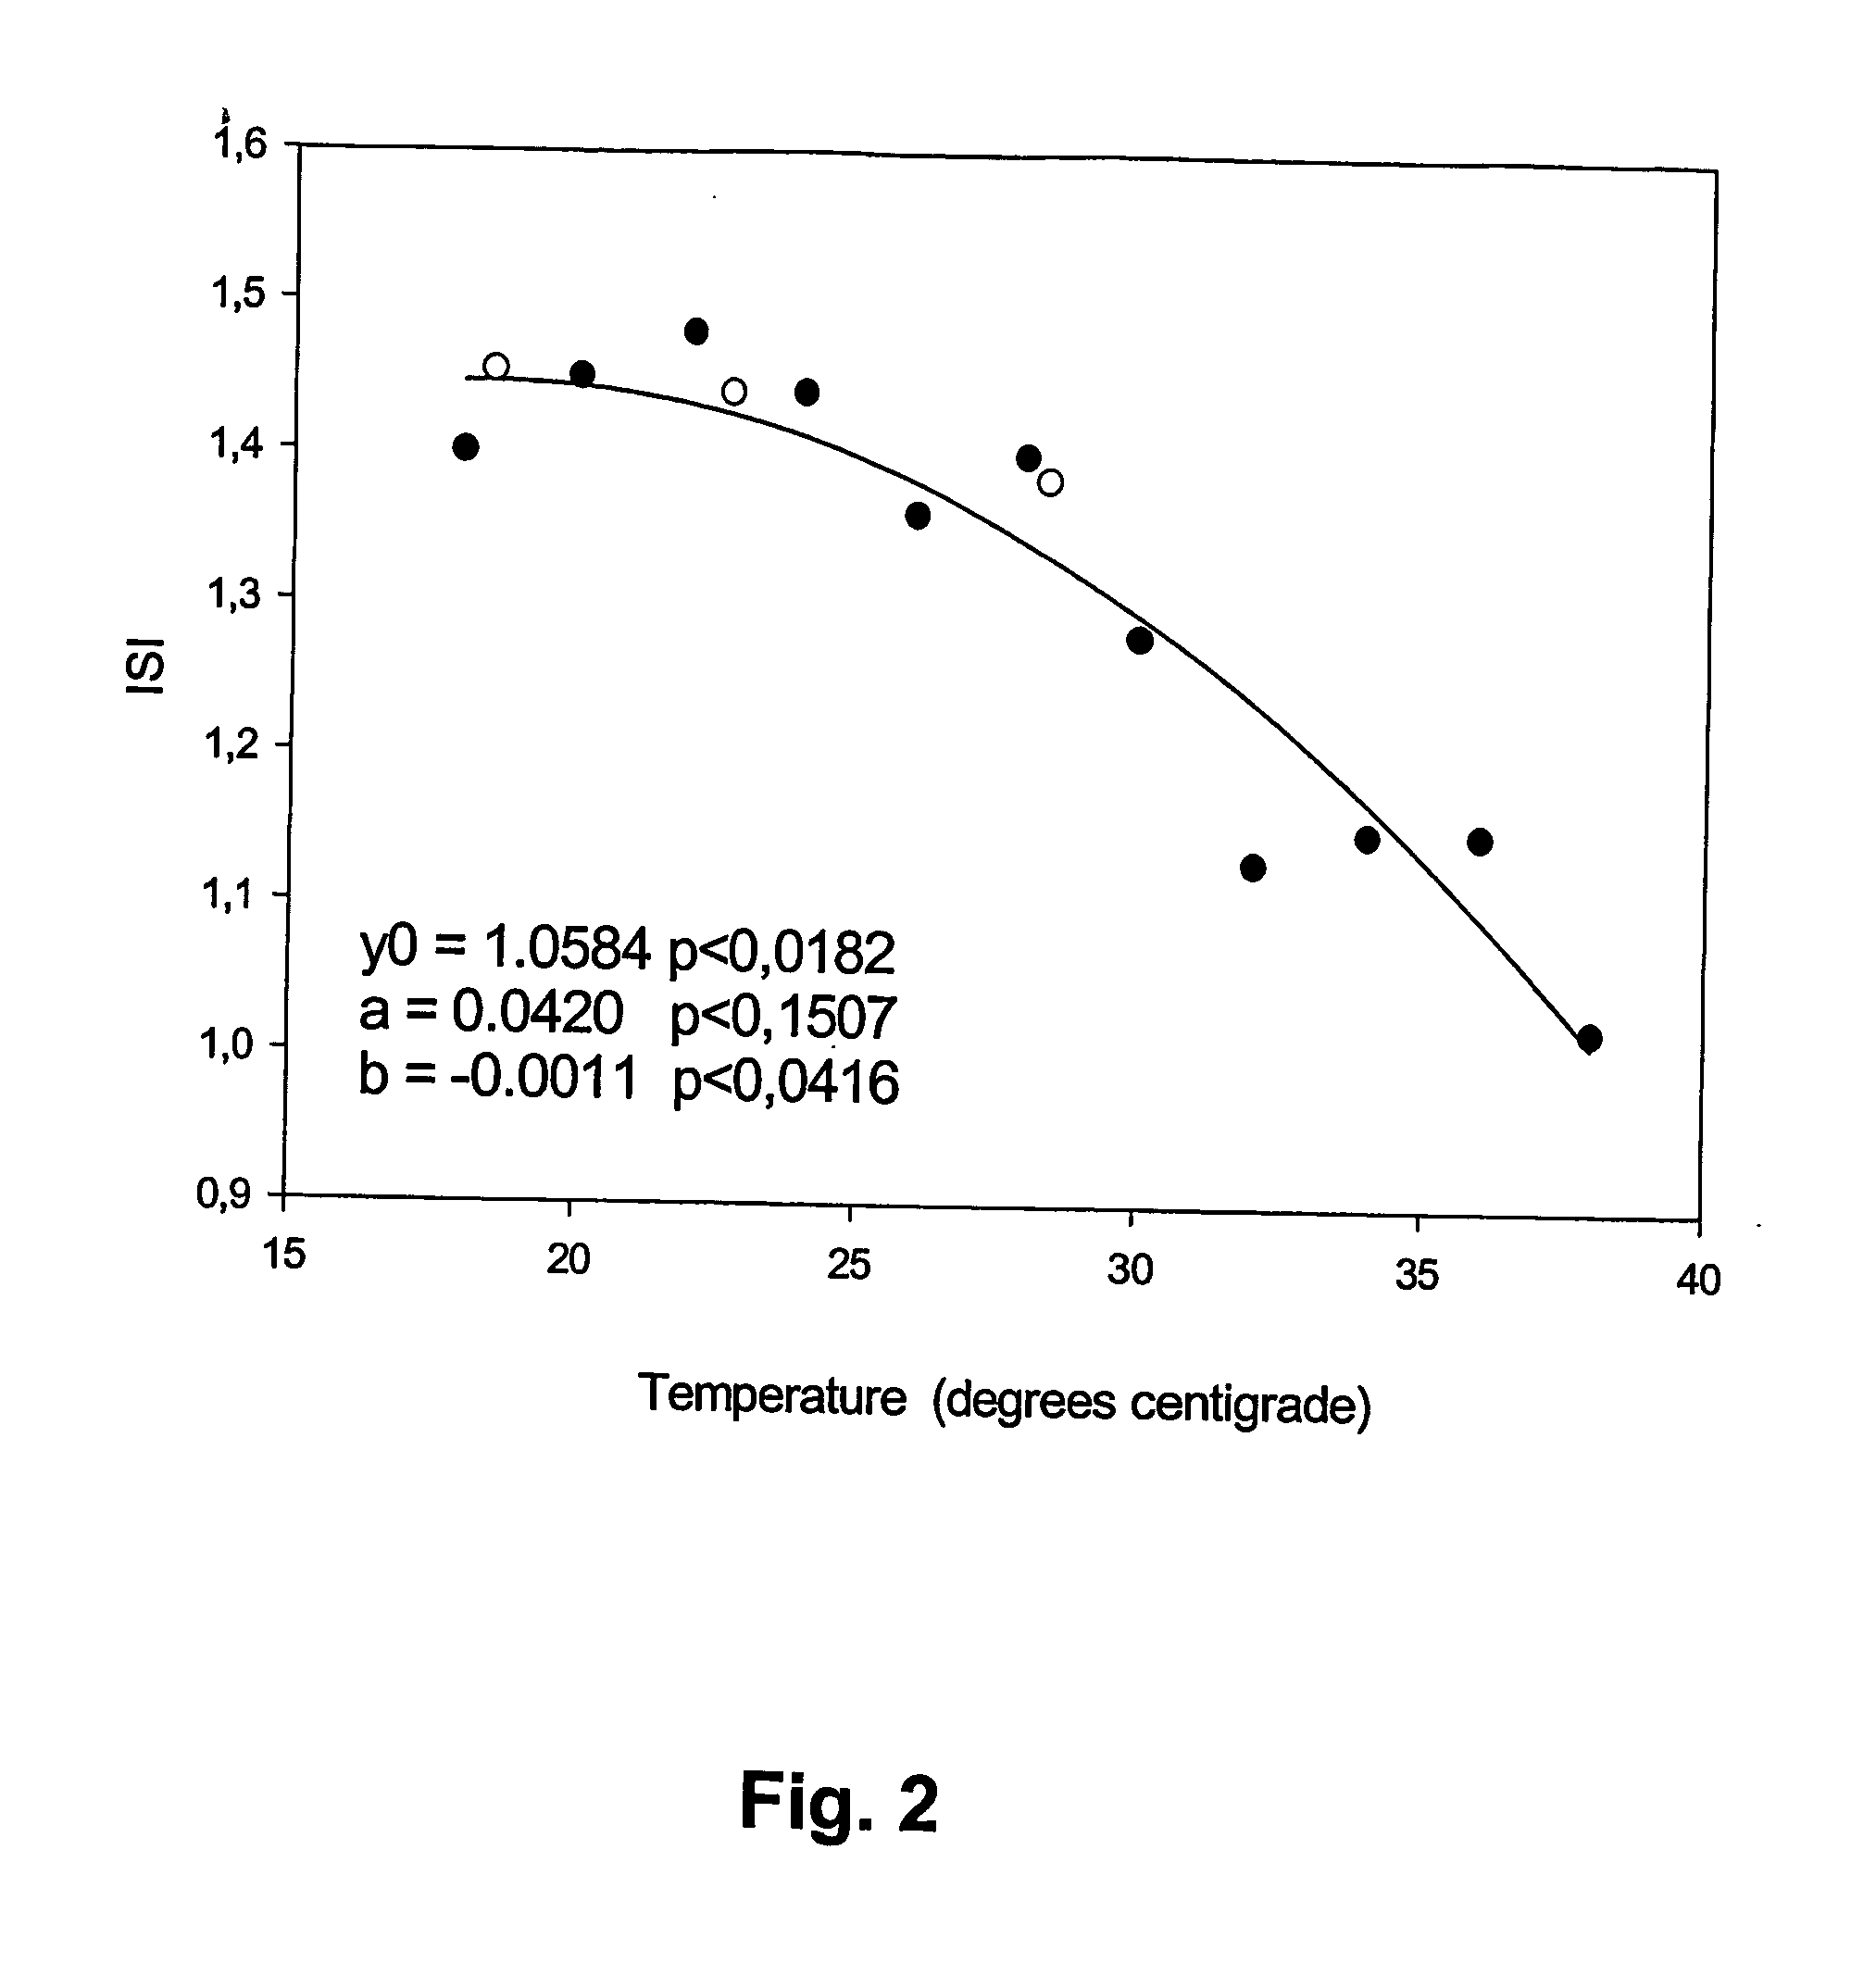
[0057] With a PT procedure, the clotting time (CT) was determined for two control plasma samples at every two degrees centigrade in the temperature range of 18° C. to 38° C. The control plasma samples had INR values of 1.14 and 2.82. From these values, the Normal Clotting Time (NCT) and International Sensitivity Index (ISI) of the PT procedure were calculated at each of the eleven temperatures. The NCT was in the range of 55 sec to 22 sec and the ISI was in the range 1.0 to 1.5, See FIGS. 1 and 2. Second-degree polynomials were fitted by minimal least square method to give NCT and ISI as functions of temperature. The second-degree polynomials that gave the best fit to the data were:
NCT(t)=136.4−6.165t+0.0837t2
ISI(t)=1.0584+0.0420t−0.0011t2
[0058] NCT and ISI for the same PT procedure was also determined at three temperatures, 18.5° C., 22.7° C. and 28.4° C. with patient plasma samples from the Department of Clinical Chemistry. FIGS. 1 and 2 also show that the estimates of NCT and ISI...
example 2
[0062] Plasma samples from 23 patients were obtained from the Department of Clinical Chemistry together with INR values determined according to prior art. The 23 samples were analyzed according to the invention. The ambient temperature and the clotting time for each sample were measured. The temperature in the series was stable at 22.7° C. At this temperature, the NCT and ISI of the PT procedure was determined with respect to the prior art INR values. INR values according to the invention were then computed. The INR values obtained according to the invention at 22.7° C. were compared to the INR values obtained according to prior art at 37° C., see FIG. 4. The comparison was by linear regression. A slope of near unity (1.008), an intercept close to zero (0.007) and a correlation coefficient of 0.982 was obtained. There were no obvious outliers. The first 12 of the 23 samples were similarly analyzed at 18.5° C. and 28.4° C. For each of these 12 samples a mean INR value was determined ...
PUM
| Property | Measurement | Unit |
|---|---|---|
| temperature | aaaaa | aaaaa |
| concentration | aaaaa | aaaaa |
| ambient temperature | aaaaa | aaaaa |
Abstract
Description
Claims
Application Information
 - R&D
- Intellectual Property
- Life Sciences
- Materials
- Tech Scout
- Unparalleled Data Quality
- Higher Quality Content
- 60% Fewer Hallucinations
Browse by: Latest US Patents, China's latest patents, Technical Efficacy Thesaurus, Application Domain, Technology Topic, Popular Technical Reports.
© 2025 PatSnap. All rights reserved.Legal|Privacy policy|Modern Slavery Act Transparency Statement|Sitemap|About US| Contact US: help@patsnap.com


