Therapeutic delivery of carbon monoxide
- Summary
- Abstract
- Description
- Claims
- Application Information
AI Technical Summary
Benefits of technology
Problems solved by technology
Method used
Image
Examples
example 1
Conversion of Myoglobin (Mb) to Carbon Monoxide Myoglobin (MbCO) by CO Gas
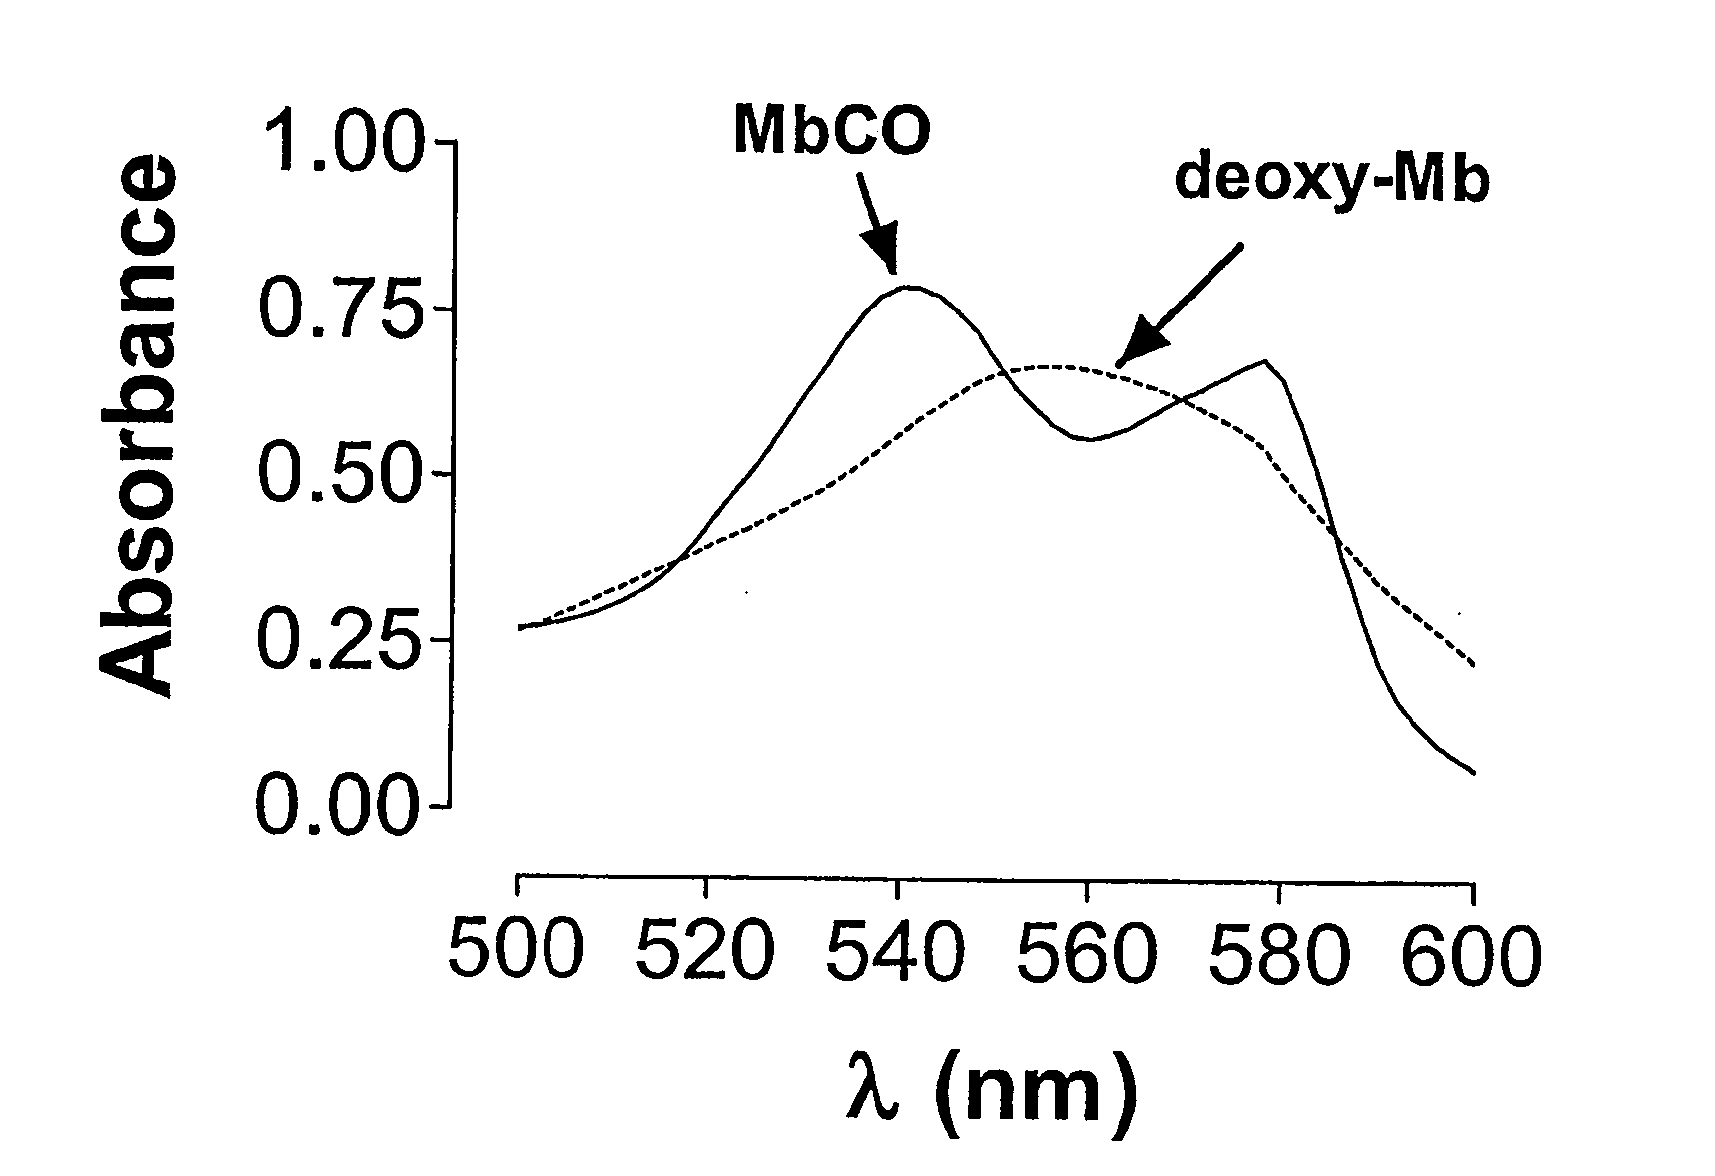
[0068] Myoglobin (Mb) in its reduced state displays a characteristic spectrum with a maximal absorption peak at 555 nm (see FIG. 1, dotted line). When a solution of Mb (50 μM) is bubbled for 1 min with Co gas (1%), a rapid conversion to carbon monoxide myoglobin (MbCO) is observed. As shown in FIG. 1, MbCO displays a characteristic spectrum with two maximal absorption peaks at 540 and 576 nm, respectively (solid line). This method has been previously developed to monitor and determine the amount of CO released from CO-RMs23 and can be used to examine how various conditions such as different pHs and temperatures can affect the kinetics of CO release (see Examples 4).
example 2
Conversion of Myoglobin (Mb) to Carbon Monoxide Myoglobin (MbCO) by CORM-A1
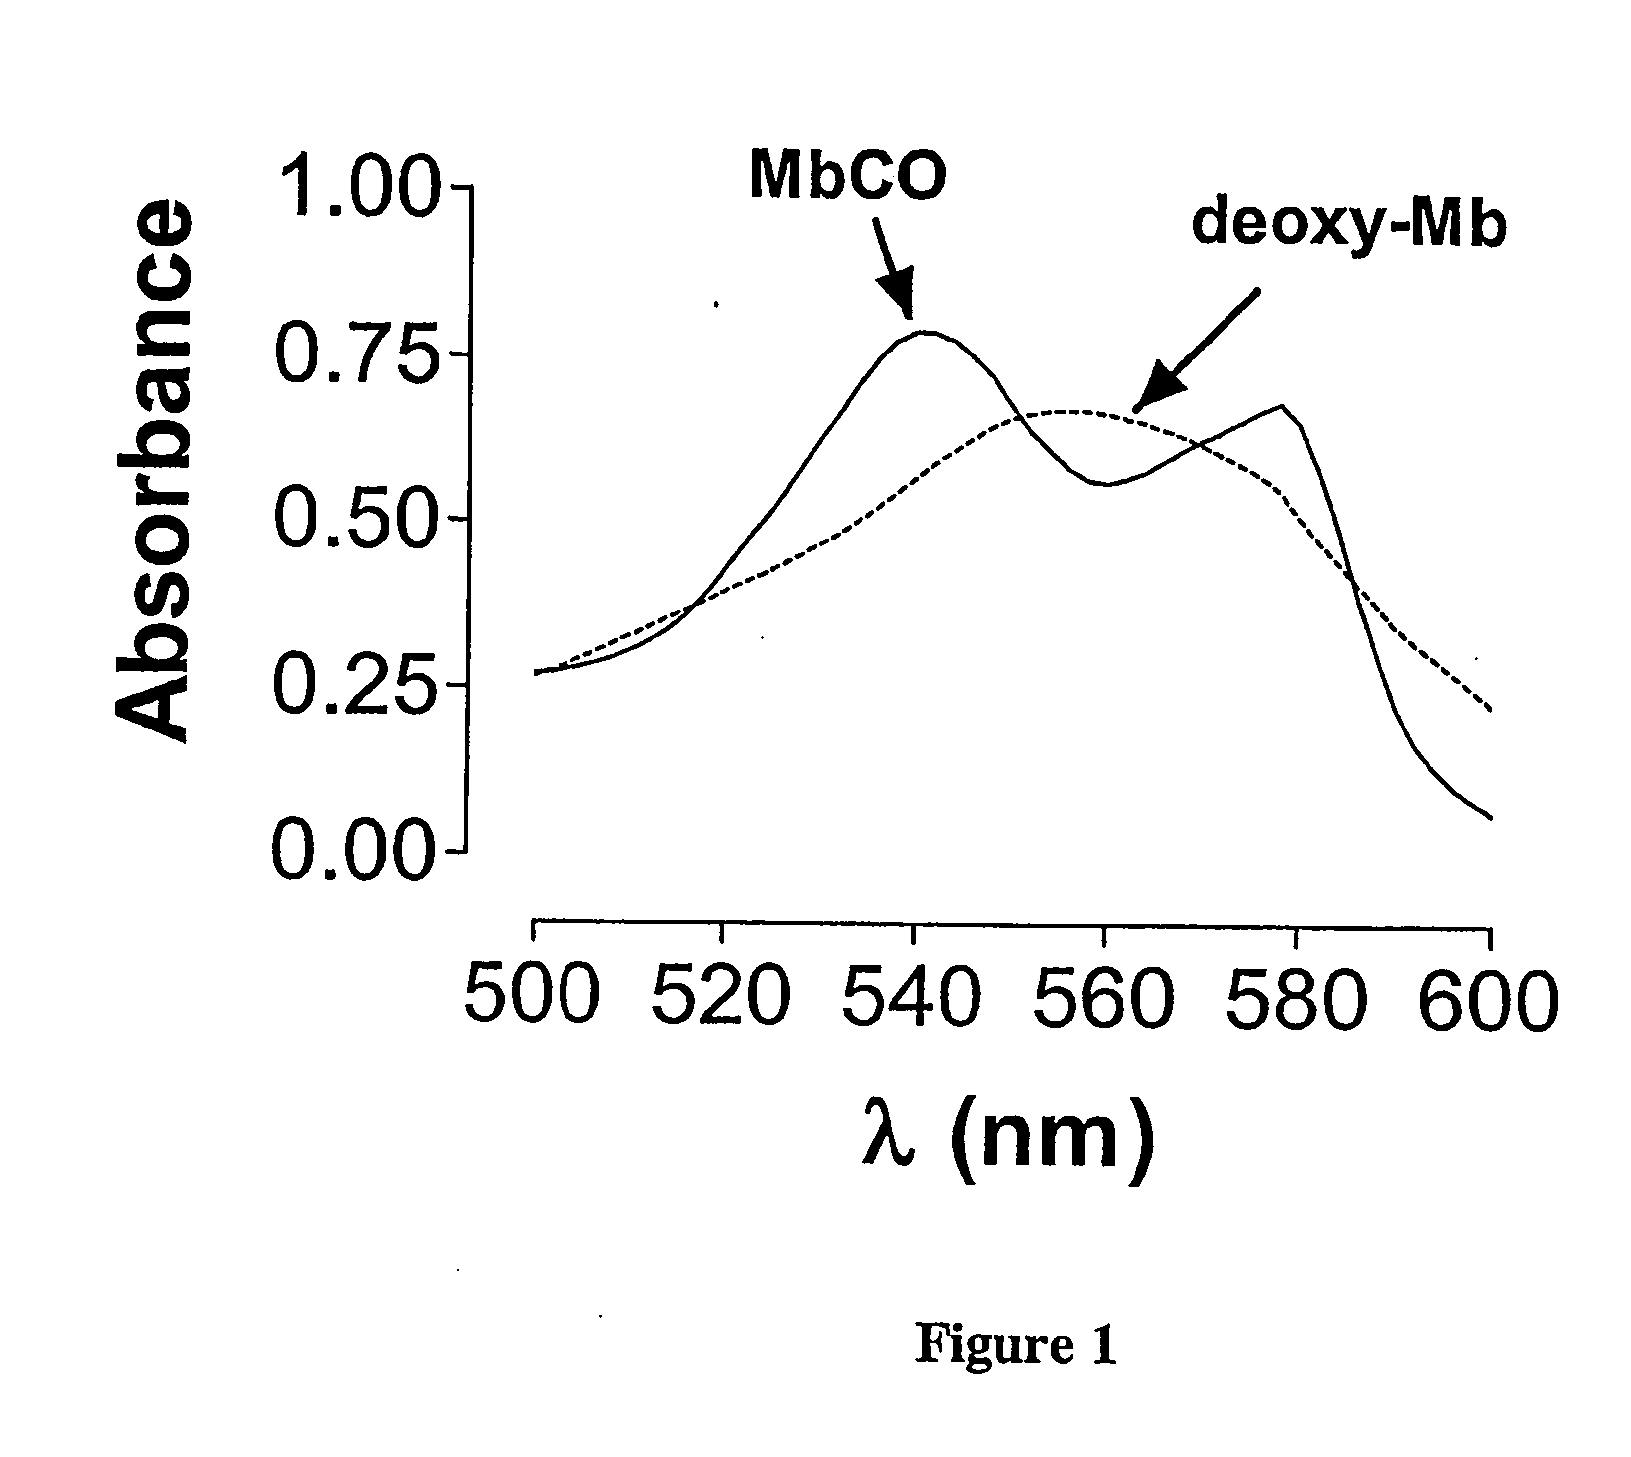
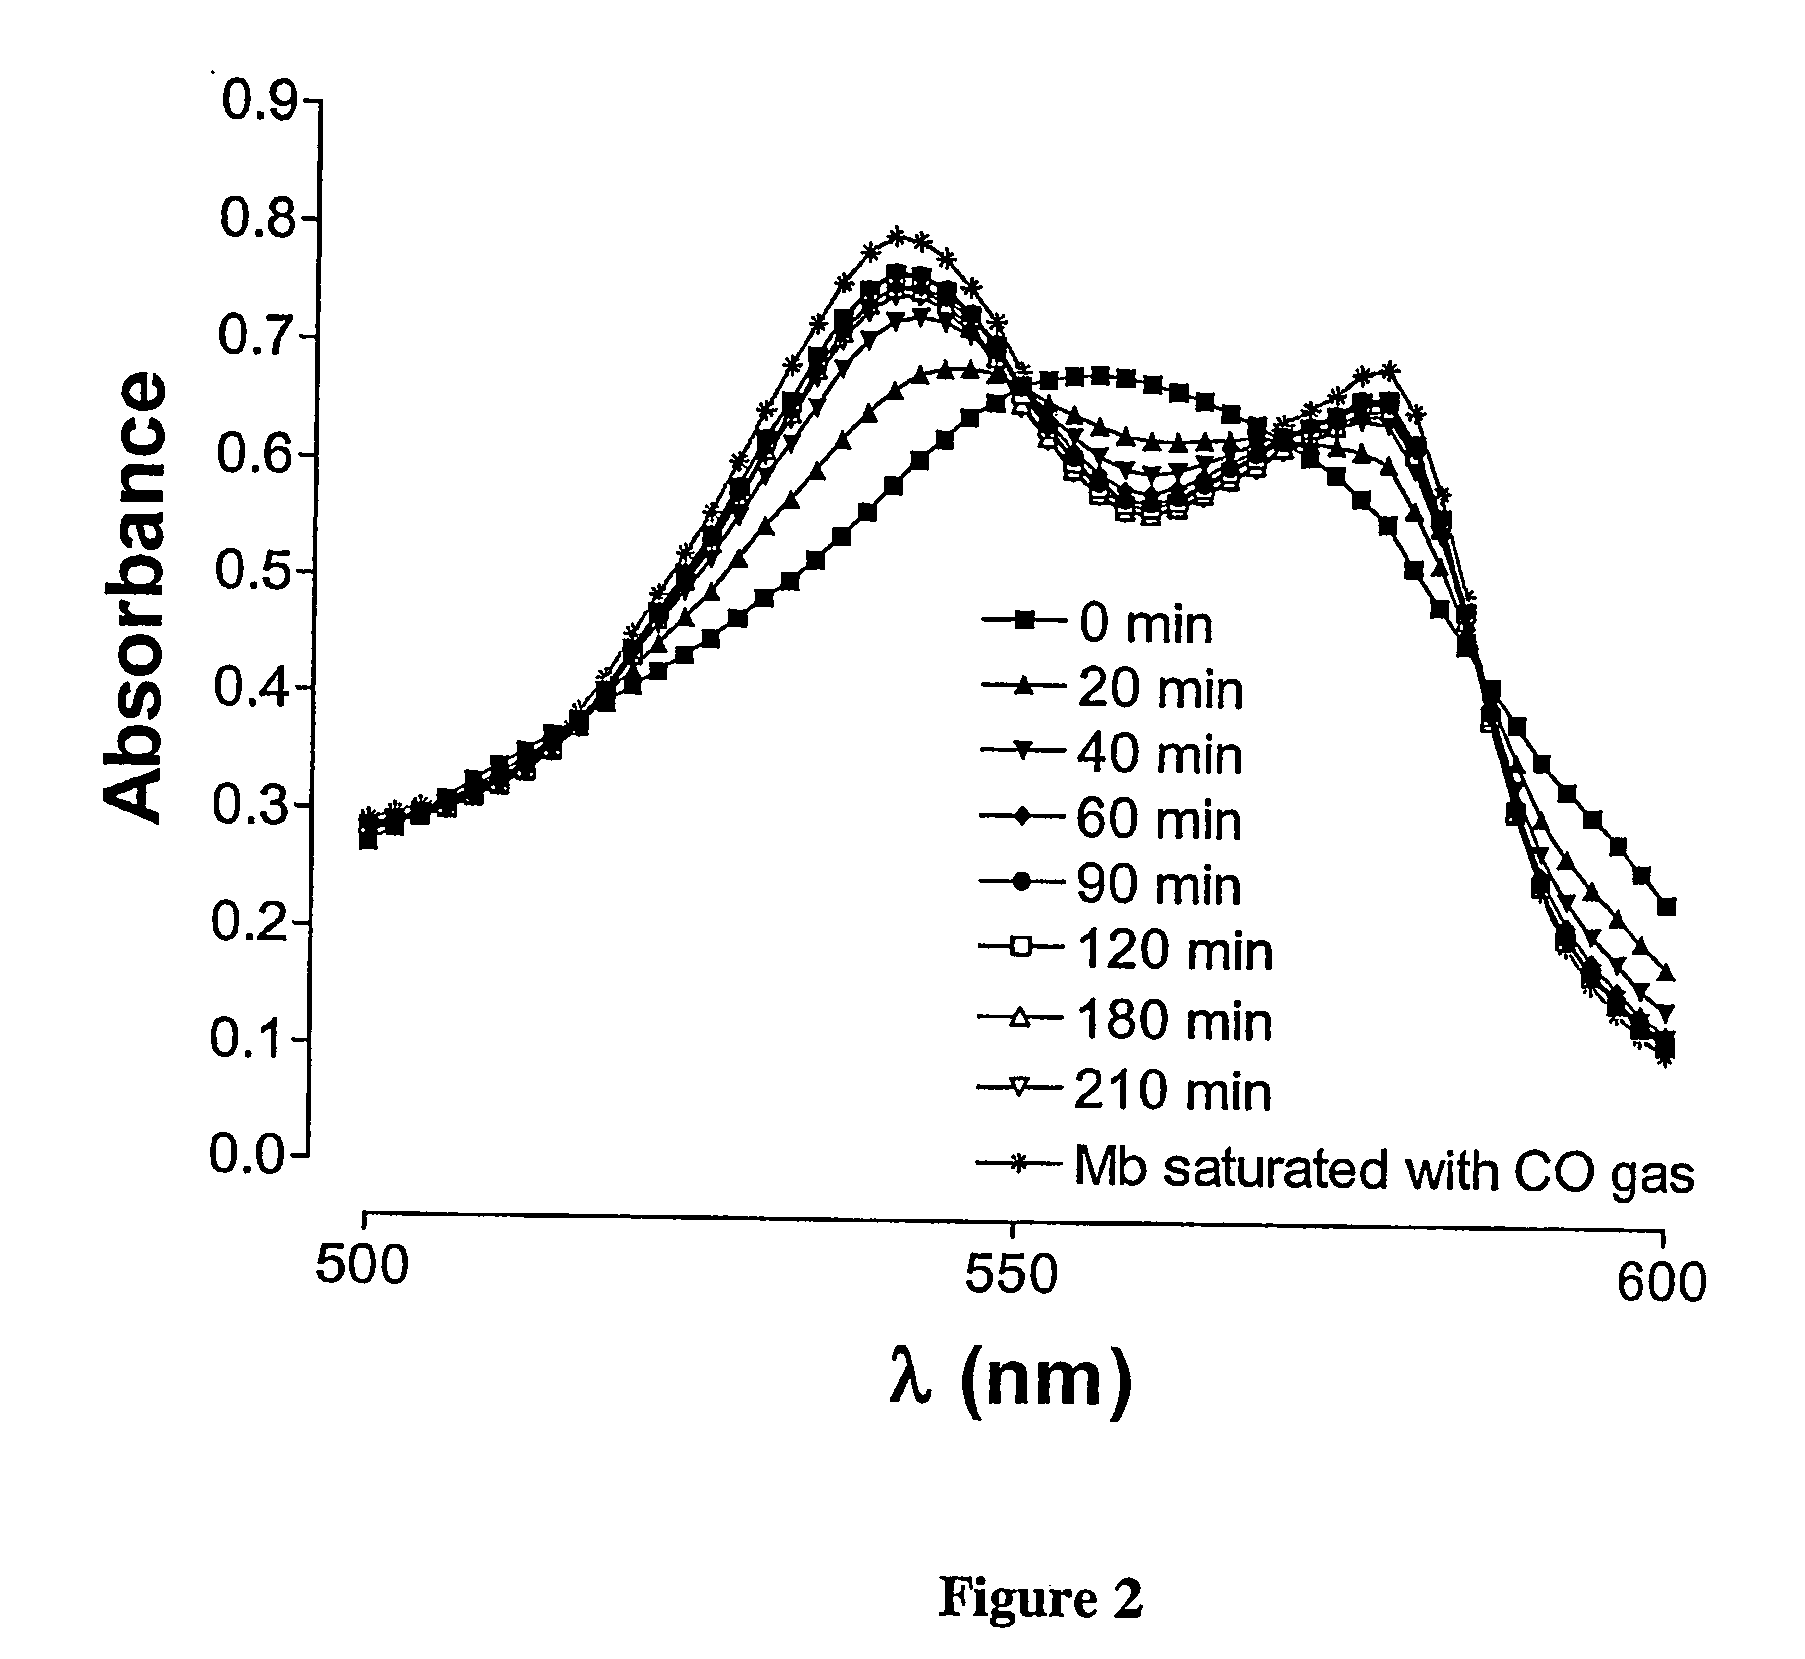
[0069] Addition of CORM-A1 (60 μM) to a solution containing reduced Mb (pH=7.4, temp.=37° C.) resulted in a gradual formation of MbCO over time. As shown in FIG. 2, a spectrum typical of reduced Mb (filled square) is converted to a spectrum characteristic of MbCO after 210 min incubation (inverted open triangle). The trace with asterisks shows the spectrum of MbCO when Mb is saturated with CO gas (positive control) as described in Materials and Methods.
example 3
Kinetics of Co Release from CORM-A1 at Room Temperature
[0070] The amount of MbCO formed after addition of CORM-A1 to the Mb solution can be quantified by measuring the absorbance at 540 nm knowing the extinction coefficient for MbCO (ε=15.4 M−1 cm−1). CORM-A1 at three different concentrations was added to a solution containing Mb at room temperature and the formed MbCO was calculated over time. Non-linear regression analysis using one phase exponential association (GraphPad Prism) resulted in the best fitting of the three curves (r2>0.99). As shown in FIG. 3, the amount of MbCO formed from CORM-A1 increases with a defined kinetic in a concentration-dependent manner. The calculated Ymax for each plot (16.7±1.2, 33.1±1.4 and 48.2±2.5) was in very good agreement with the three concentrations of CORM-A1 used (15.6, 31.1 and 46.7 μM, respectively). This indicates that the reaction leading to the formation of CO from CORM-A1 in aqueous solution goes to completion over time and that one m...
PUM
| Property | Measurement | Unit |
|---|---|---|
| Time | aaaaa | aaaaa |
| Time | aaaaa | aaaaa |
| Time | aaaaa | aaaaa |
Abstract
Description
Claims
Application Information
 - R&D
- Intellectual Property
- Life Sciences
- Materials
- Tech Scout
- Unparalleled Data Quality
- Higher Quality Content
- 60% Fewer Hallucinations
Browse by: Latest US Patents, China's latest patents, Technical Efficacy Thesaurus, Application Domain, Technology Topic, Popular Technical Reports.
© 2025 PatSnap. All rights reserved.Legal|Privacy policy|Modern Slavery Act Transparency Statement|Sitemap|About US| Contact US: help@patsnap.com


