Biochemical marker for diagnosing a leukodystrophy
a biochemical marker and leukodystrophy technology, applied in the direction of chemistry apparatus and processes, separation processes, instruments, etc., can solve the problems of unclassified leukodystrophy diagnosis, unsatisfactory diagnosis, delay or prevent accurate diagnosis,
- Summary
- Abstract
- Description
- Claims
- Application Information
AI Technical Summary
Benefits of technology
Problems solved by technology
Method used
Image
Examples
example 1
Two Dimensional Gel Electrophoresis
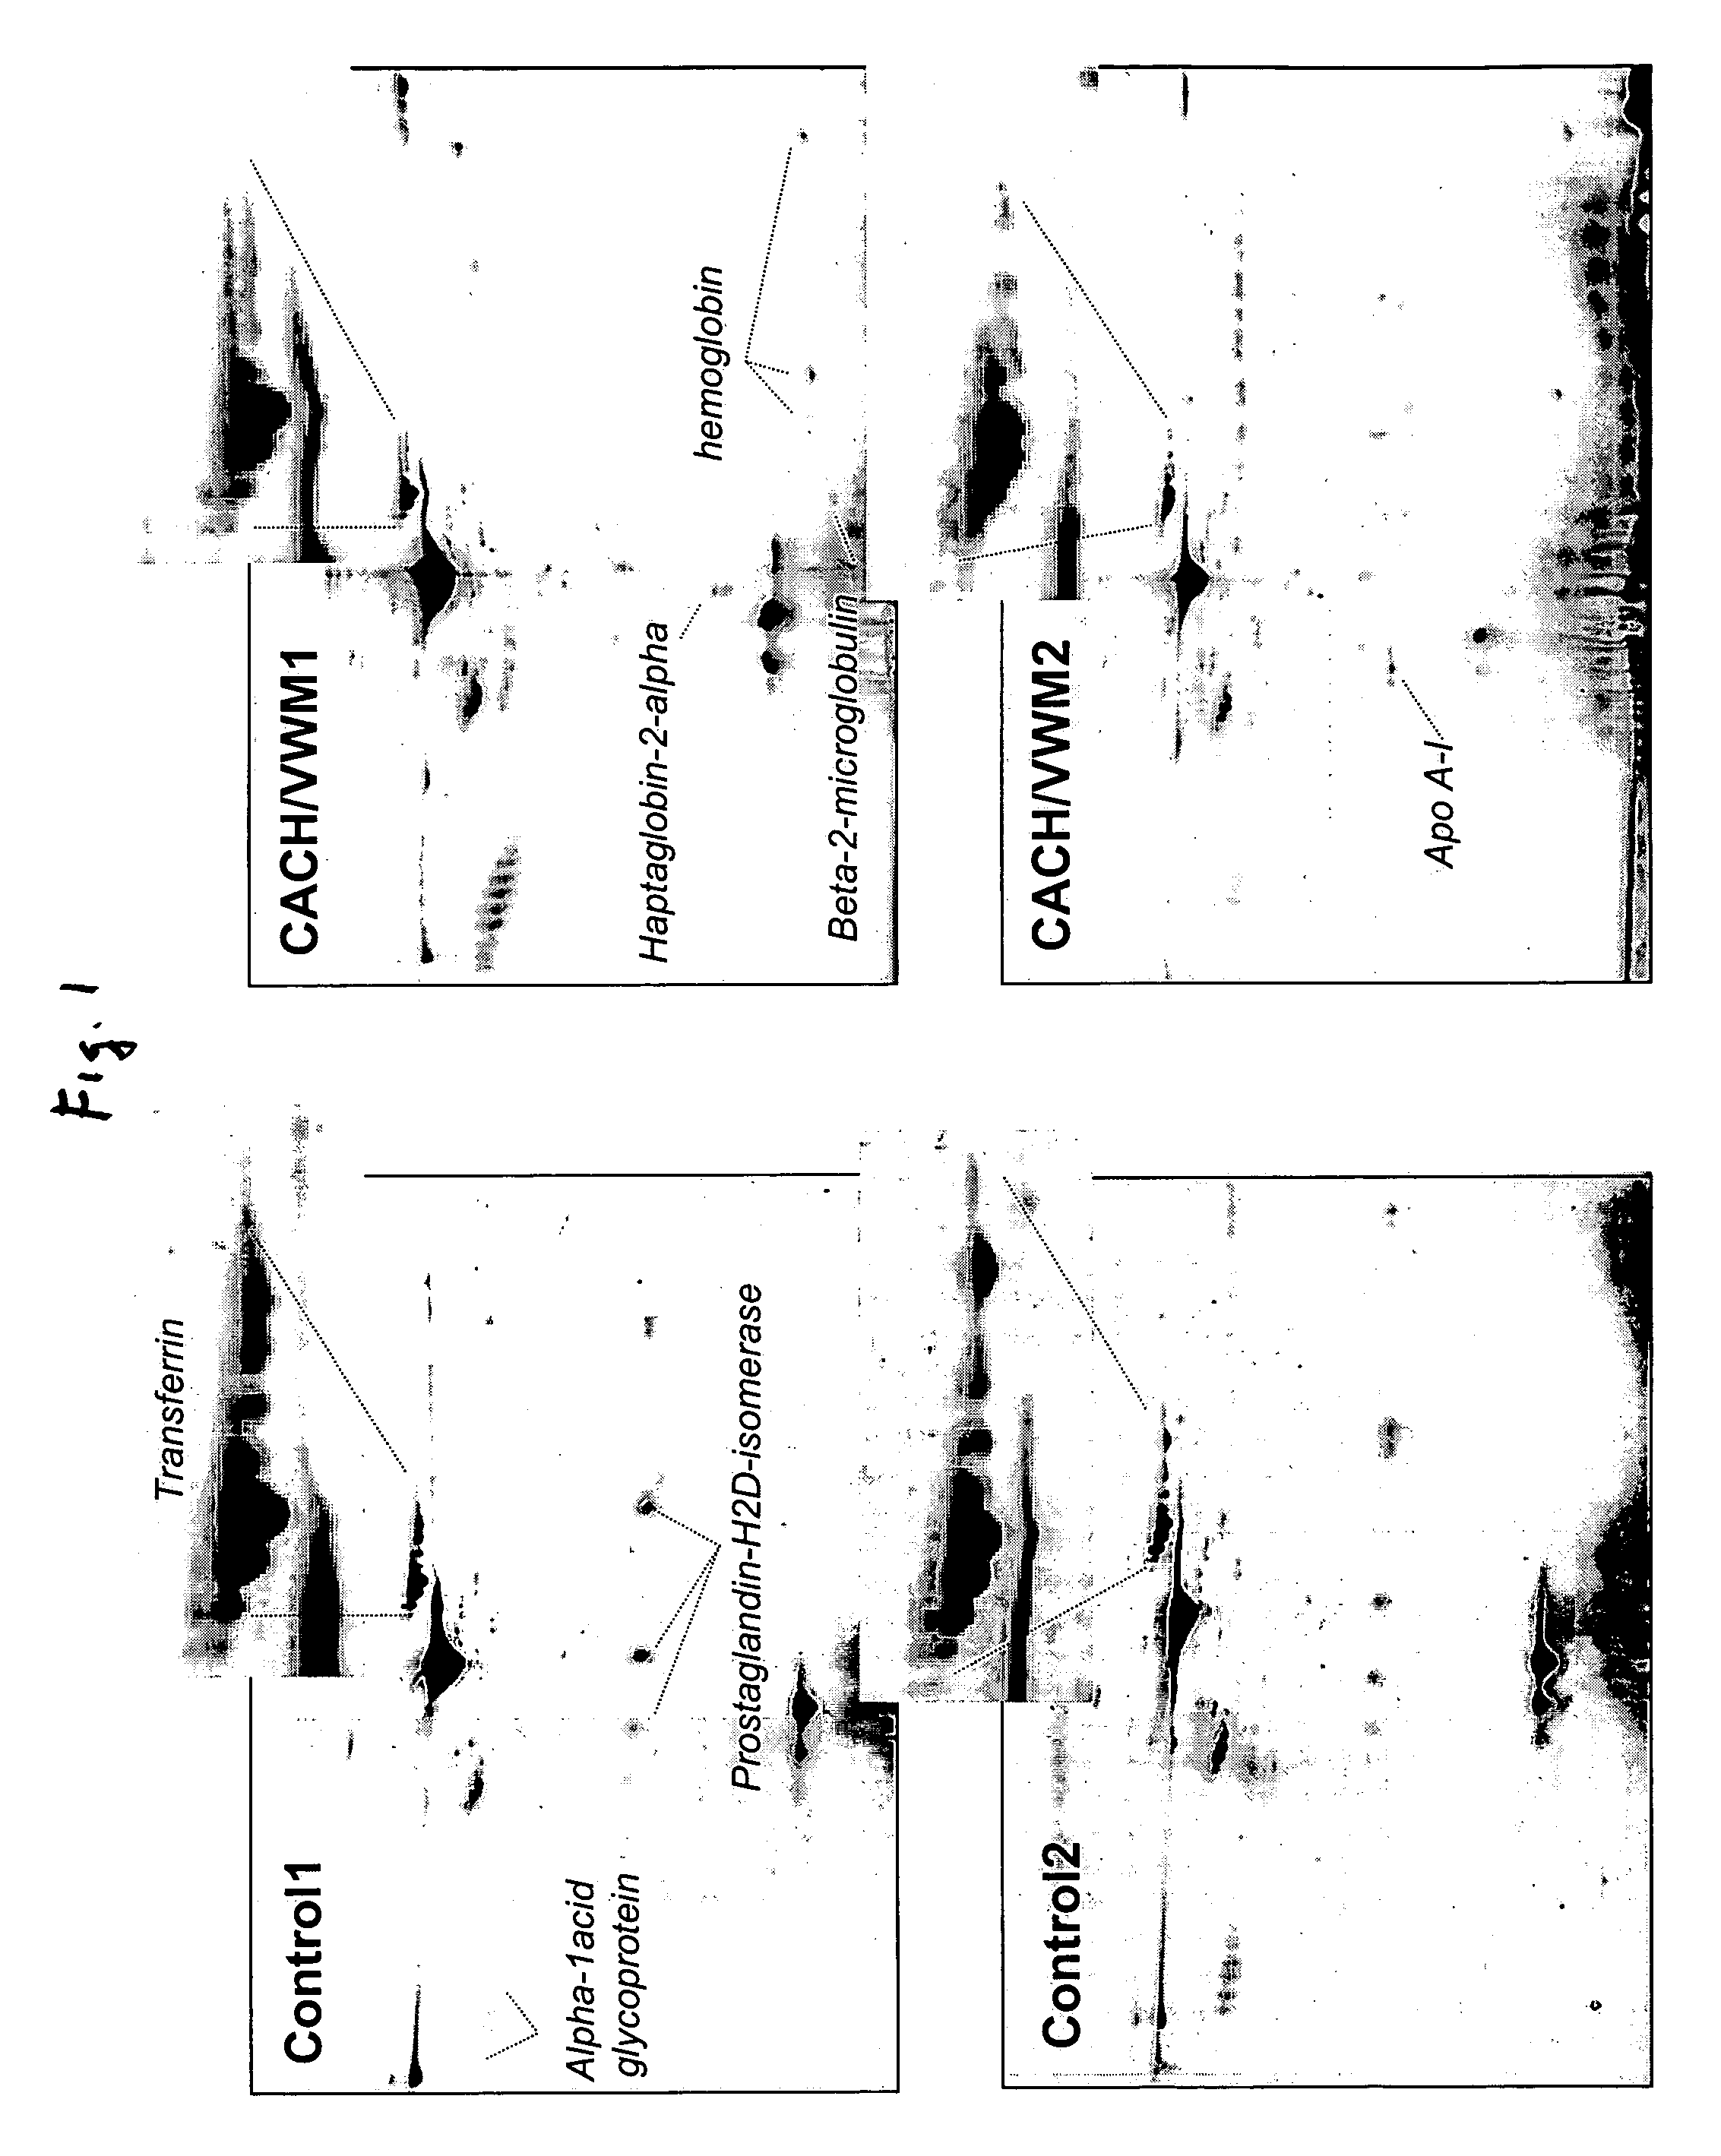
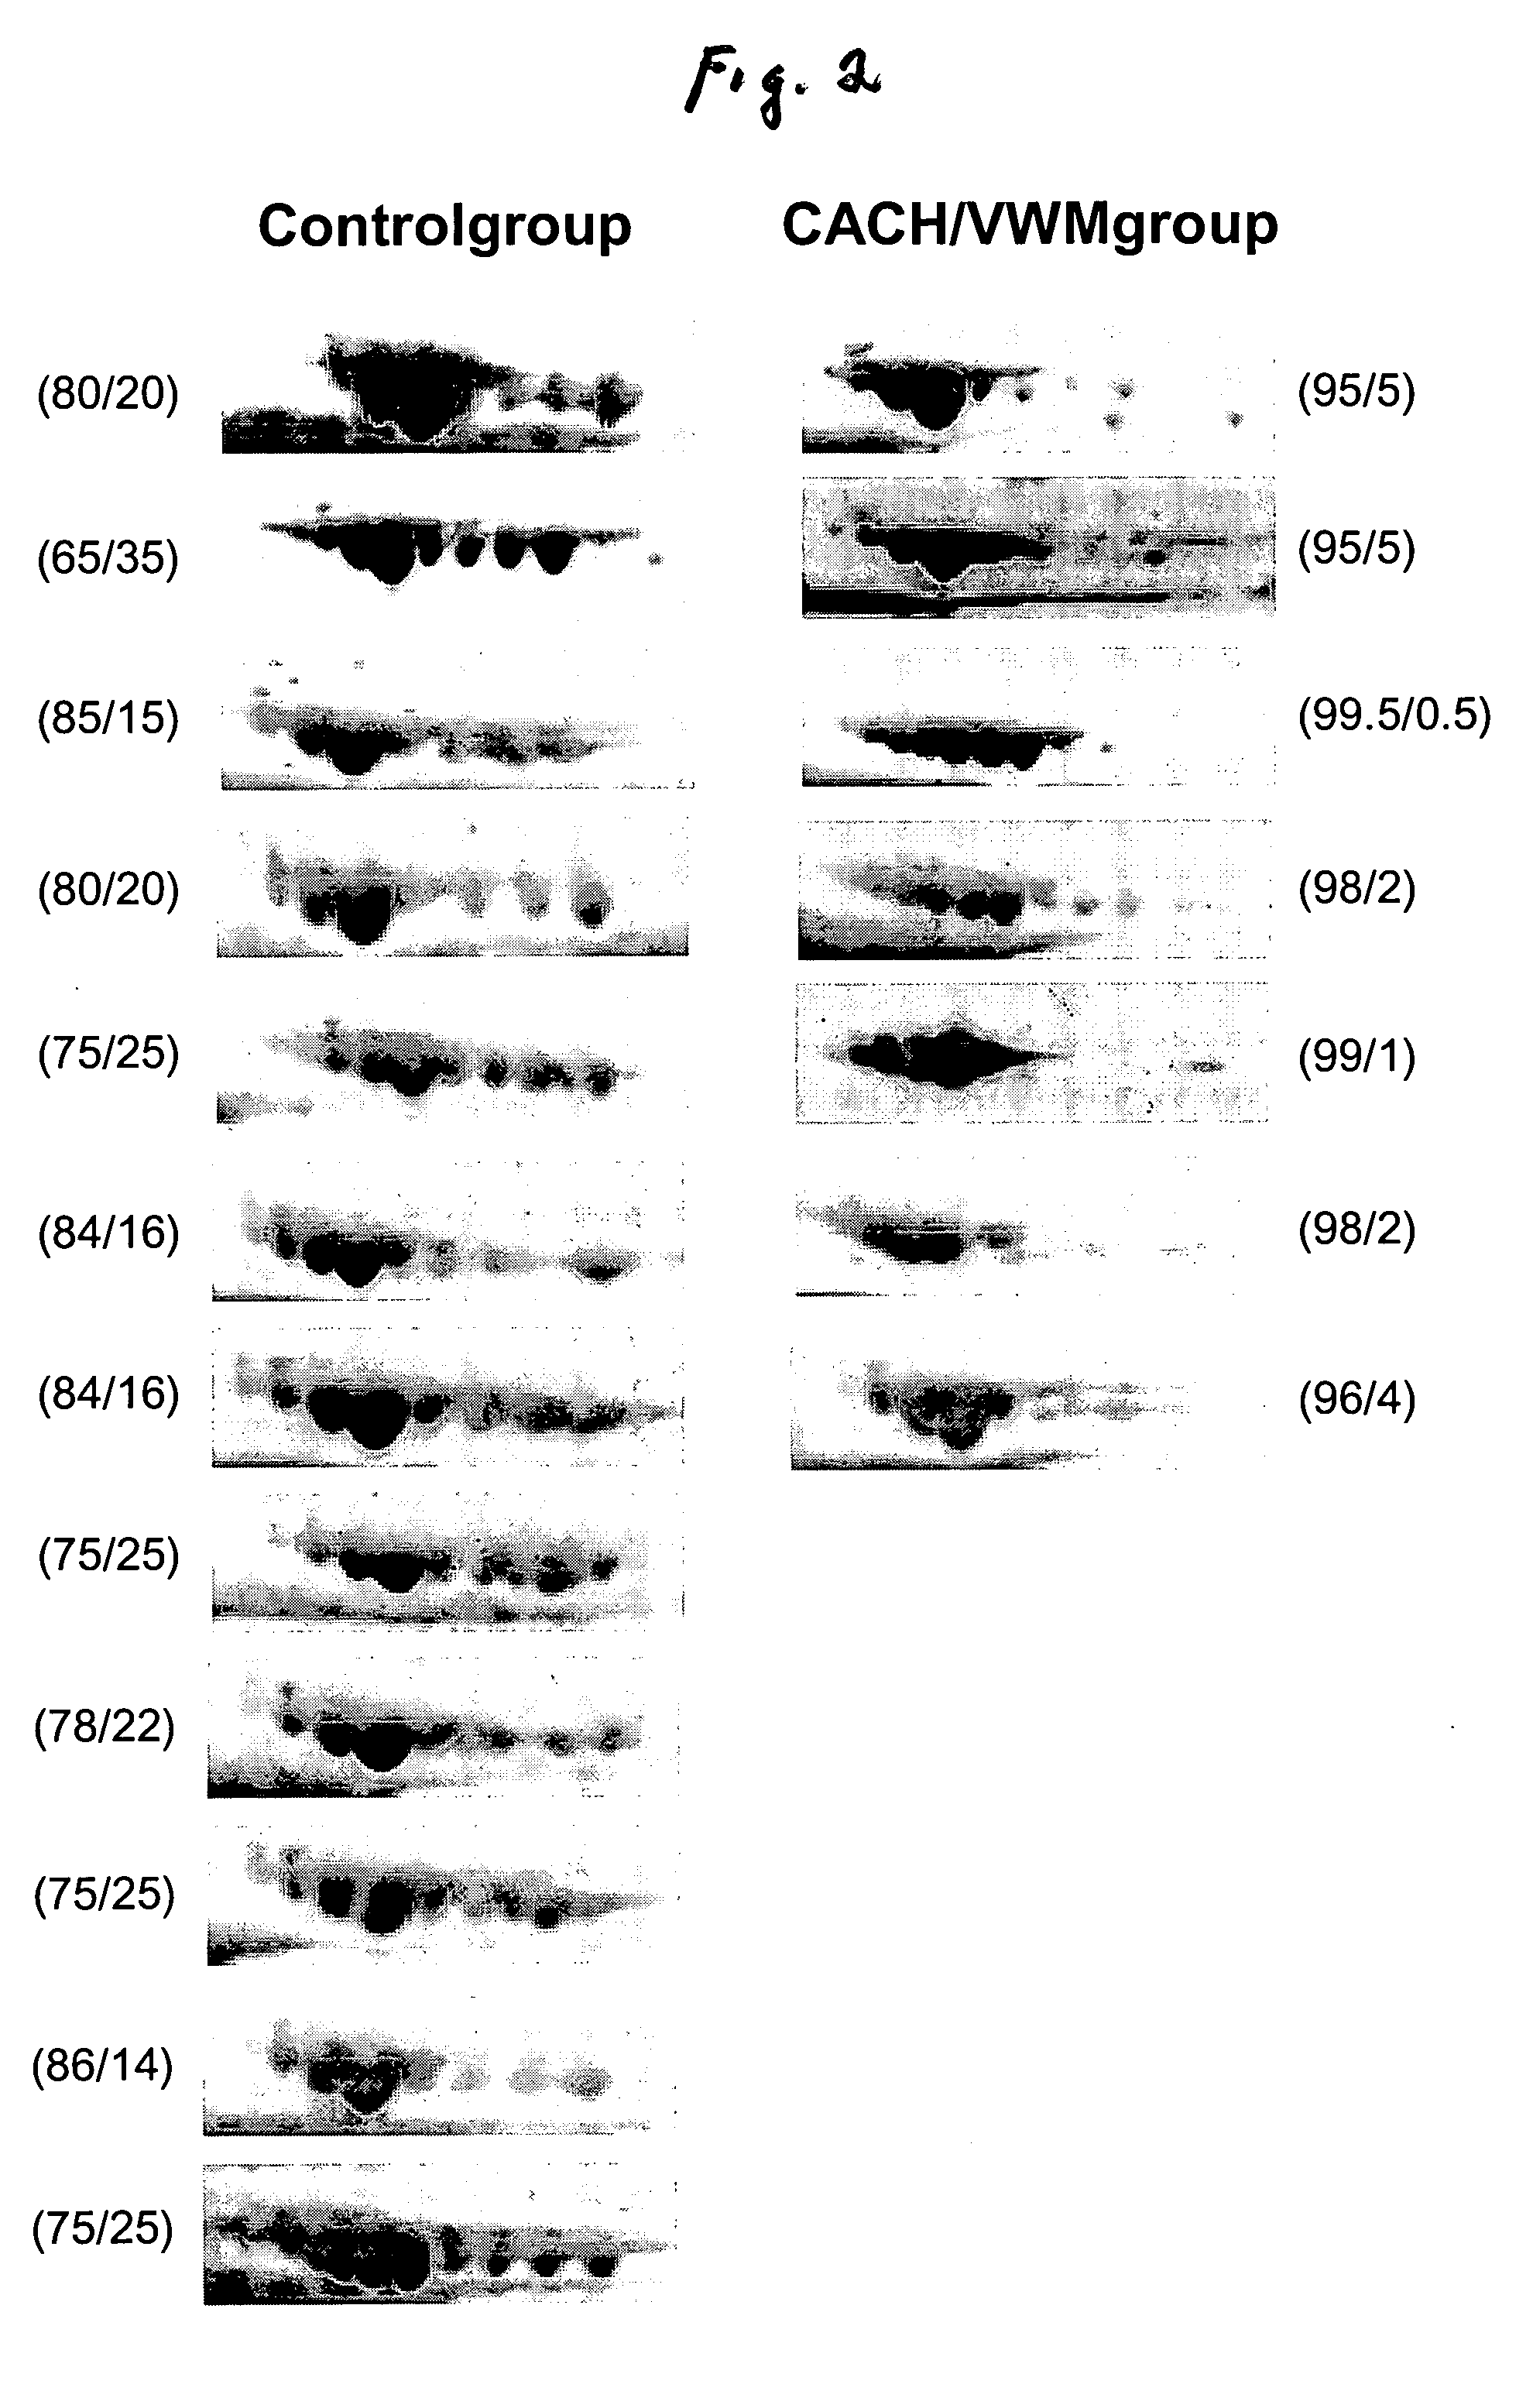
[0028] Analysis of the 2-DG spot patterns of a large number of samples (7 patients and 23 controls) led to the detection of a unique pattern in CSF of CACH / VWM patients that was not present in the controls. This pattern consisted of a variation in the composition of transferrin isoforms from CACH / VWM patients versus controls: while the latter provided 6-8 spots of transferrin with pls ranging from 5.5 to 6.5, the former showed a greater intensity of spots with more acidic pl's (i.e., pl=5.5-6) and a lower intensity of spots with more basic pl's (pl=6-6.5) than the controls (FIG. 1). These two different patterns were reproduced among all samples from control and CACH / VWM patients respectively (FIG. 2). In all patient samples there was a great reduction in the basic transferrin spots when compared to that of controls. The number of samples analyzed was sufficient to exclude the possibility that the observed differences between 7 CACH / VWM and 23 cont...
example 2
Characterization of Gel Separated Transferrin Isoforms
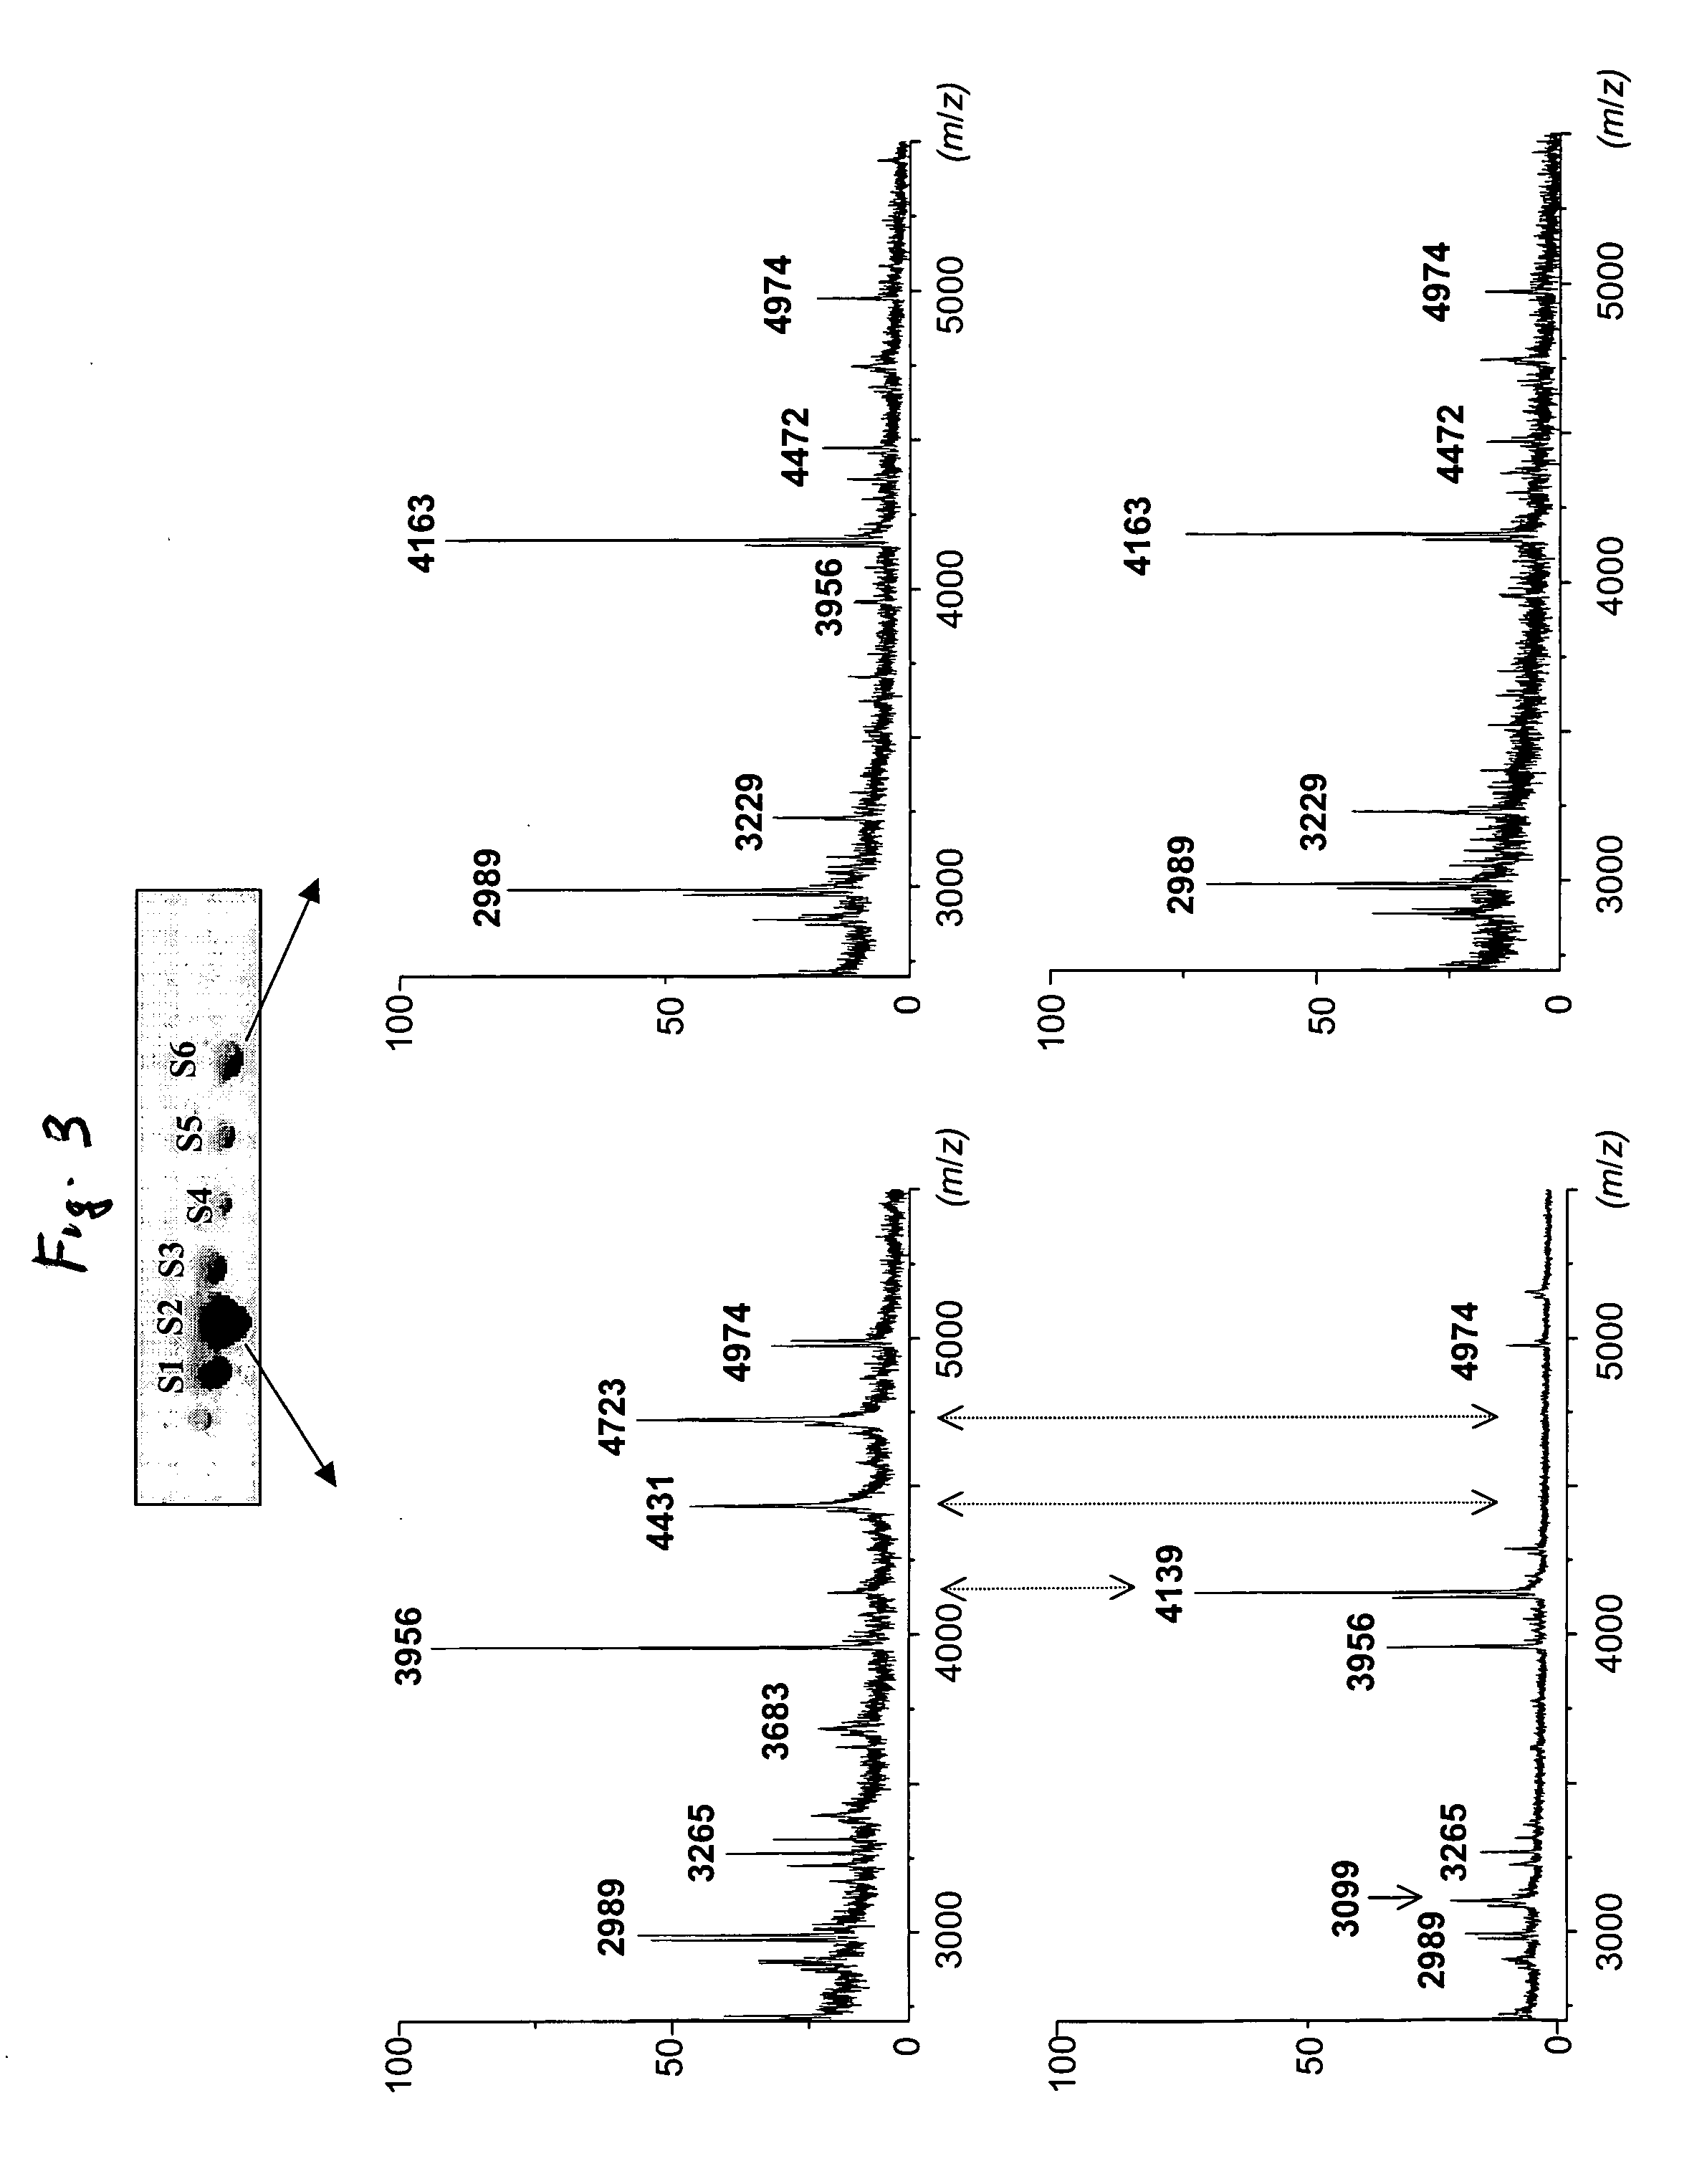
[0029] The isolated transferrin isoforms were subsequently analyzed by using a well-established mass fingerprinting strategy (Jensen, ON above). Tryptic peptides generated by in-gel digestion of the different spots were shown to cover ˜69% of the protein sequence by reflectron MALDITOF-TOF analysis (Table 1). However, examining the detected peptides versus the known sequence of human transferrin (Swiss-Prot accession number P02787) revealed that the maps of both acidic and basic isoforms were missing regions encompassing the known glycosylation sites (Asn432 and Asn630) (Table 1). Switching the detection mode from reflectron TOF-TOF to linear TOF afforded detection of a greater number of peaks with higher mass (FIG. 3), which we presumed could include extensive carbohydrate structures. These experiments differentiated two groups of isoforms corresponding to either the acidic spots S1, S2, S3, or to the basic S4, S5 and S6 (FIG. ...
example 3
p EXAMPLE 3
Structural Characterization of the Glycopeptides Generated from Gel Separated Transferrin Isoforms.
[0030] Mass measurements were obtained by nanospray-FTMS analysis for each of the glycopeptides of interest (FIG. 4). Multiply charged signals were readily observed for the sialo-form at m / z 1573.97 (3+), 1466.38 (4+), 1434.61 (4+), 1227.24 (3+), and 1180.72 (4+). No corresponding signals were detected for possible products generated by the asialo-form(as determined by neuraminidase treatment). On the other hand, species at m / z 1388.23 (3+)and 1347.08 (2+) were observed only for the asialo-form, but not for the sialo-form. The observed monoisotopic molecular masses obtained from these signals were used in GlycoMod Tool http: / / us.expasy.org / tools / glycomod / ) to predict the putative structure of the corresponding glycopeptides (Table 2). A mass accuracy of 10 ppm or better allowed us to minimize the incidence of possible false positive identification.
[0031] These data suggest...
PUM
 Abstract
Description
Claims
Application Information
 - R&D
- Intellectual Property
- Life Sciences
- Materials
- Tech Scout
- Unparalleled Data Quality
- Higher Quality Content
- 60% Fewer Hallucinations
Browse by: Latest US Patents, China's latest patents, Technical Efficacy Thesaurus, Application Domain, Technology Topic, Popular Technical Reports.
© 2025 PatSnap. All rights reserved.Legal|Privacy policy|Modern Slavery Act Transparency Statement|Sitemap|About US| Contact US: help@patsnap.com


