Methods of rapidly simulating in-service warp distortion of a wood product and/or rapidly estimating shrinkage properties using electromagnetic energy

a technology of in-service warp distortion and electromagnetic energy, which is applied in the direction of mechanical measuring arrangements, instruments, and mechanical means, etc., can solve the problems of intolerant wood product applications to significant dimensional changes, inability to tolerate significant dimensional changes in thickness, width, length, interference problems,

Active Publication Date: 2007-06-21
WEYERHAEUSER NR CO
View PDF8 Cites 24 Cited by
  • Summary
  • Abstract
  • Description
  • Claims
  • Application Information

AI Technical Summary

Problems solved by technology

It is generally recognized that softwood lumber will continue to lose market share unless the industry improves the in-service warp stability of its product.
Some wood product applications are intolerant of significant dimensional change (thickness, width, length) after the product is put in service.
For example, instability of thickness or width dimensions can cause interference problems for tight-tolerance applications, such as doors and windows.
Length instability of wood used in truss chords can result in a problem known as truss uplift; where the truss can raise above interior wall plates forming a gap between the ceiling and interior wall.
Unfortunately, the straightness and dimension of a piece are not static and can change after the piece is graded.
This moisture change results in changes in both dimension and warp properties.
Any piece of lumber is prone to develop additional “in-service” warp if a) its shrinkage properties are not uniform and it changes moisture or b) its moisture content is not uniform at the point the original grade was assigned.
Although these methods can be used to estimate the average thickness and width shrinkage behaviour of a species, methods for precise quantification do not exist.
There are even fewer design tools for estimating length shrinkage.
Although these studies demonstrate that spiral grain can be a useful predictor of twist stability, they generally agree that there are no reliable visual indicators of crook and bow stability.
All of these models teach that the fundamental cause of lumber warp is related to the fact that it shrinks significantly when it dries and this shrinkage is both anisotropic and highly non-uniform.
Prediction of warp stability of a wood product is made even more difficult by the fact that its moisture content changes with the vapour pressure of the surrounding environment and this “equilibrium moisture” can be highly variable between two locations within a piece depending on the chemistry and fibre differences between those two locations.
Although much is known about equilibrium moisture and shrinkage behaviour of wood, there are as yet no comprehensive theoretical models and no methods of monitoring these properties in a real time production environment.
Unfortunately, none of the individual methods described above are accurate enough to give adequate estimates of the dimensional stability of a single piece of lumber.

Method used


Image

  • Methods of rapidly simulating in-service warp distortion of a wood product and/or rapidly estimating shrinkage properties using electromagnetic energy
  • Methods of rapidly simulating in-service warp distortion of a wood product and/or rapidly estimating shrinkage properties using electromagnetic energy
  • Methods of rapidly simulating in-service warp distortion of a wood product and/or rapidly estimating shrinkage properties using electromagnetic energy

Examples


example 1

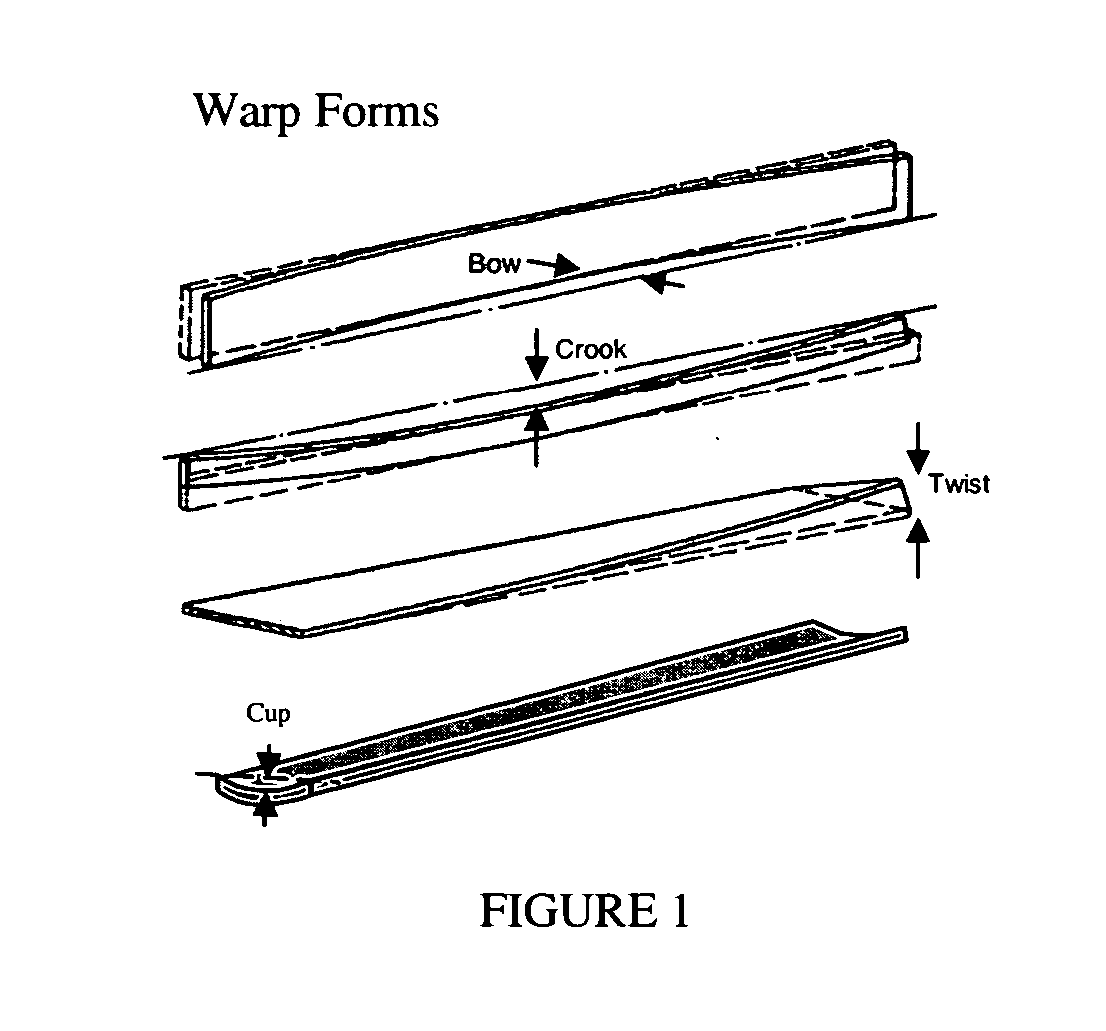
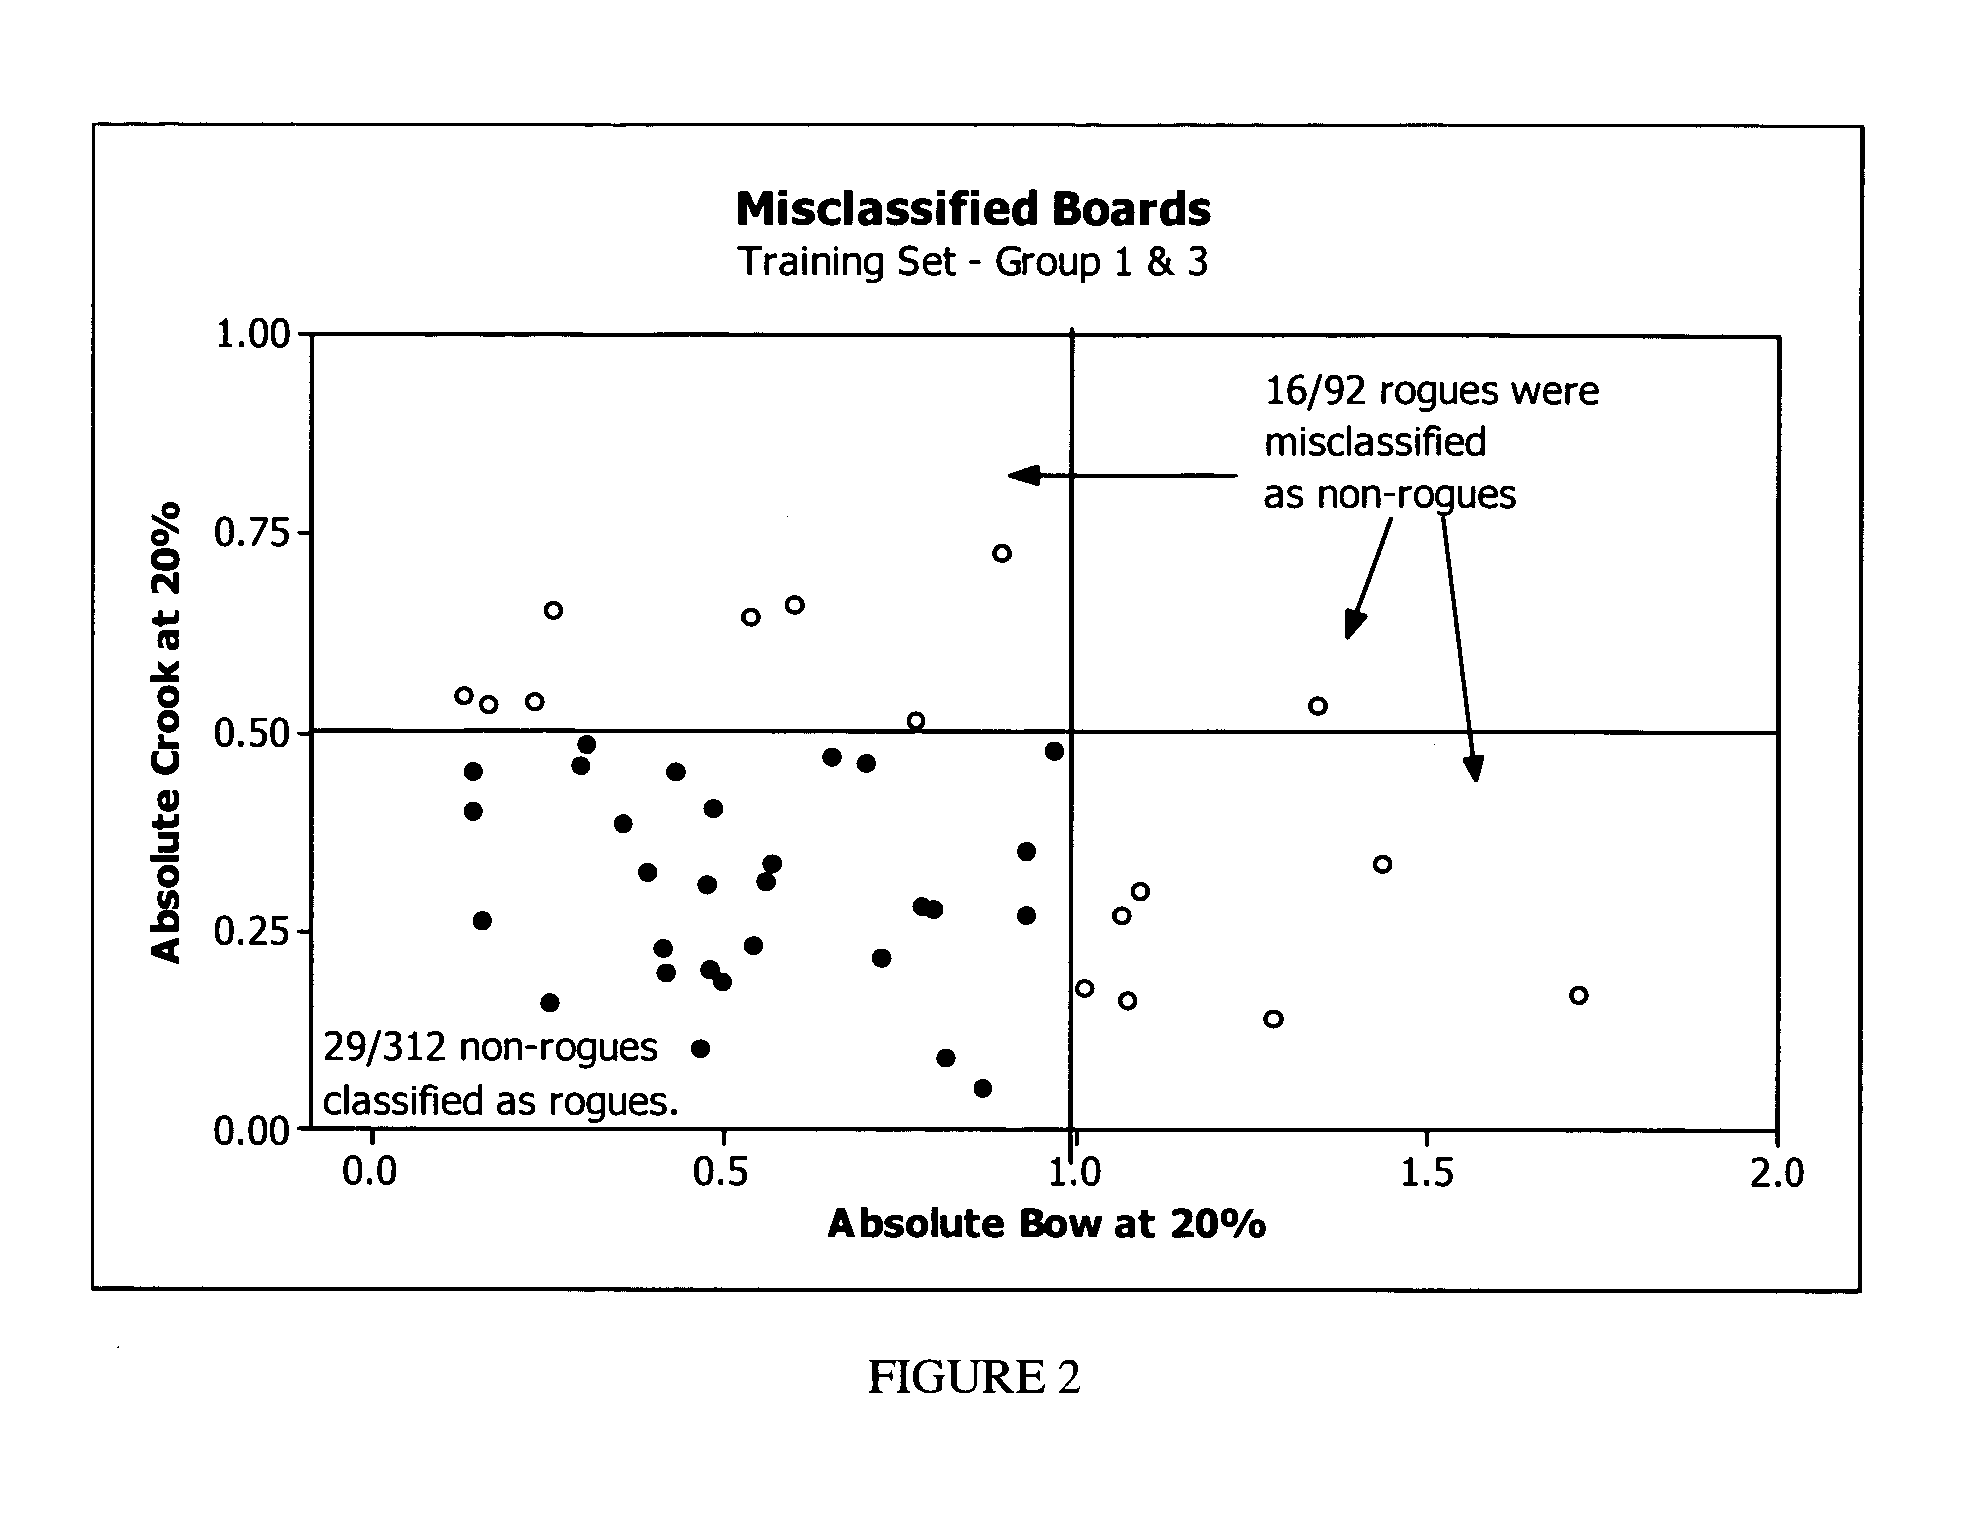
[0049] Three groups of lumber, each containing approximately 200 8-foot long 2 inch by 4 inch boards, were obtained from a mill. Via the use of multiple sensors, each piece of lumber was measured for crook, bow, average moisture content, ultrasonic velocity and a density profile was obtained. Each piece of wood was then placed in a 20% relative humidity, or “RH” environment for 5 weeks and then measured again for crook and bow. In this example, the objective was to classify the boards into two final warp classes (at 20% RH) using the initial data from multiple sensors. The final warp classes were defined as follows: a board was classified as a “rogue” if the absolute crook at 20% RH was greater than 0.5 inches or the absolute bow at 20% RH was greater than 1.0 inches. Otherwise the board was classified as a “non-rogue”.

[0050] The initial data from lumber groups 1 and 3 were used to develop and train the classification algorithm and the initial data from boards in group 2 were used ...

example 2

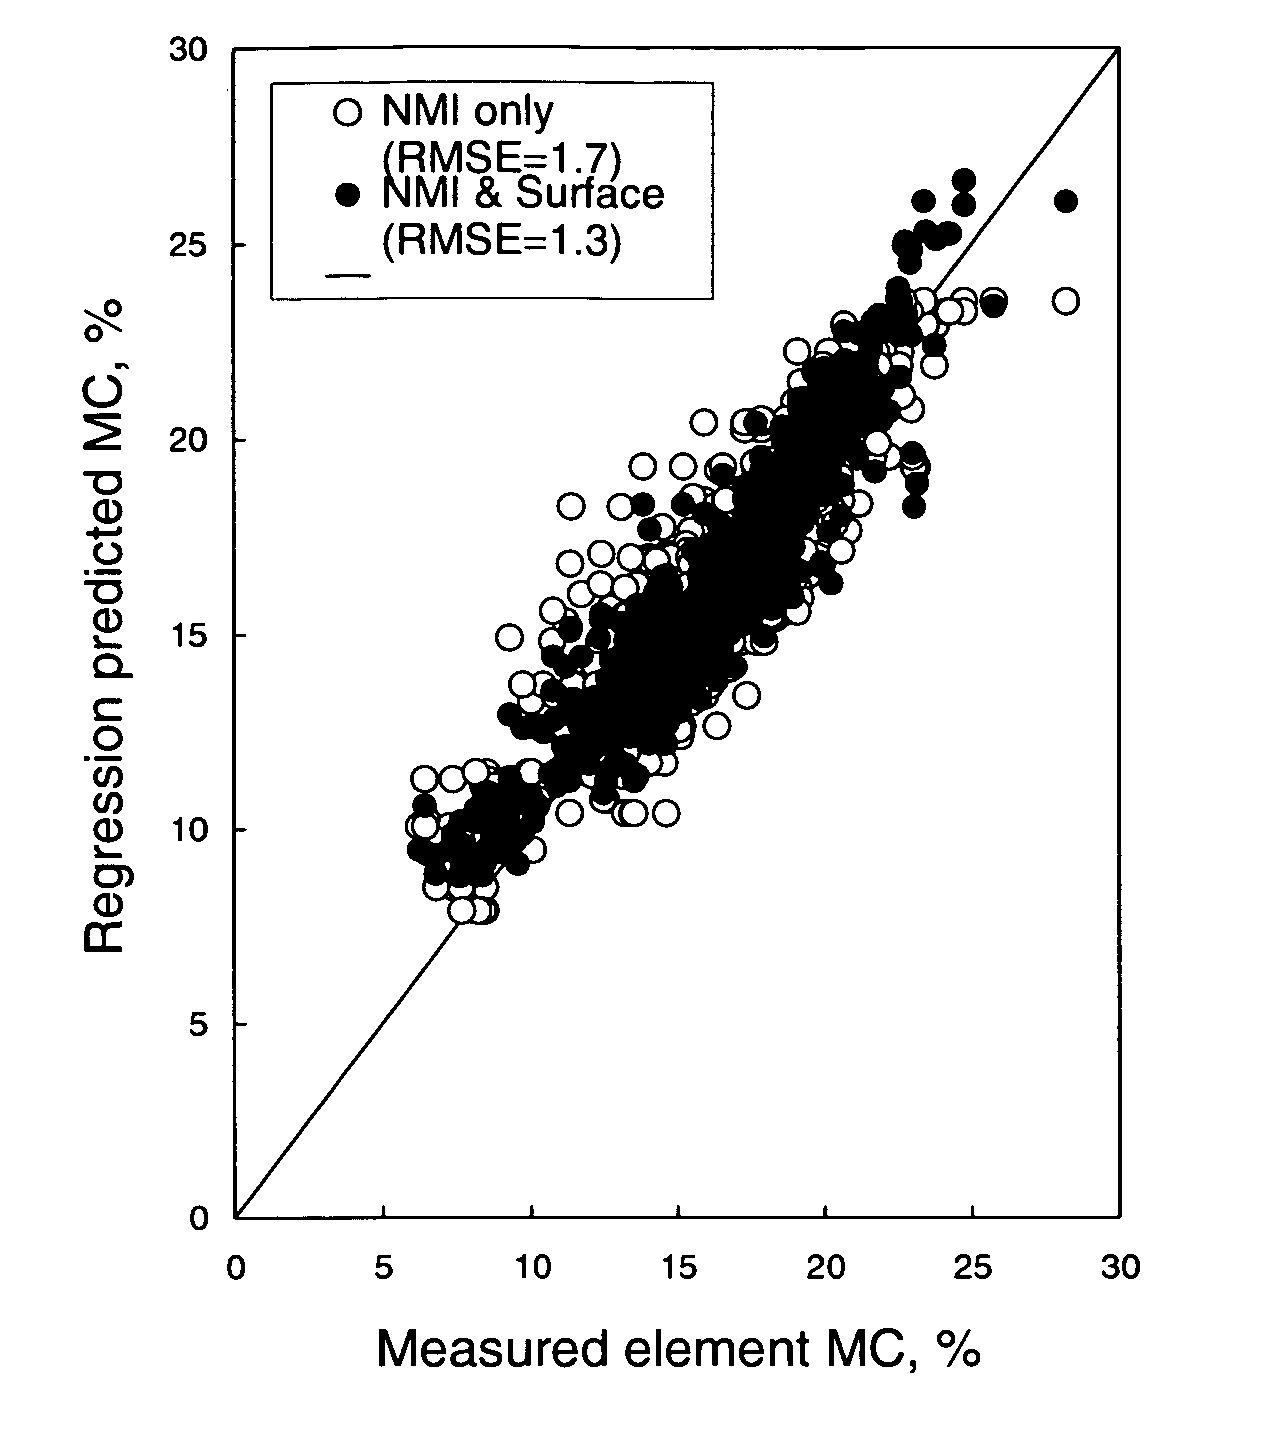
[0067] The sensor data used were “Tracheid-effect” line images and absorbance spectra obtained from near infrared (NIR) spectroscopy. (Additional information describing these two sensor technologies can be found in (Nystrom and Hagman)16 and (Williams and Norris)17 respectively). A training data set consisting of approximately 350 12″×1″×¾″ pieces of wood was used to build a shrinkage-coefficient calibration model. Each piece of wood was scanned for both Tracheid-effect images and NIR spectra. Several parameters were calculated from each Tracheid-effect image. In addition, each piece of wood was equilibrated at two different times in two different relative humidity environments—20% RH and 90% RH. Length measurements were made at each humidity condition and the moisture-induced dimensional change was recorded.

[0068] A prediction model for dimensional change was developed based on first-principle considerations using Tracheid-effect parameters and NIR spectra as inputs. The predictio...

example 3

[0073] Eighteen 2×4 cross sections were equilibrated to 20% RH and ripped into four equal coupons. The instantaneous strain of each coupon was determined from the difference in length before and after ripping. A longitudinal shrinkage rate coefficient (LSRC) was also determined for each coupon. Two pairs of coupons on either side of centerline were reviewed. Data from these pairs was analyzed to determine whether predicted LSRC differences (based on methods described earlier) could be used to identify pairs having high instantaneous strain difference (i.e. sections likely to distort during a ripping operation.)

[0074] Results are shown in FIG. 21. The test demonstrated that LSRC estimates can indeed be used to identify pieces of lumber that likely contain significant internal stresses and are, therefore, not candidates for a ripping operation.

[0075] The method can be applied to a board that has residual moisture gradients resulting from kiln-drying and that will subsequently change...


PUM

PropertyMeasurementUnit
frequencyaaaaaaaaaa
RHaaaaaaaaaa
RHaaaaaaaaaa

Abstract

Methods are provided for rapidly simulating “in-service” warp distortion of a wood product. Methods are also provided for rapidly estimating shrinkage properties of a wood product by using electromagnetic energy to dry and redistribute absorbed water in the wood product.

Description

FIELD OF THE INVENTION [0001] The present invention generally relates to the use of single and multiple sensor group systems to infer qualitative and / or quantitative estimates of various properties of wood products, including dimensional stability. BACKGROUND OF THE INVENTION [0002] Wood products, such as logs, boards, other lumber products, or the like, can be graded or classified into qualitative groups by the amount of warp potential, or dimensional stability, in the product. Crook, bow, twist, and cup are examples of warp and are illustrated in FIG. 1. The groups are used to qualitatively represent the warp state at a specified ambient condition or the degree of warp instability of a wood product. The qualitative groups are typically ordinal in nature, though nominal categories may also be used. [0003] Examples of qualitative estimates of warp might be, but are not limited to, low crook, high crook, crook less than 0.5 inches but greater than 0.25 inches, medium bow, bow greater...

Claims


Application Information

Patent Timeline
Patent Type & Authority Applications(United States)
IPC IPC(8): G01N25/58G01N22/04G01N33/46
CPCG01N33/46
Inventor FLOYD, STANLEY L.HUANG, CHIH-LIN
Owner WEYERHAEUSER NR CO
Why Eureka
Try Eureka