Automated system approach to analyzing harmonic distortion in an electric power system

a technology of automatic system and electric power system, applied in the direction of noise figure or signal-to-noise ratio measurement, ac network to reduce harmonics/ripples, instruments, etc., can solve the problems of cumbersome and expensive monitoring of electrical power distribution systems, the amount of data to be analysed and the context of data

Active Publication Date: 2007-08-02
SQUARE D CO
View PDF6 Cites 61 Cited by
  • Summary
  • Abstract
  • Description
  • Claims
  • Application Information

AI Technical Summary

Problems solved by technology

Unfortunately, those responsible for evaluating data from monitoring devices are now overwhelmed by information from their monitoring systems.
Effectively monitoring today's electrical power distribution systems is cumbersome, expensive, and inefficient.
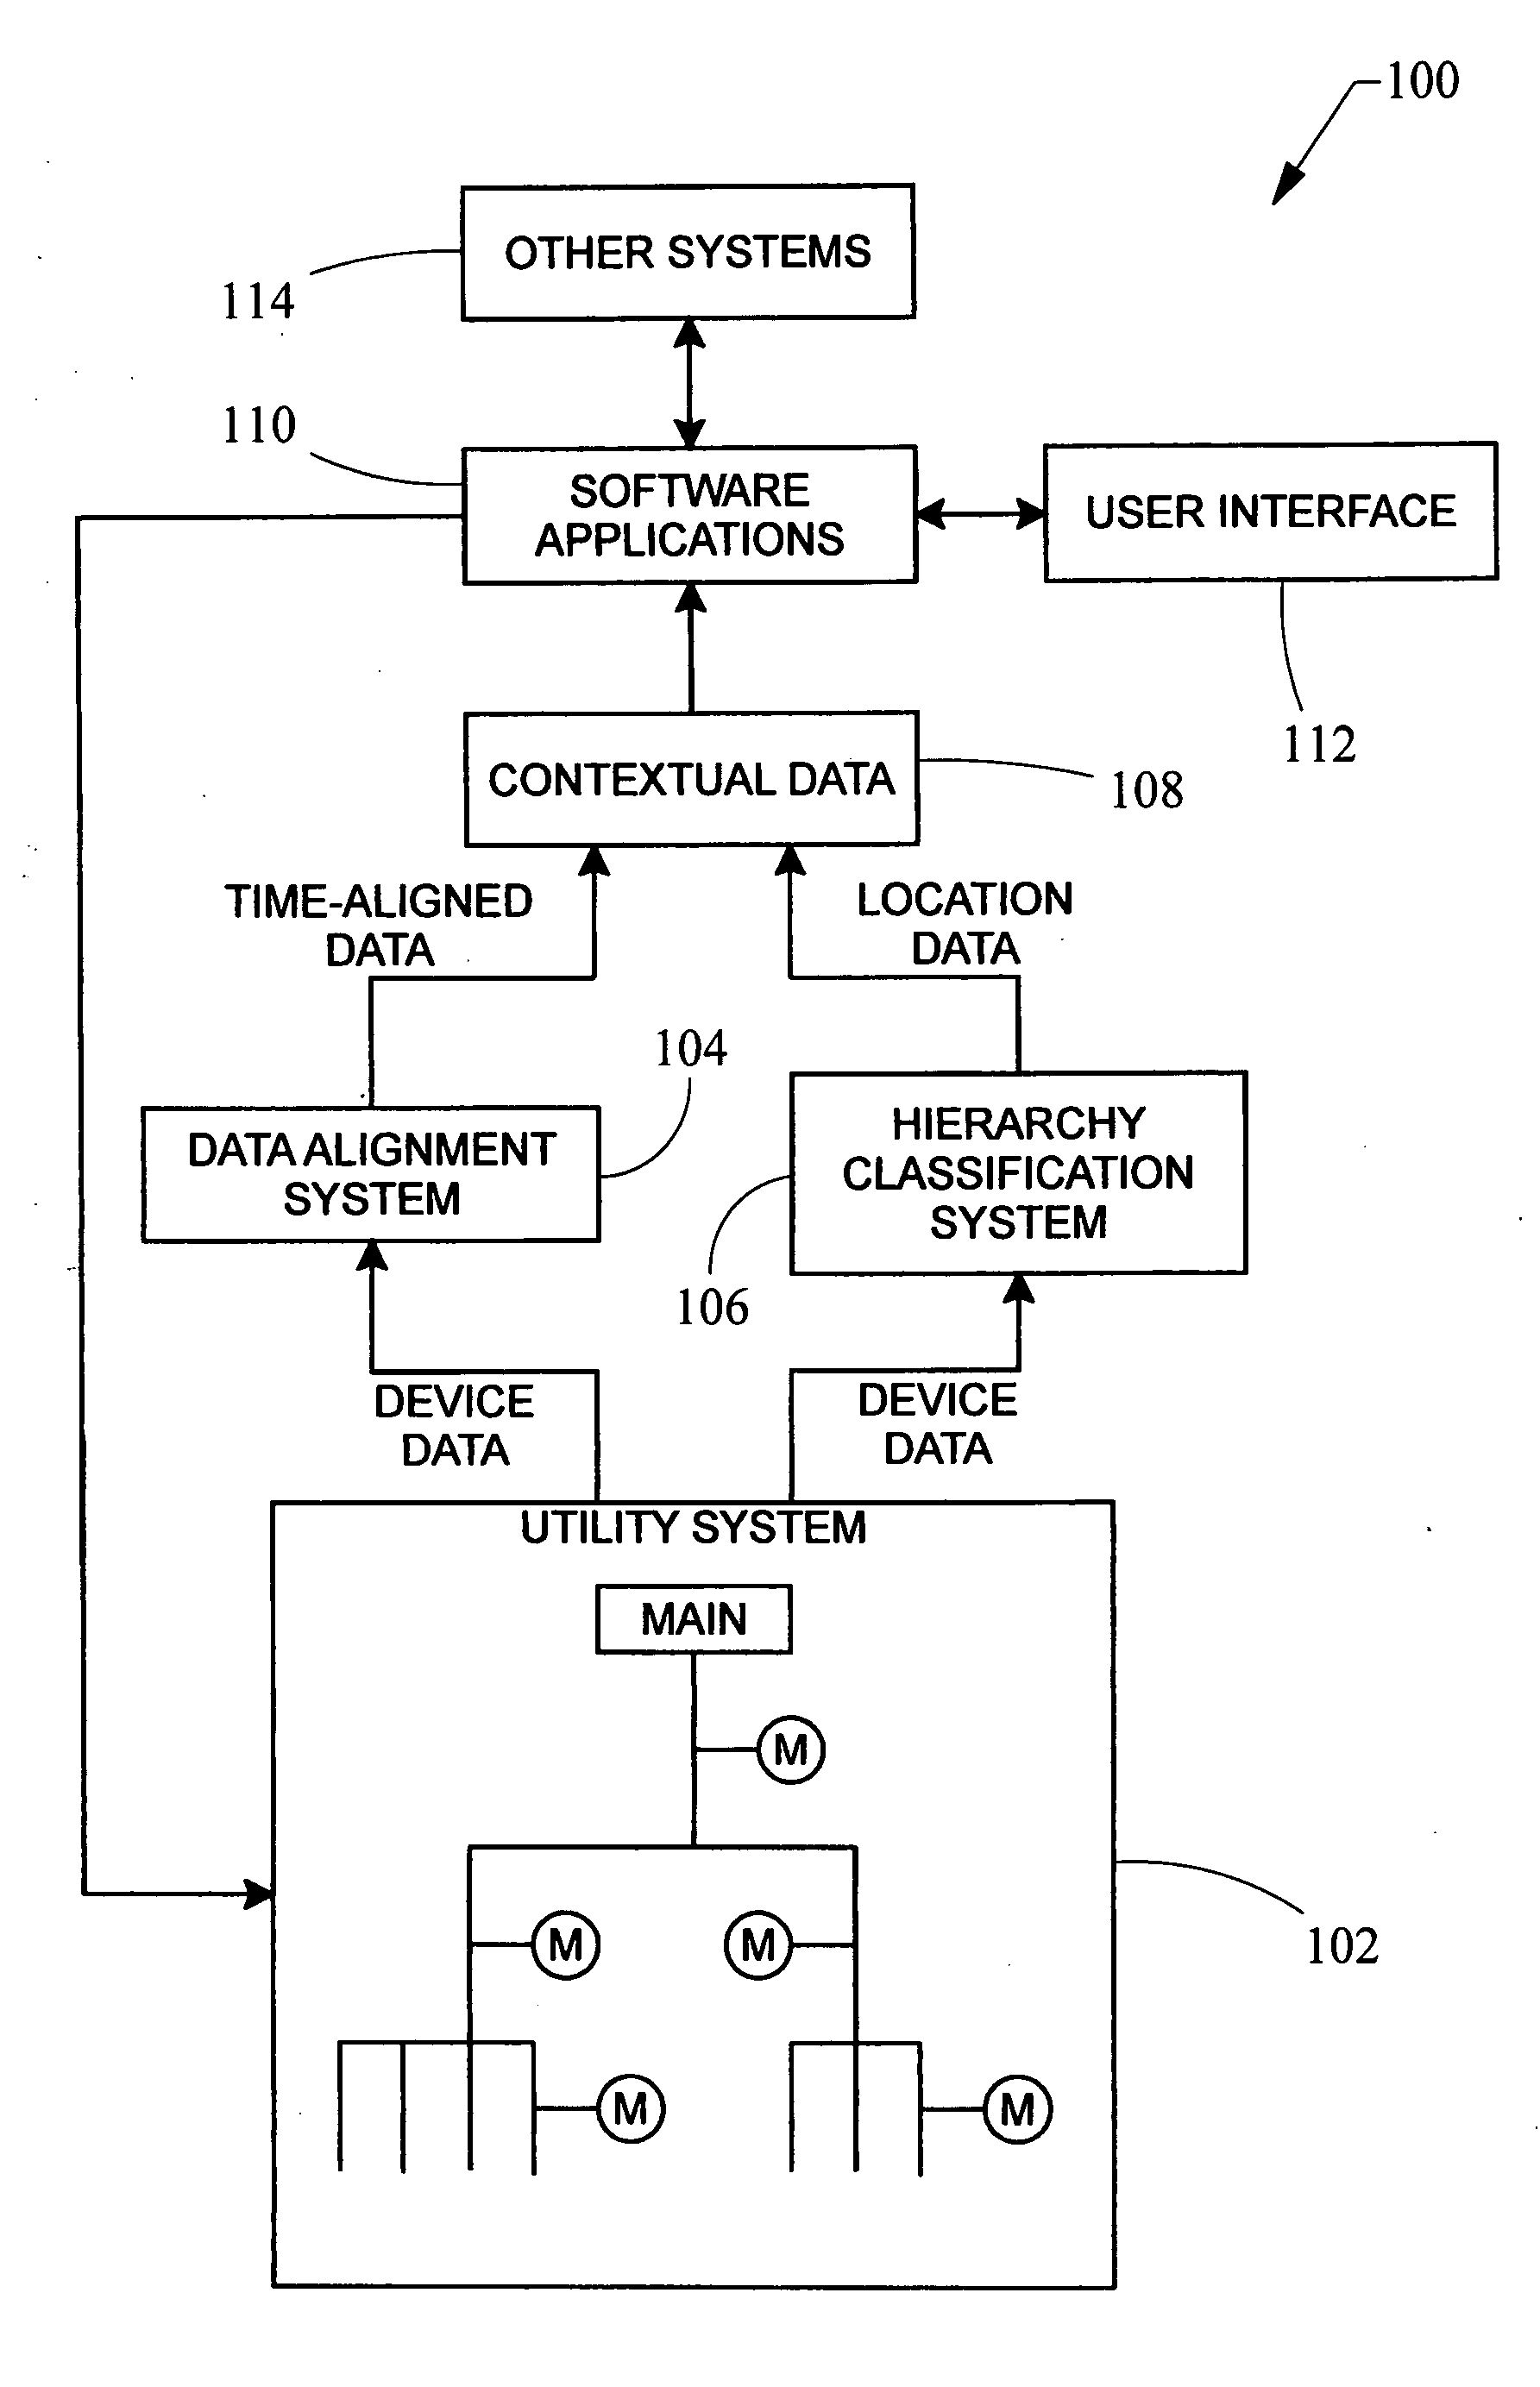
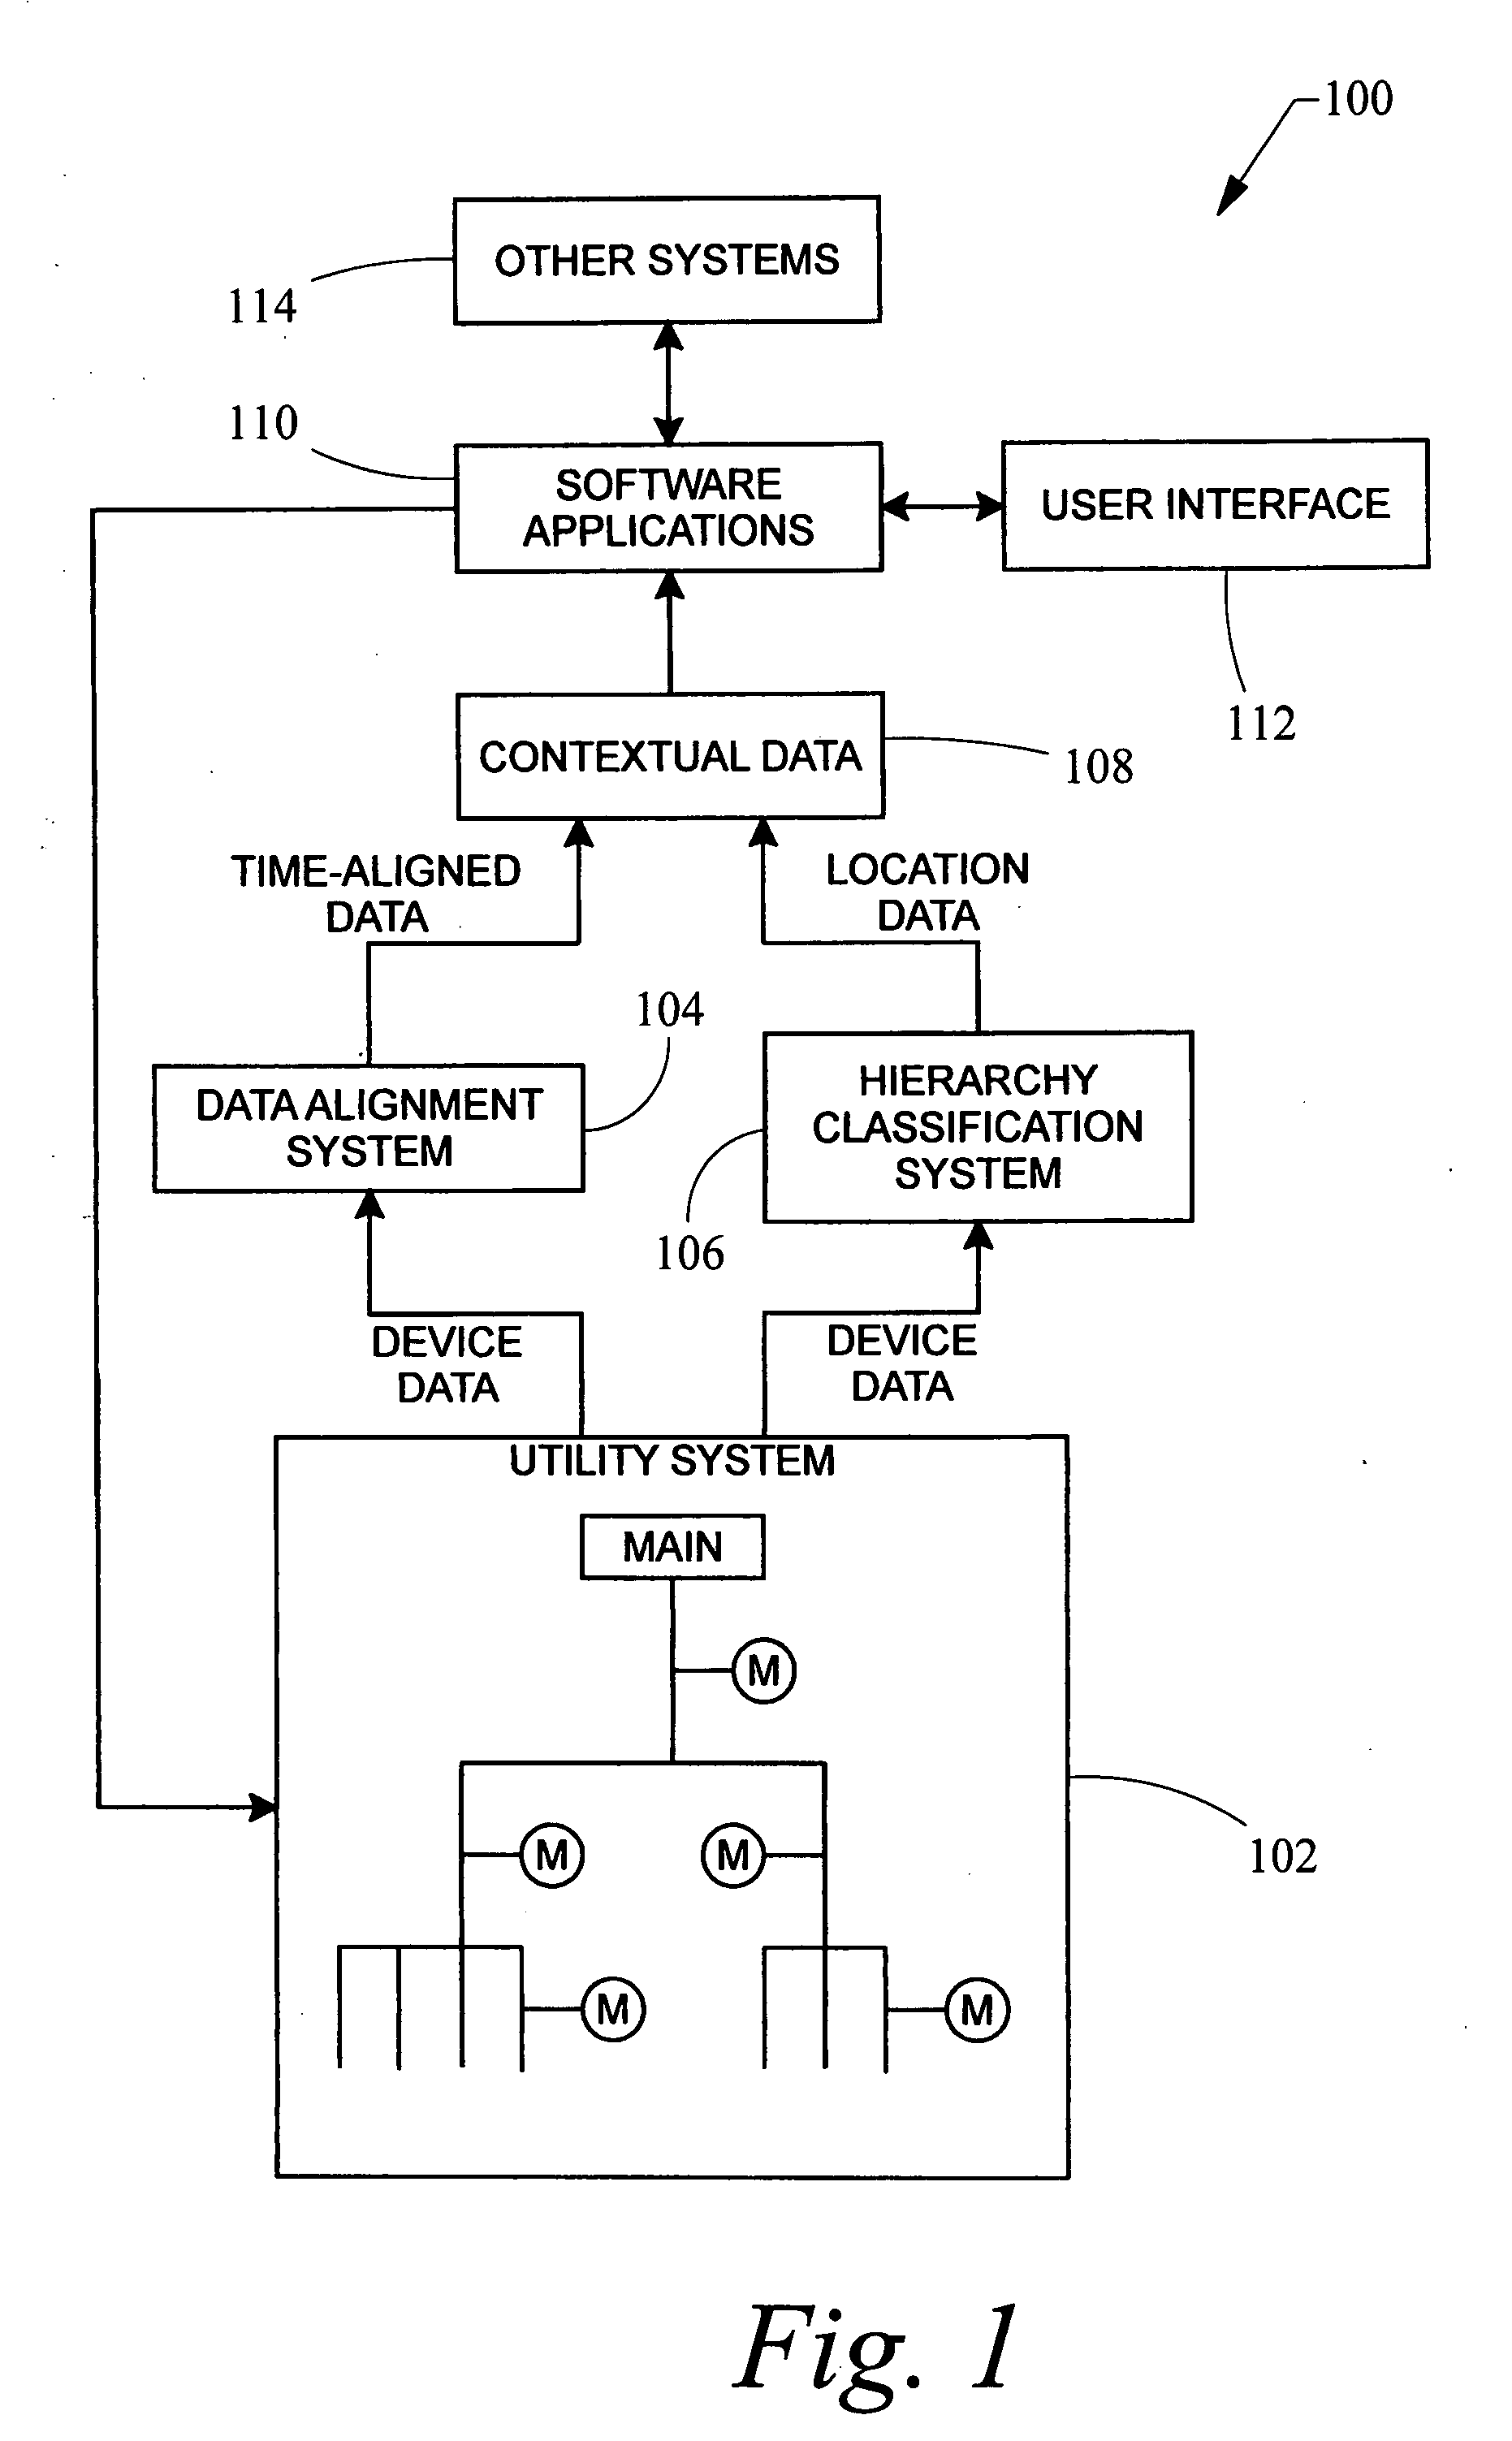
There are two problems here: the amount of data to be analyzed and the context of the data.
Accordingly, the data transmitted to the system computer from each monitoring device is often misaligned in that data from each monitoring device on the system does not arrive at the monitoring system's computer simultaneously.
Because of the data's complexity, quantity, and relative disjointed relationship from one monitoring device to the next, manual analysis of all the data is an enormous effort that often requires experts to be hired to complete the task.
This process is tedious, complex, prone to error and oversight, and time-consuming.
And this solution still requires the evaluation of large amounts of data because the system is only temporally in context; not spatially in context.
Synchronizing data using GPS systems is also disadvantageous because of time delays associated with other hardware in the system.
Furthermore, any alignment of data by a GPS-based system can only be as accurate as the propagation delay of the GPS signal, which means that the data still may not be optimally aligned when a GPS system is used.
The addition of supplemental monitoring devices in the electrical system does nothing more than generate more information about the electrical system at the point where the meter is added in the electrical system, increasing complexity without any benefit.
Any usefulness of the data is generally limited to the locality of the monitoring device that was added, while even more data is amassed.
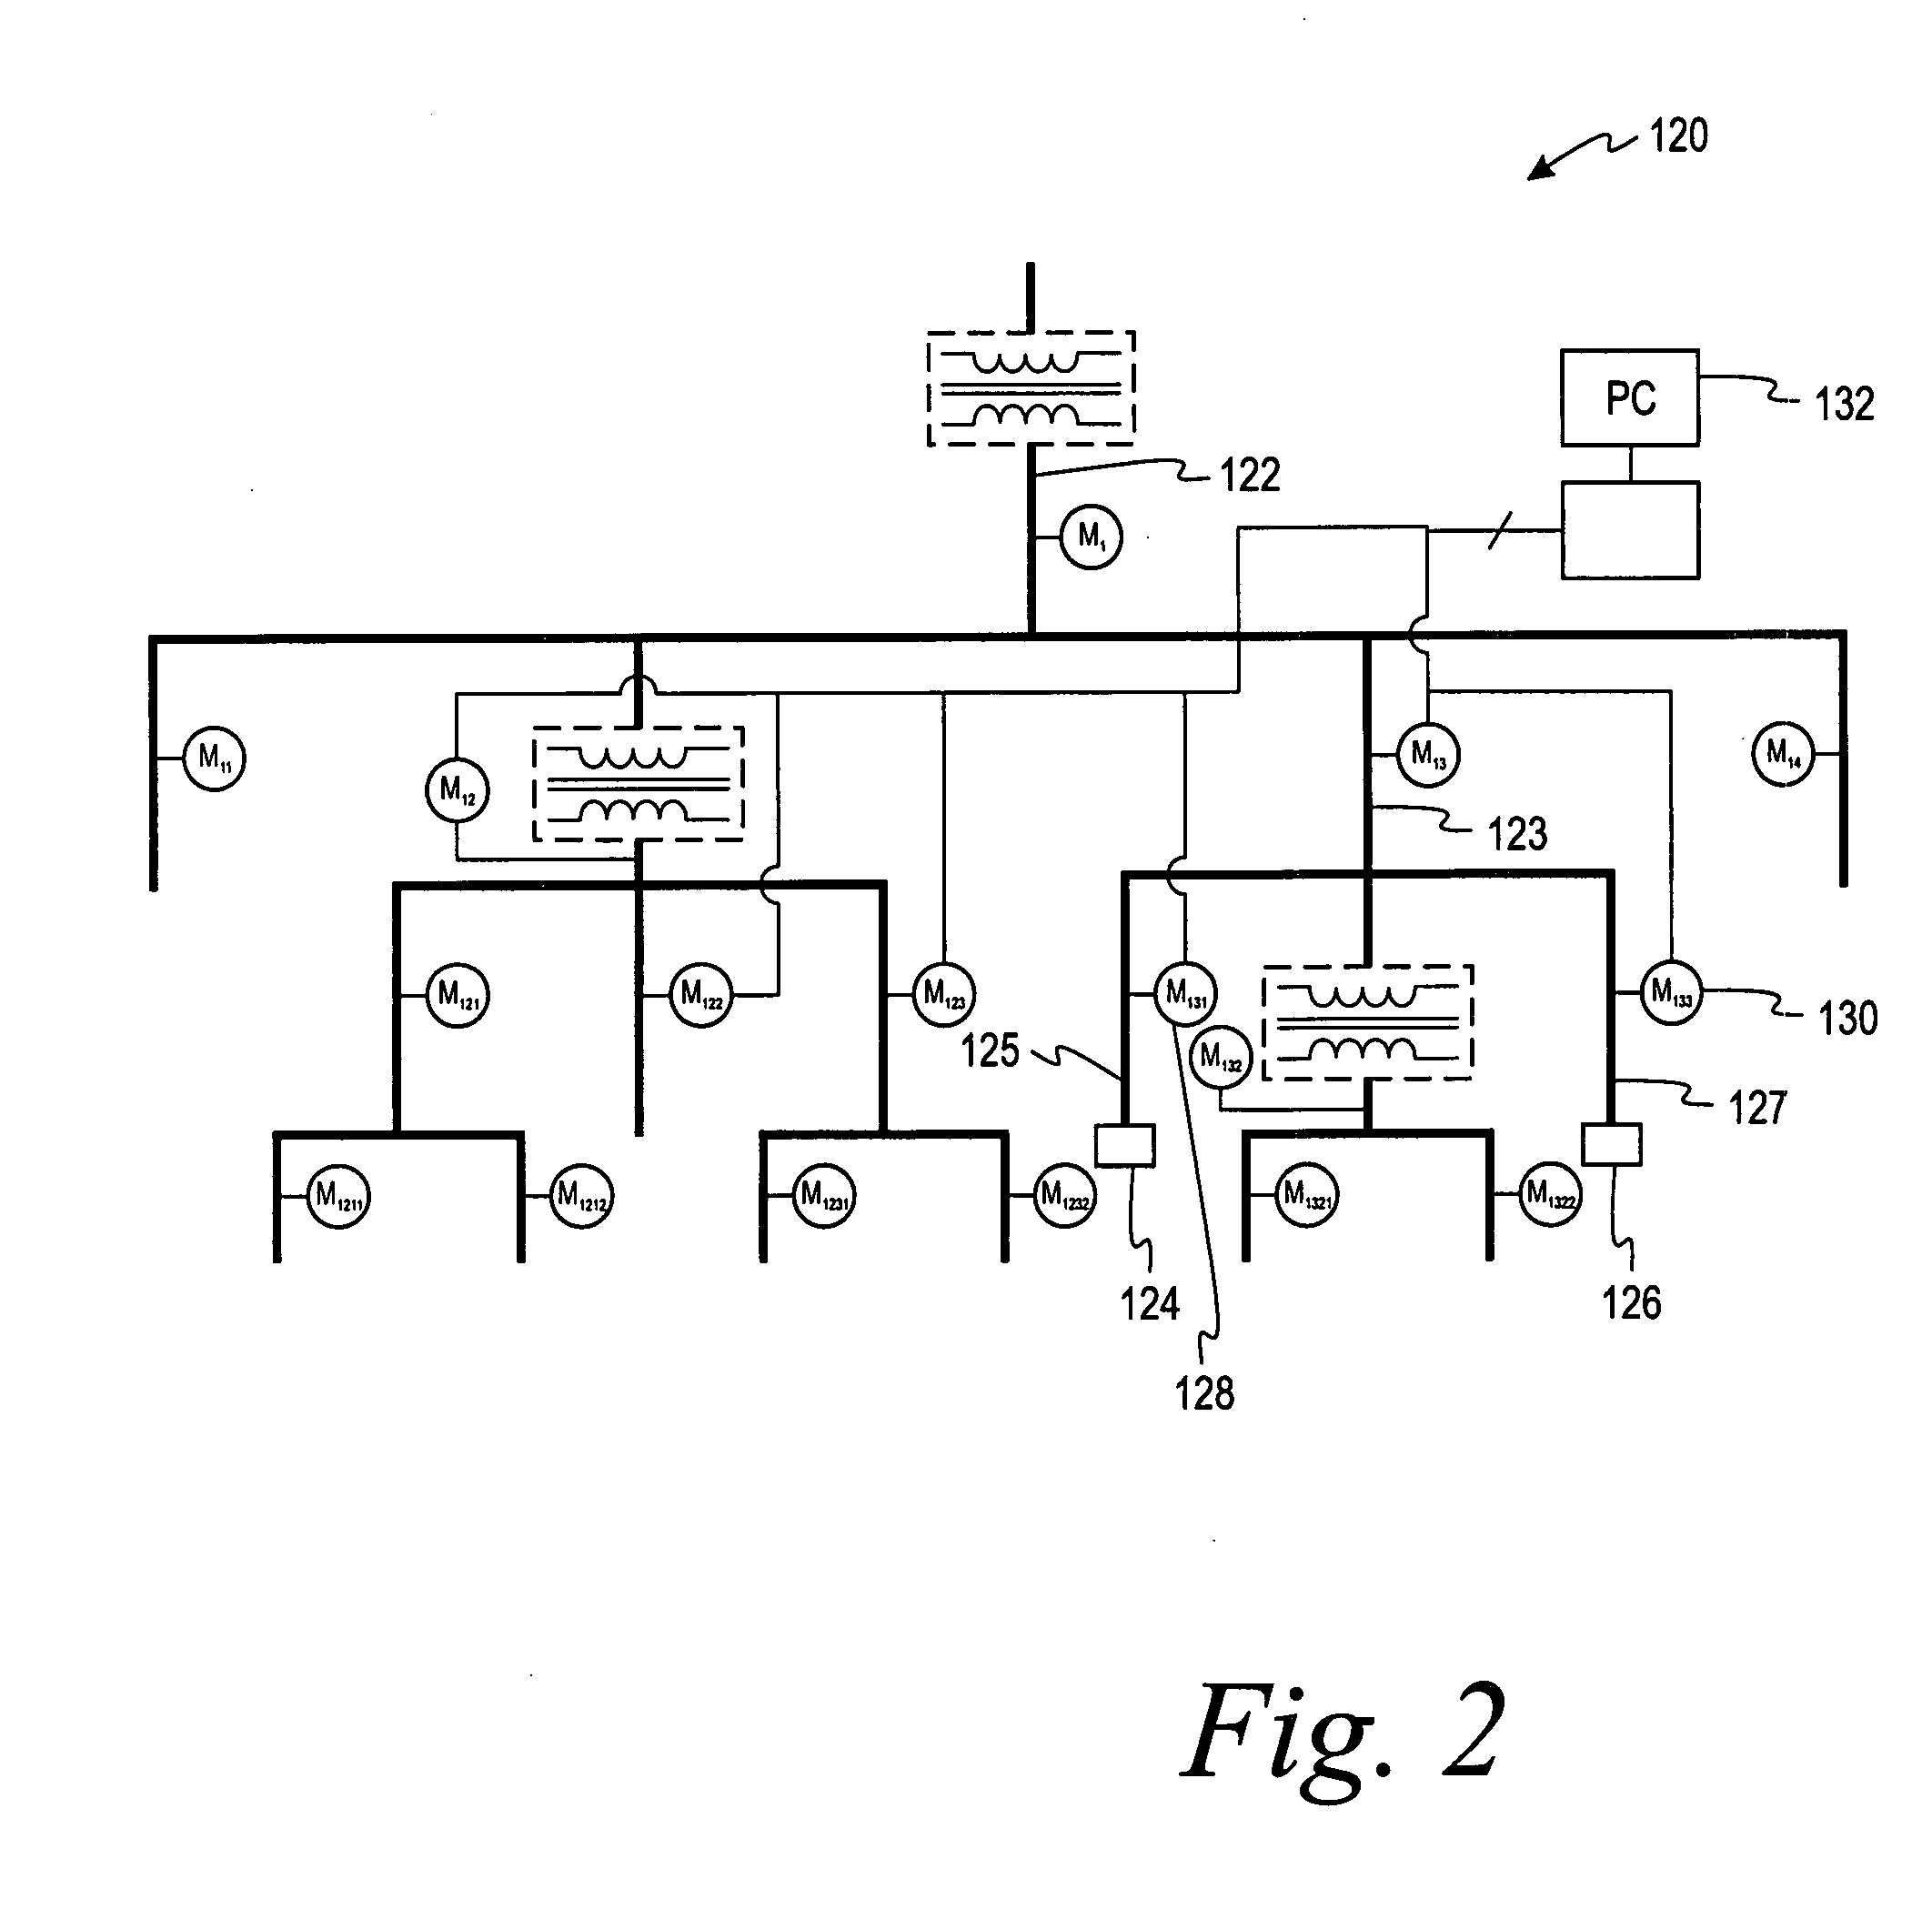
The complexity of many electrical systems usually necessitates an involved configuration process of monitoring systems because each metered point in the electrical system has different characteristics, which is why multiple monitoring devices are installed in the first place.
As a result of the enormous volume of complex data accumulated from electrical monitoring systems heretofore, a thorough analysis of the data is typically not feasible due to limited resources, time, and / or experience.
Power monitoring devices measure the electrical system's operating parameters, but do not provide information about how the parameters at different points on the power monitoring system relate to each other.
Heretofore, the only techniques for passably integrating data were complex, expensive, manually intensive, and time-consuming for the user.
These techniques also permit only limited integration of data and require additional hardware (such as GPS hardware), data lines, and supplemental monitoring device accessories.
A particular issue is the occurrence of harmonic distortion on an electrical system.
Harmonic distortion results in many potential electrical vulnerabilities including equipment misoperation, degradation, and potentially, failure.
As more and more non-linear loads are connected to the electrical grid, issues associated with harmonic distortion will substantially increase—even in facilities that were previously not susceptible to harmonic distortion.
There are various sources of harmonic distortion, most which are non-linear loads.
High-impedance sources and inadequate electrical wiring can exacerbate harmonic distortion concerns.
Because most loads are designed to operate most effectively at or near some designed nominal frequency, such loads may not operate as effectively when other frequencies are induced into the system.
A few problems that can occur as a result of harmonic distortion include lack of phase synchronization, undervoltage circuit activation, interferences, control problems, etc.
Furthermore, the measured harmonic distortion data from various meters may or may not be analyzed within a spatial context.
In any case, harmonic distortion data is not currently analyzed to take advantage of both spatial and temporal or pseudo-temporal alignment of monitoring data from multiple devices, and thus limits the useful information and analysis that may be achieved.
Such software is difficult to use and alterations are expensive and resource consuming.

Method used


Image

  • Automated system approach to analyzing harmonic distortion in an electric power system
  • Automated system approach to analyzing harmonic distortion in an electric power system
  • Automated system approach to analyzing harmonic distortion in an electric power system

Examples


Embodiment Construction

[0044] Turning now to FIG. 1, an automated data integrated monitoring system 100 is generally shown. A utility system 102 having multiple monitoring devices M provides data from each monitoring device M that is communicated to an automated data alignment system 104 and an automated hierarchy classification system 106. The data is aligned automatically in the automated data alignment system 104 in accordance with the present invention and produces data that is aligned such that it represents the data when it was actually seen simultaneously by the monitoring devices M in the utility system 102 and these terms will be used interchangeably throughout. The hierarchy classification system 106 automatically learns the hierarchy of monitoring devices present in the utility system 102 and their relationships relative to one another.

[0045] Once the data from each monitoring device M is aligned and each monitoring device's location is known, the data is said to be in context 108. The context...


PUM


Abstract

A method and system to detect and evaluate harmonic distortion in an electrical power system is disclosed. A plurality of monitoring devices is installed in the electrical power system. The hierarchy of the electrical power system is received. Data indicative of harmonic distortion on the electrical power system is received from at least two of said plurality of monitoring devices. The data indicative of harmonic distortion is automatically aligned in a temporal or pseudo-temporal context. An electrical characteristic of the harmonic distortion from the data indicative of harmonic distortion is determined.

Description

RELATED APPLICATIONS [0001] The present application is a continuation-in-part of prior U.S. patent application Ser. No. 11 / 173,743, filed Jul. 1, 2005, which is incorporated by reference in its entirety.FIELD OF THE INVENTION [0002] The present invention relates generally to utility monitoring systems, and, in particular, to automated analysis of harmonic distortion in a utility electrical system. BACKGROUND OF THE INVENTION [0003] Since the introduction of electrical power distribution systems in the late 19th century, there has been a need to monitor their operational and electrical characteristics. The ability to collect, analyze, and respond to information about the electrical power system can improve safety, minimize equipment loss, decrease scrap, and ultimately save time and money. To that end, monitoring devices were developed to measure and report such information. With the dawn of the electronics age, the quality and quantity of data from monitoring devices was vastly impr...

Claims


Application Information

Patent Timeline
Patent Type & Authority Applications(United States)
IPC IPC(8): G01R29/26G01R13/00G06F19/00
CPCG01D4/002G01R22/063Y04S20/32Y02E40/40Y02B90/241H02J3/01Y02B90/20Y04S20/30
Inventor BICKEL, JON A.
Owner SQUARE D CO
Why Eureka
Try Eureka