Predictors of patient response to treatment with egf receptor inhibitors

a technology of egf receptor and patient response, applied in the field of patient response to treatment with egf receptor inhibitors, can solve the problems of high toxicity, delay in treatment, incurring unnecessary expense, etc., and achieve the effect of increasing normalized expression levels

Active Publication Date: 2009-12-03
GENOMIC HEALTH INC +1
View PDF11 Cites 22 Cited by
  • Summary
  • Abstract
  • Description
  • Claims
  • Application Information

AI Technical Summary

Benefits of technology

[0008]The disclosure provides methods for predicting a likelihood that a human patient with a KRAS-negative, EGFR-expressing cancer will exhibit a beneficial response to an EGFR inhibitor cancer therapy based on expression levels of one or more response indicator genes in a biological sample obtained from a tumor in the patient. Specifically, the method entails measuring an expression level of at least one response indicator gene, or its expression product, selected from a group consisting of EGF, ADAM17, PTP4A3, ADAM15, QPRT, SATB2, RASSF1, VAV3, CEACAM6, EREG, AREG, TITF1, SORBS1, C13orf18, CKMT2, BTC, ATP5E, B.Catenin, CCNE1, EGFR, Bclx, BRCA1, CDC25B, CHN2, ID1, SLC26A3, VDAC2, SERPINB1, PHLDA1, ANXA2P2, KRT17, EPHA2, DUSP4, CGA, CA9, Maspin, NEDD8, DUSP6, GPC3, NT5E, VIL2, and P14ARF. The expression level is no

Problems solved by technology

Because cancer is characterized by rapidly proliferating cells, most cancer drugs attack rapidly dividing cells indiscriminately and, as a result, often exhibited a high degree of toxicity.
Such diagnostics would address the situations where some patients who might be

Method used


Image

  • Predictors of patient response to treatment with egf receptor inhibitors
  • Predictors of patient response to treatment with egf receptor inhibitors
  • Predictors of patient response to treatment with egf receptor inhibitors

Examples


example 1

Identification of Markers of Response to an EGFR Inhibitor in Cancer Patients

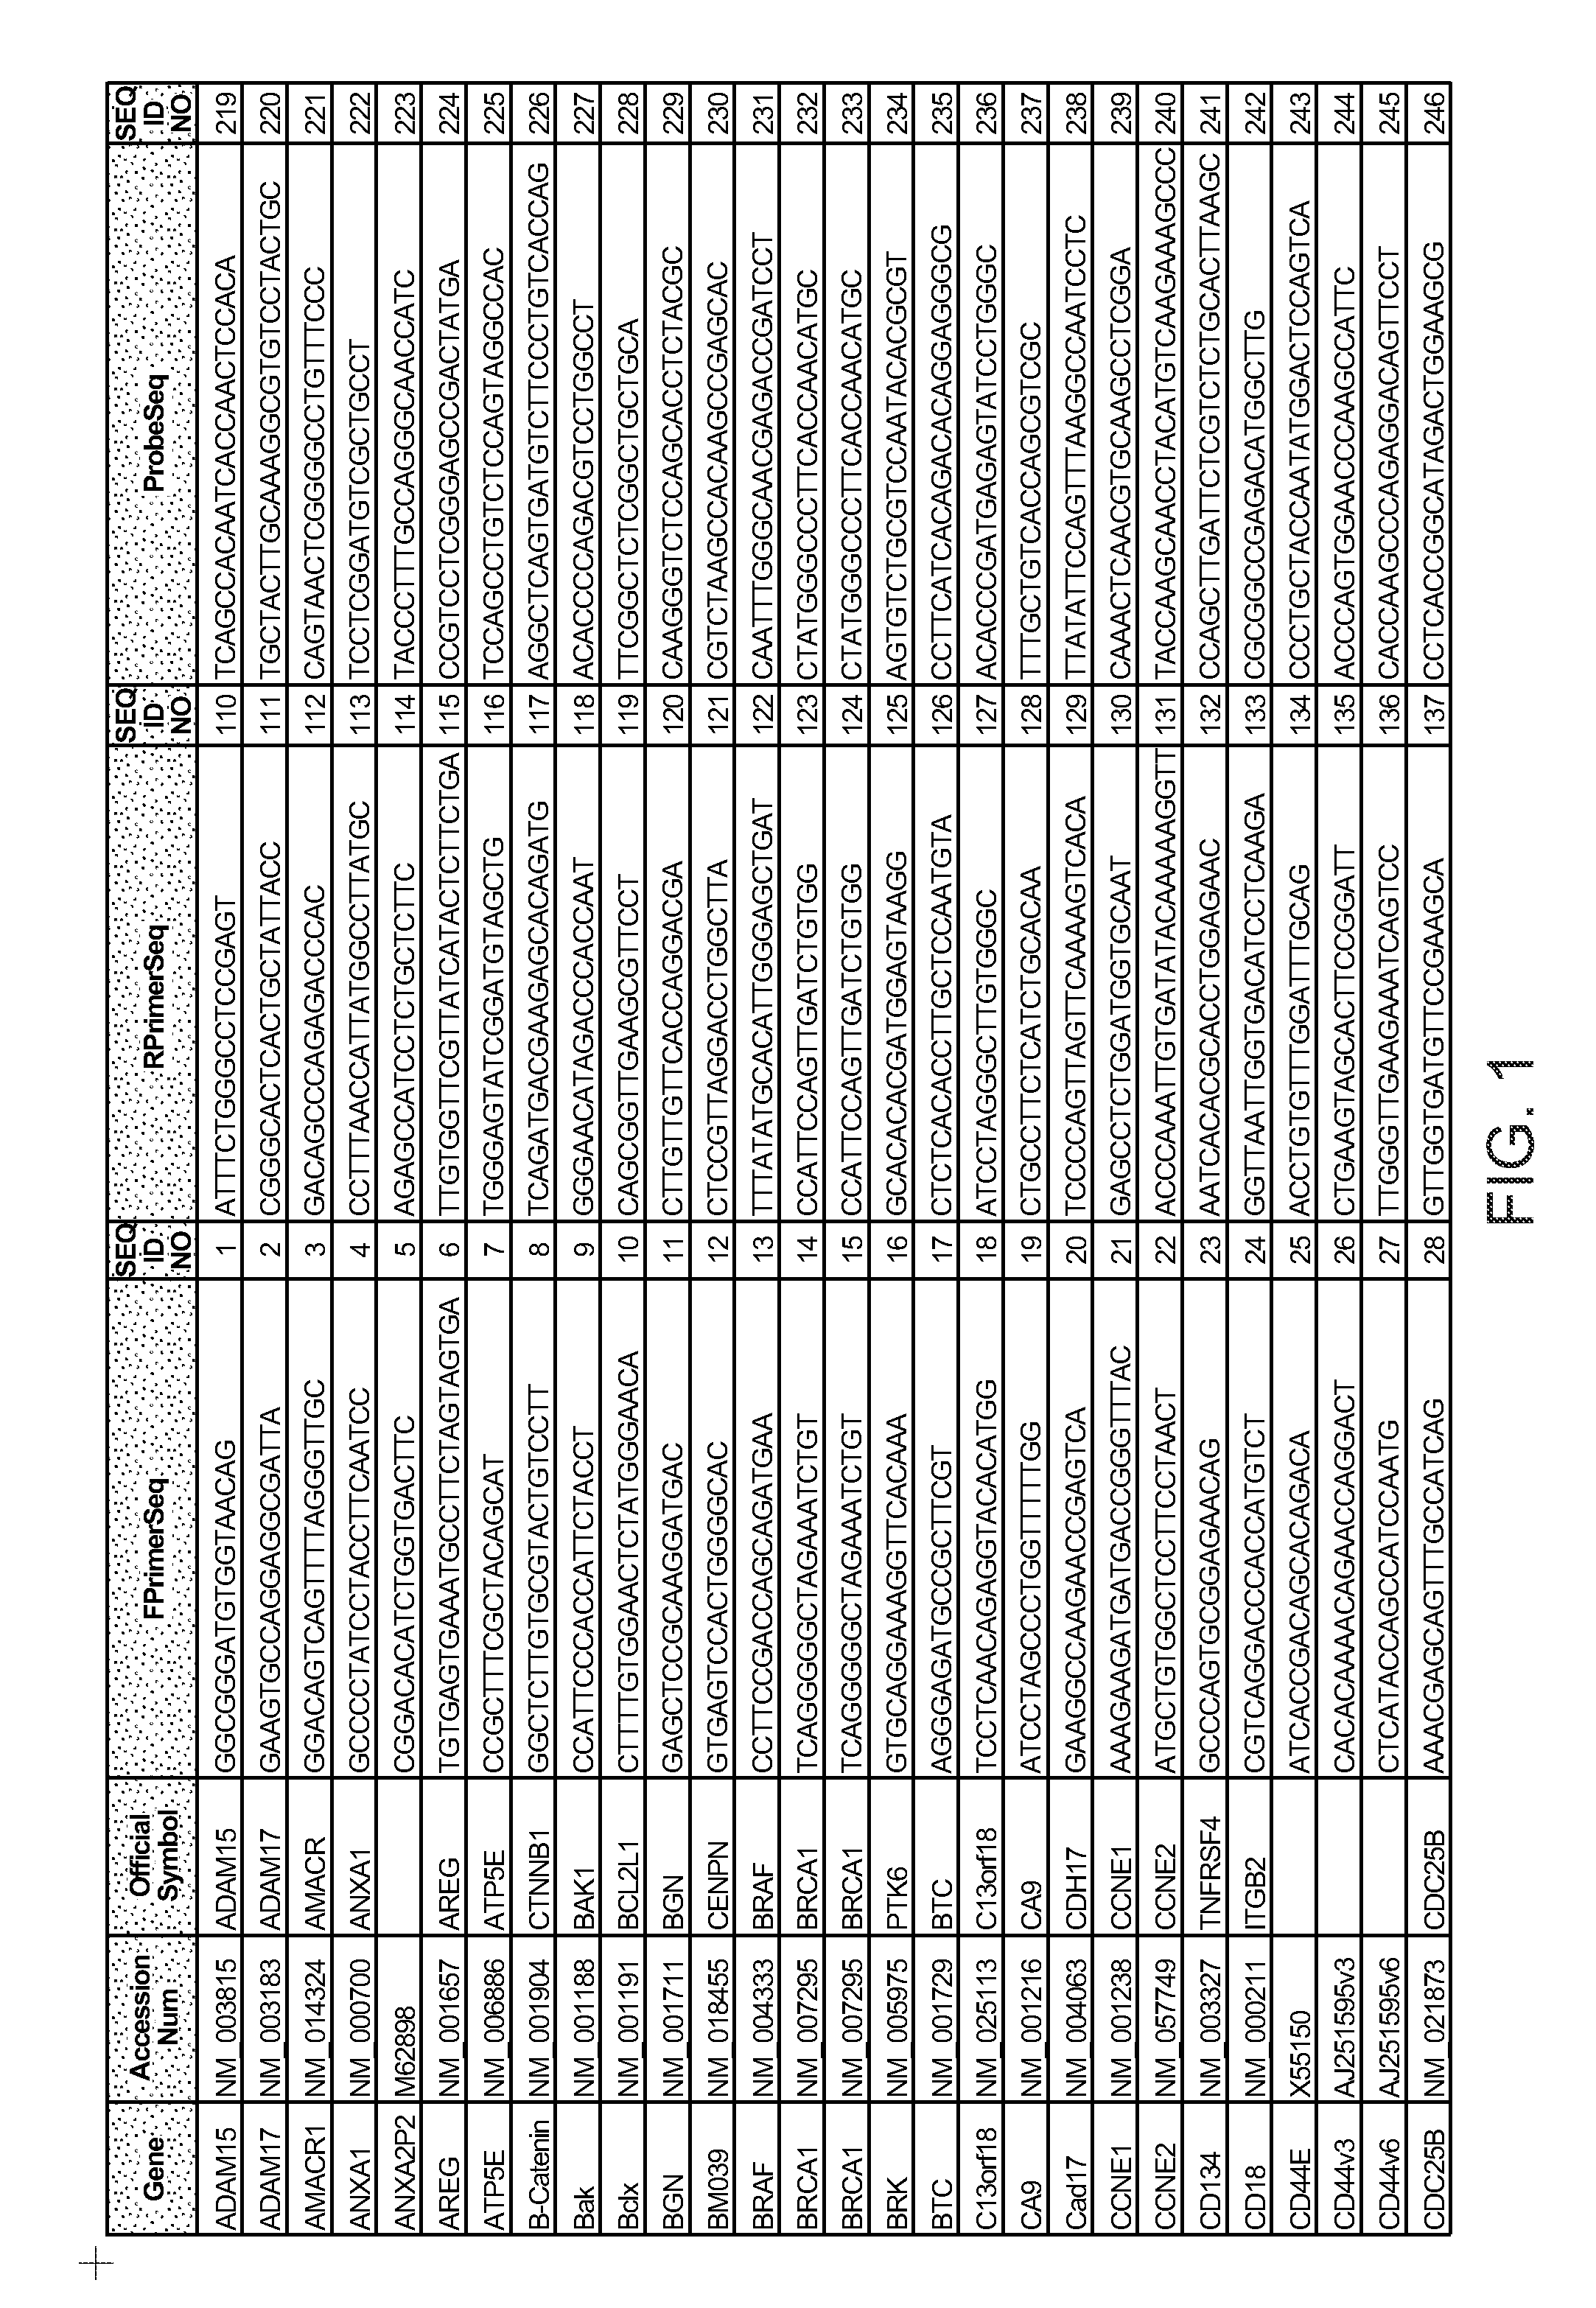
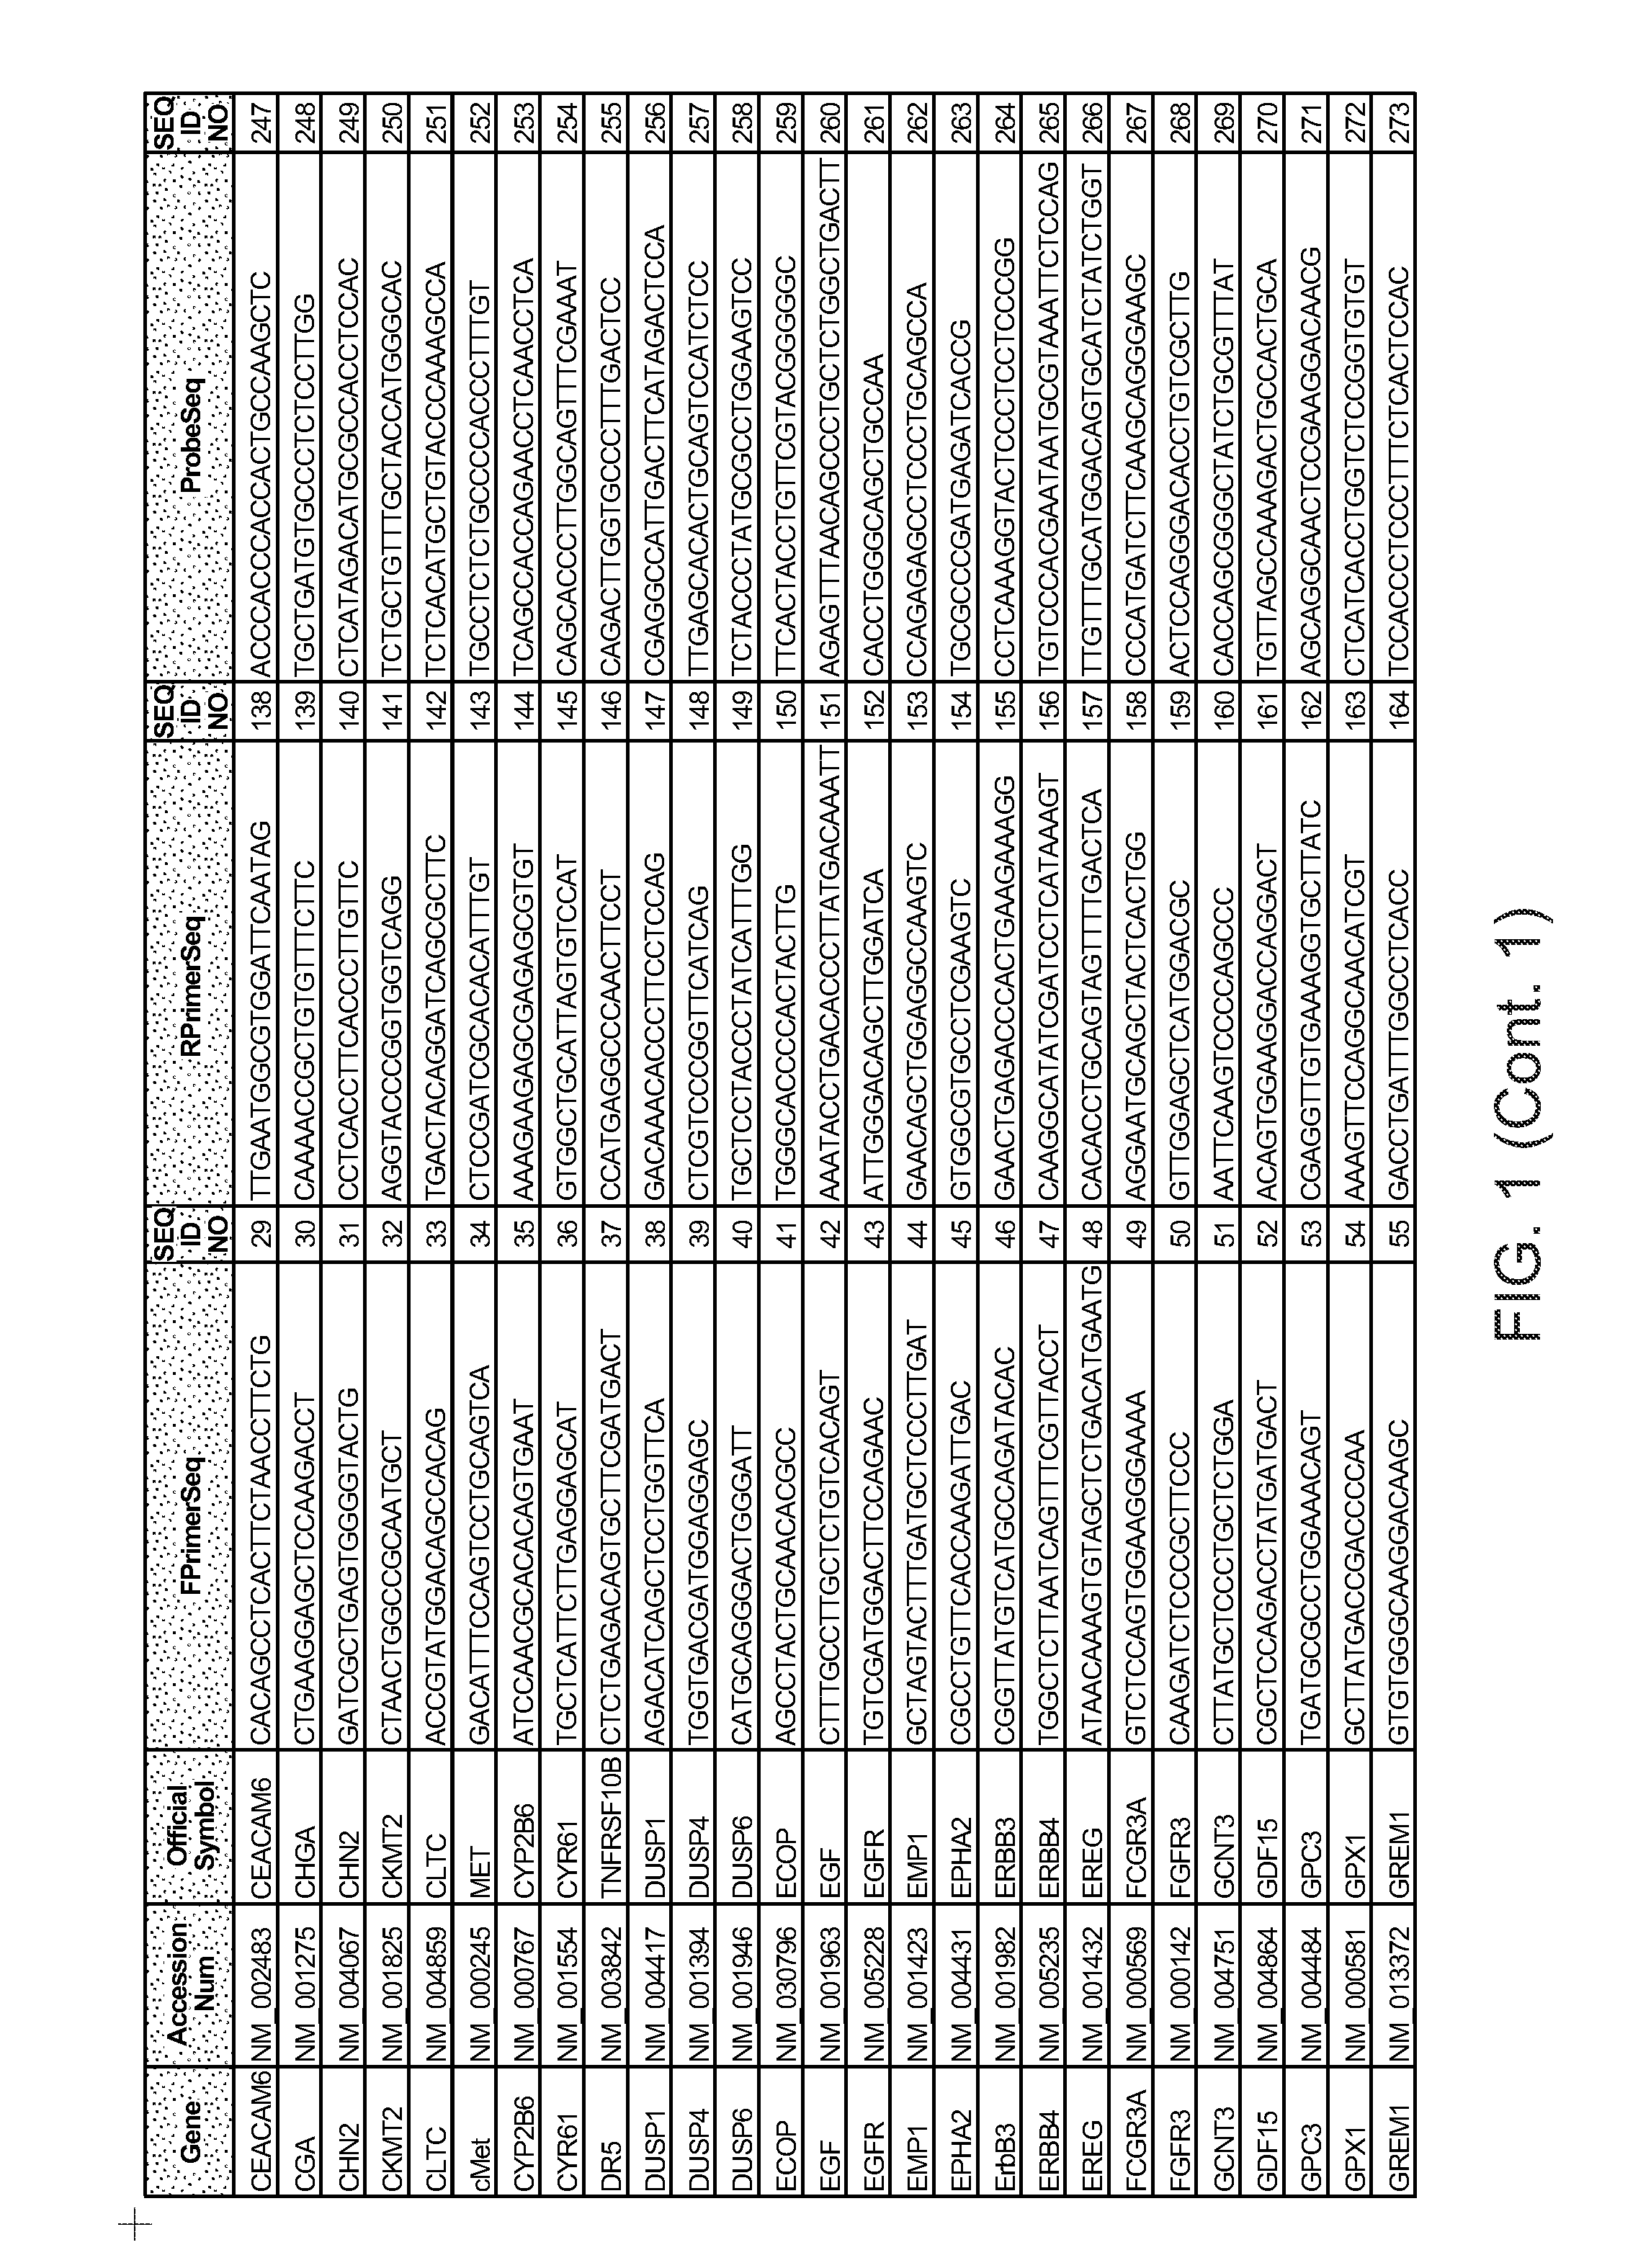
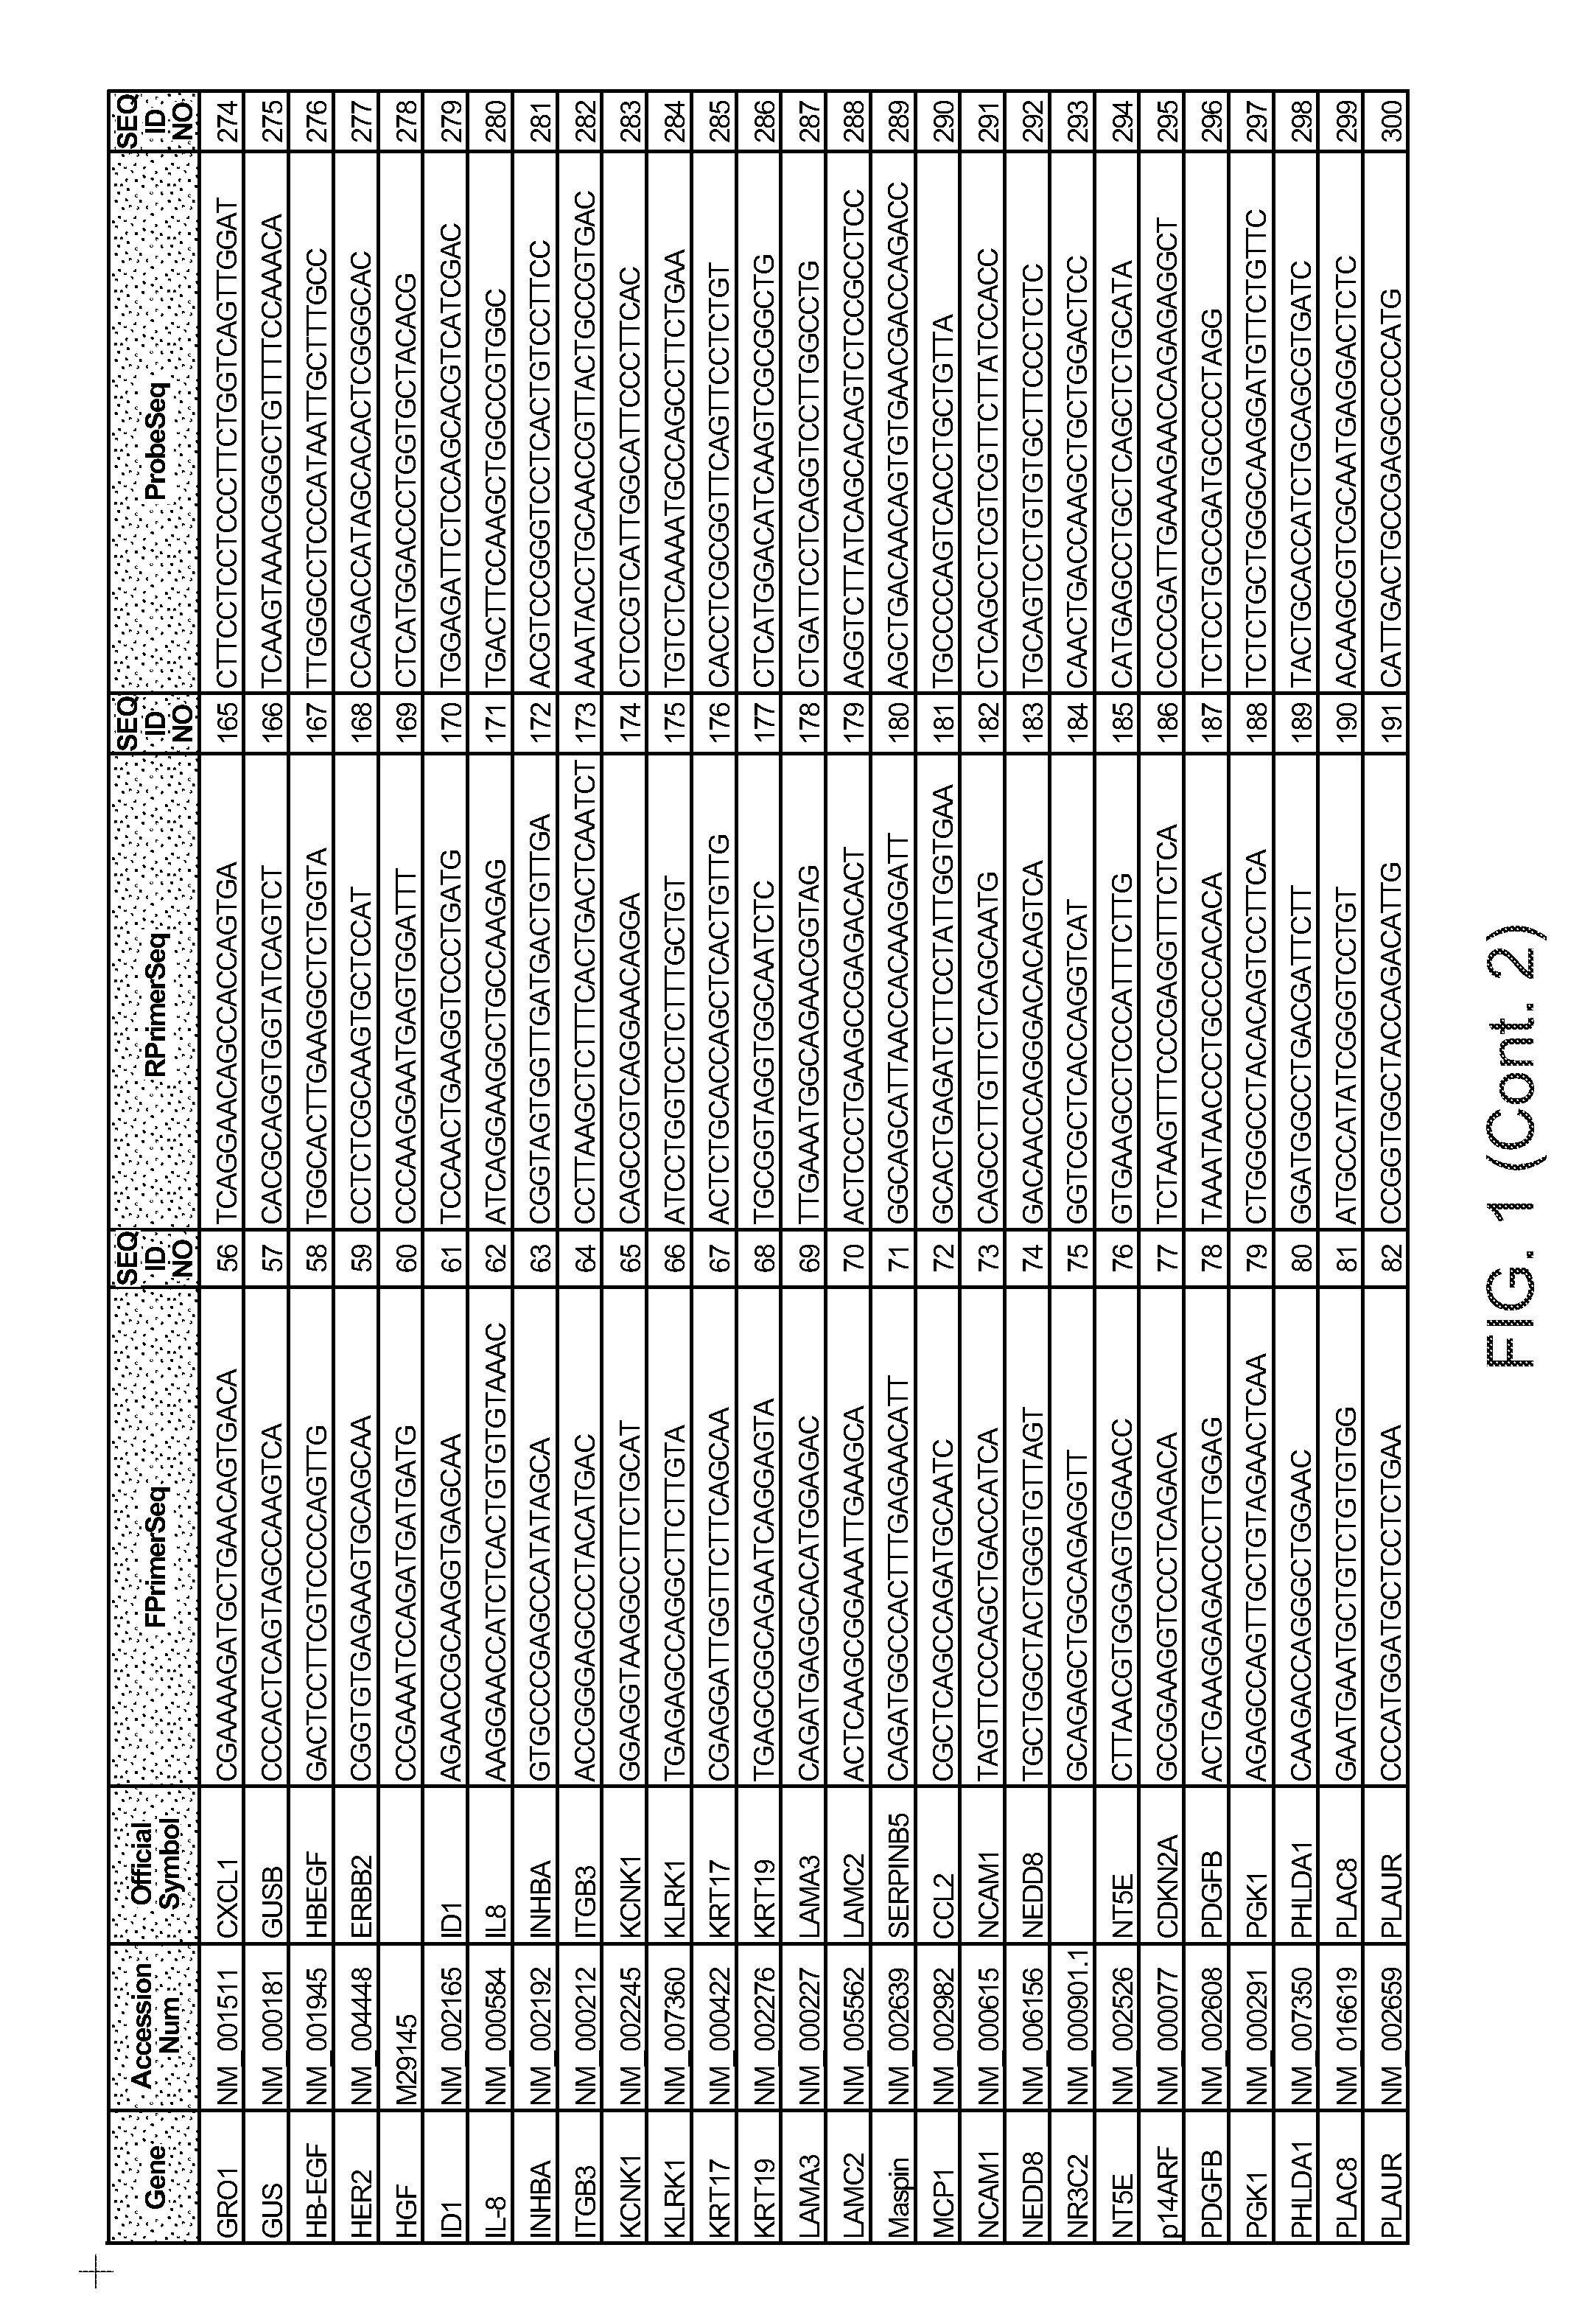
[0253]Gene products that can serve as predictors of response to an EGFR inhibitor (“response indicator genes”) were identified by analyzing normalized levels of gene products from tumors obtained from patients that had undergone cetuximab treatment for colon cancer. Expression levels of the gene products were measured; and normalized levels were determined relative to expression levels of one or more reference genes.

[0254]Identification of an response indicator gene product was carried out by analyzing gene expression levels in cancer cells from a number of patients for whom the following criteria applied: 1) the patients had cancer and were treated for the cancer with an EGFR inhibitor; and 2) the outcome of treatment was documented, i.e., the patients' response to treatment was documented.

[0255]Nucleic acid from cancer cells from the patients was analyzed to measure the expression level of a test gene(s) ...

example 2

Identification of Gene Markers of Response to an EGFR Inhibitor In Colon Cancer Patients (ORR Endpoint)

[0298]Tables 1A and 1B show genes whose normalized expression is correlated (univariate analysis) positively (Table 1A) or negatively (Table 1B) with Overall Response Rate (ORR) in colon cancer patients treated with cetuximab. FIGS. 3A-3D show probability curves that correspond to the data reported in Table 1A; FIGS. 4A-4F show probability curves that correspond to the data reported in Table 1B.

TABLE 1ALikelihoodLikelihoodRatioRatioOddsWald 95%GeneNChi-sqp-valueRatioCI for ORSATB222618.96372.9534(1.68, 5.20)PTP4A322526.02862.8221(1.84, 4.33)QPRT22623.08492.7047(1.62, 4.52)VAV322620.34752.4744(1.58, 3.88)CEACAM62269.7330.00182.3749(1.33, 4.26)EREG22624.81052.0472(1.48, 2.82)ErbB32264.55780.03282.0275(1.04, 3.97)EGFR2267.54160.0062.015(1.20, 3.38)AREG22620.32612.0087(1.44, 2.81)BRCA12265.14360.02331.955(1.08, 3.55)TITF12269.2450.00241.8605(1.25, 2.76)SORBS12267.72840.00541.7668(1.17,...

example 3

Identification of Gene Markers of Response to an EGFR Inhibitor in Colon Cancer Patients (DC Endpoint)

[0299]Tables 2A and 2B show genes whose normalized expression is correlated (univariate analysis) positively (Table 2A) or negatively (Table 2B) with Disease Control in colon cancer patients treated with cetuximab. FIGS. 5A-5E show probability curves that correspond to the data reported in Table 2A; FIGS. 6A-6F shows probability curves that correspond to the data reported in Table 2B.

TABLE 2ALikelihoodLikelihoodRatioRatioOddsWald 95%GeneNChi-sqp-valueRatioCI for ORATP5E2266.83800.00892.6122(1.25, 5.46)TITF122614.18210.00022.6063(1.33, 5.11)CLTC2263.92060.04772.2407(1.00, 5.04)BRCA122613.34320.00032.1392(1.39, 3.29)AREG22638.60001.9568(1.55, 2.48)PTP4A322518.29691.8994(1.39, 2.60)EREG22643.38561.8979(1.54, 2.34)VAV322625.32191.8784(1.43, 2.46)SATB222618.08341.8534(1.36, 2.53)CEACAM622610.72230.00111.8100(1.24, 2.63)EGFR2267.92840.00491.7682(1.16, 2.69)CHN22269.24130.00241.4595(1.14, ...


PUM

PropertyMeasurementUnit
Volumeaaaaaaaaaa
Volumeaaaaaaaaaa
Volumeaaaaaaaaaa

Abstract

The present invention provides methods and compositions to facilitate determining whether an EGFR-expressing cancer in an individual is an EGFR inhibitor-responsive cancer, as well as methods for determining the likelihood that a patient having an EGFR-expressing cancer will exhibit a beneficial response to an EGFR inhibitor therapy. The methods generally involve determining a normalized expression level of a gene product that correlates with EGFR inhibitor responsiveness.

Description

CROSS-REFERENCE TO RELATED APPLICATION[0001]This application claims priority benefit of U.S. Provisional Application Ser. No. 61 / 127,816 filed on May 14, 2008, the entire disclosure of which is incorporated herein by reference in its entirety.TECHNICAL FIELD[0002]The present disclosure provides genes and gene sets, the expression levels of which are useful for predicting response of cancer patients to an epidermal growth factor receptor (EGFR) inhibitor therapy.INTRODUCTION[0003]Epidermal growth factor receptor (EGFR), also known as ERBB and HER1, is a gene that encodes a receptor protein found on the surface of some cells and to which an epidermal growth factor binds, causing the cell to divide. EGFR is a member of the HER family of receptors, and the dimerization of EGFR and v-erb-b2 erythroblastic leukemia viral oncogene homolog 2 (ERBB2), also known as HER2, is an important stimulus for breast cancer growth in ERBB2-positive breast cancers. Expression levels of EGFR are amplifie...

Claims


Application Information

Patent Timeline
IPC IPC(8): C40B30/00C12Q1/68C40B40/06C40B50/14
CPCC12Q1/6886C12Q2600/158C12Q2600/106
Inventor BAKER, JOFFRE B.WATSON, DREWMADDALA, TARASHAK, STEVENMAURO, DAVID J.FORD, SHIRIN K.
Owner GENOMIC HEALTH INC
Why Eureka
Try Eureka