Noise spectrum tracking in noisy acoustical signals

a technology of noise spectrum and noise suppression, applied in the field of identification of noise in acoustic signals, can solve the problems of loss of speech quality, too much or too little noise suppression, difficult noise psd estimation, etc., and achieve the effect of accurate estimation of noise psd and low computational complexity

Active Publication Date: 2010-03-18
OTICON
View PDF2 Cites 37 Cited by
  • Summary
  • Abstract
  • Description
  • Claims
  • Application Information

AI Technical Summary

Benefits of technology

[0012]As do the methods described in [Martin 2001] and [Hendriks 2008], the present invention aims at noise PSD estimation. The advantage of the proposed method over methods proposed in the aforementioned references is that with the proposed method it is possible to accurately estimate the noise PSD, i.e., also when speech is present, at relatively low computational complexity.

Problems solved by technology

In general the noise PSD is unknown and time-varying as well (dependent on the specific environment), which makes noise PSD estimation a challenging problem.
When the noise PSD is estimated wrongly, too much or too little noise suppression will be applied.
For example, when the actual noise level suddenly decreases and the estimated noise PSD is overestimated too much suppression will be applied with a resulting loss of speech quality.
When, on the other hand, the noise level suddenly increases, an underestimated noise level will lead to too little noise suppression leading to the generation of excess residual noise, which again decreases the signal quality and increases listeners' fatigue.
However, VAD based noise PSD estimation is likely to fail when the noise is non-stationary and will lead to a large estimation error when the noise level or spectrum changes.
Although the method proposed in [Hendriks 2008] has been shown to be very effective for noise PSD estimation under non-stationary noise conditions and can be implemented in MATLAB in real-time on a modern PC, the necessary eigenvalue decompositions might be too complex for applications with very low-complexity constraints, e.g. due to power consumption limitations, e.g. in battery driven devices, such as e.g. hearing aids.

Method used


Image

  • Noise spectrum tracking in noisy acoustical signals
  • Noise spectrum tracking in noisy acoustical signals
  • Noise spectrum tracking in noisy acoustical signals

Examples


example 1

Different Resolution, K>J

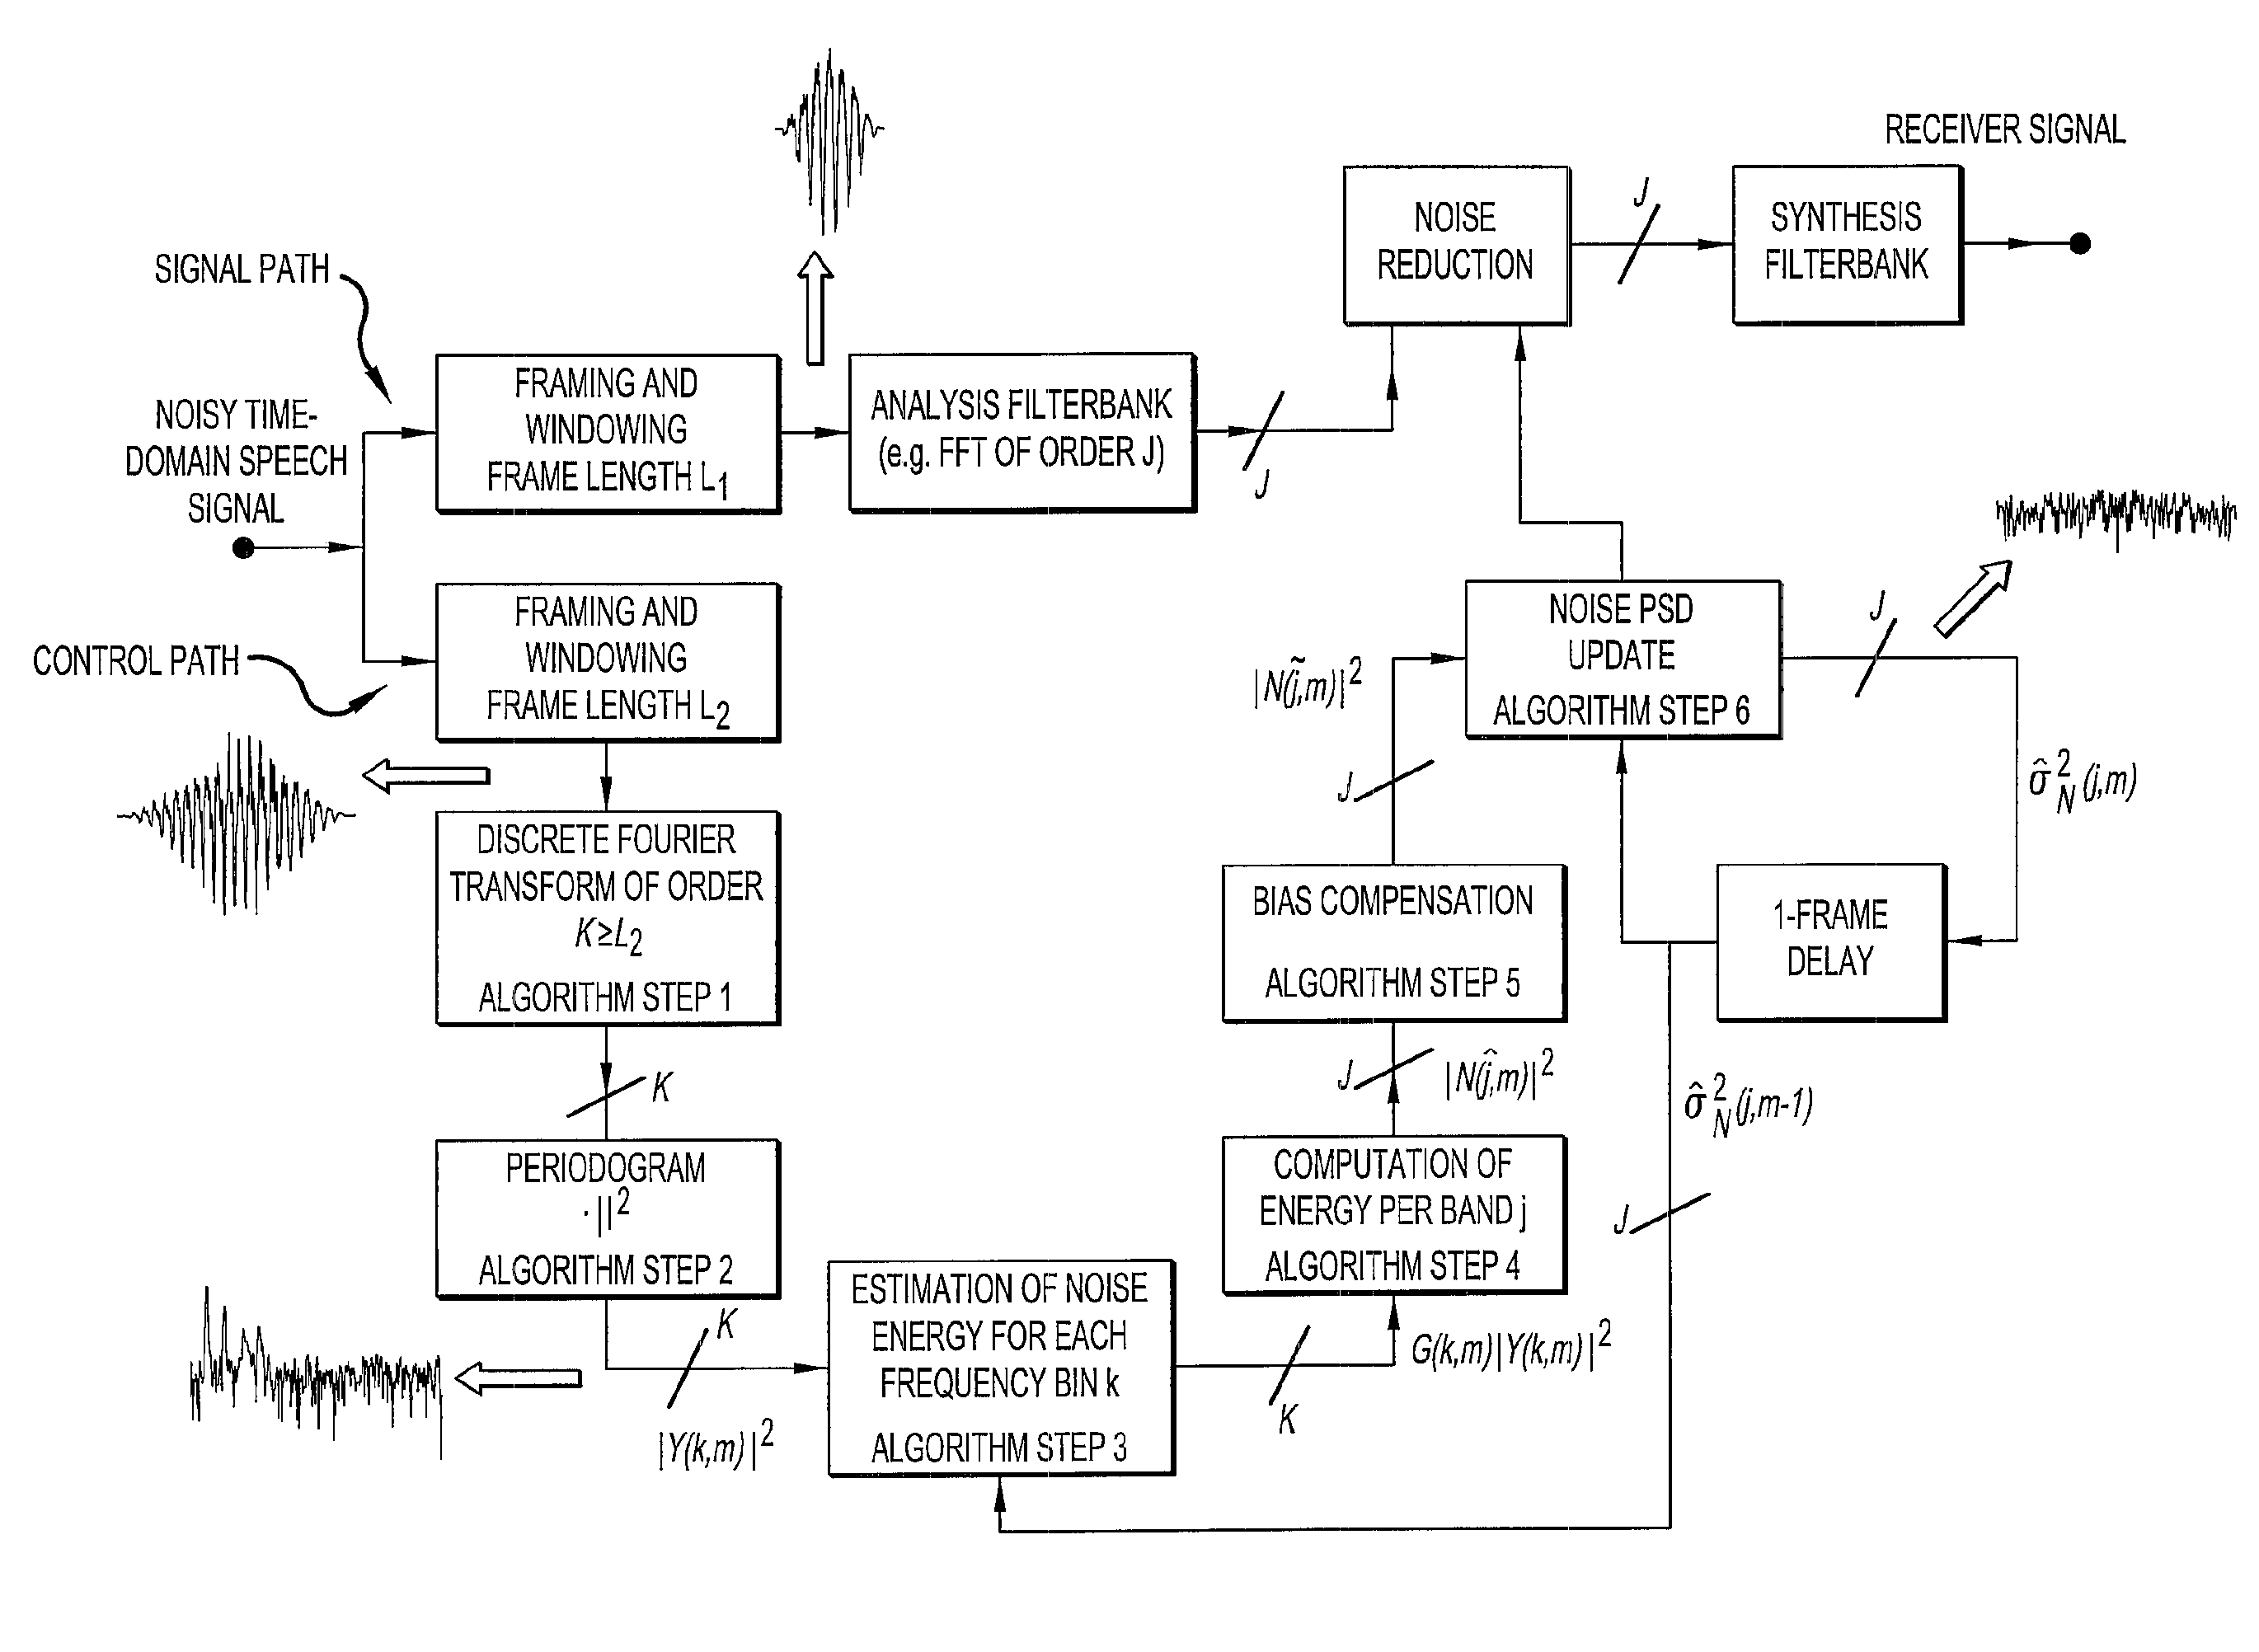
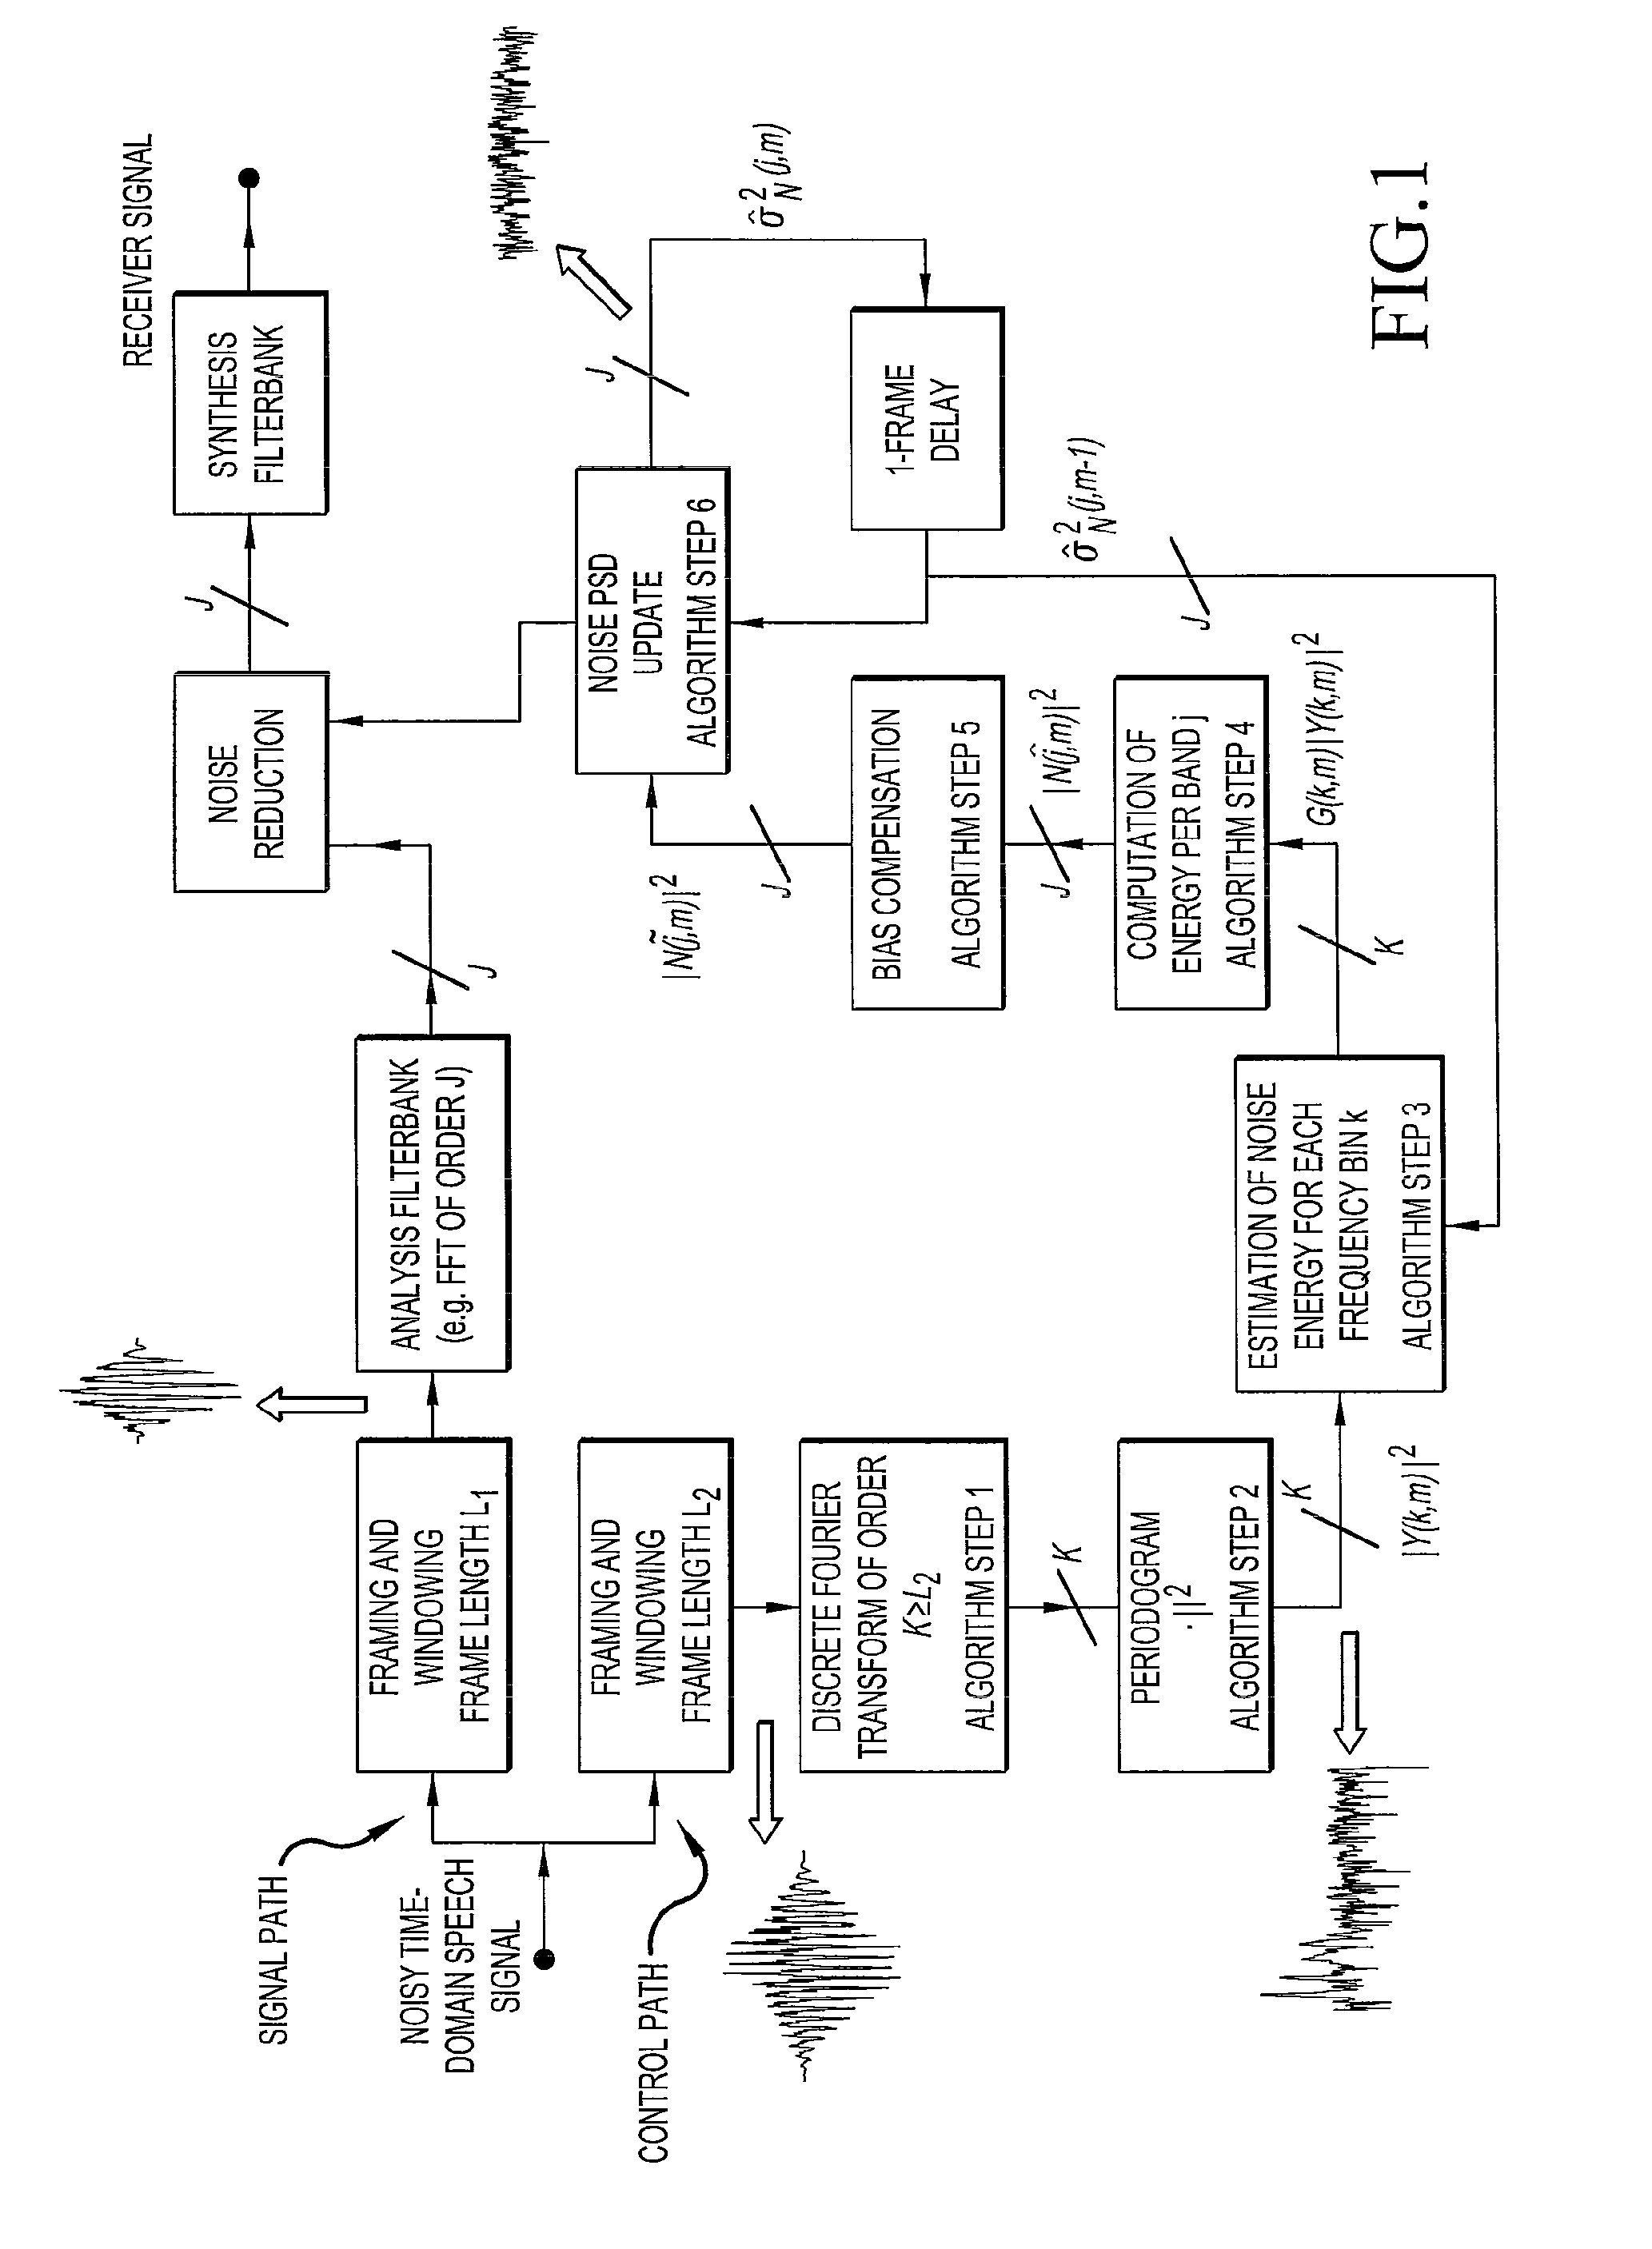
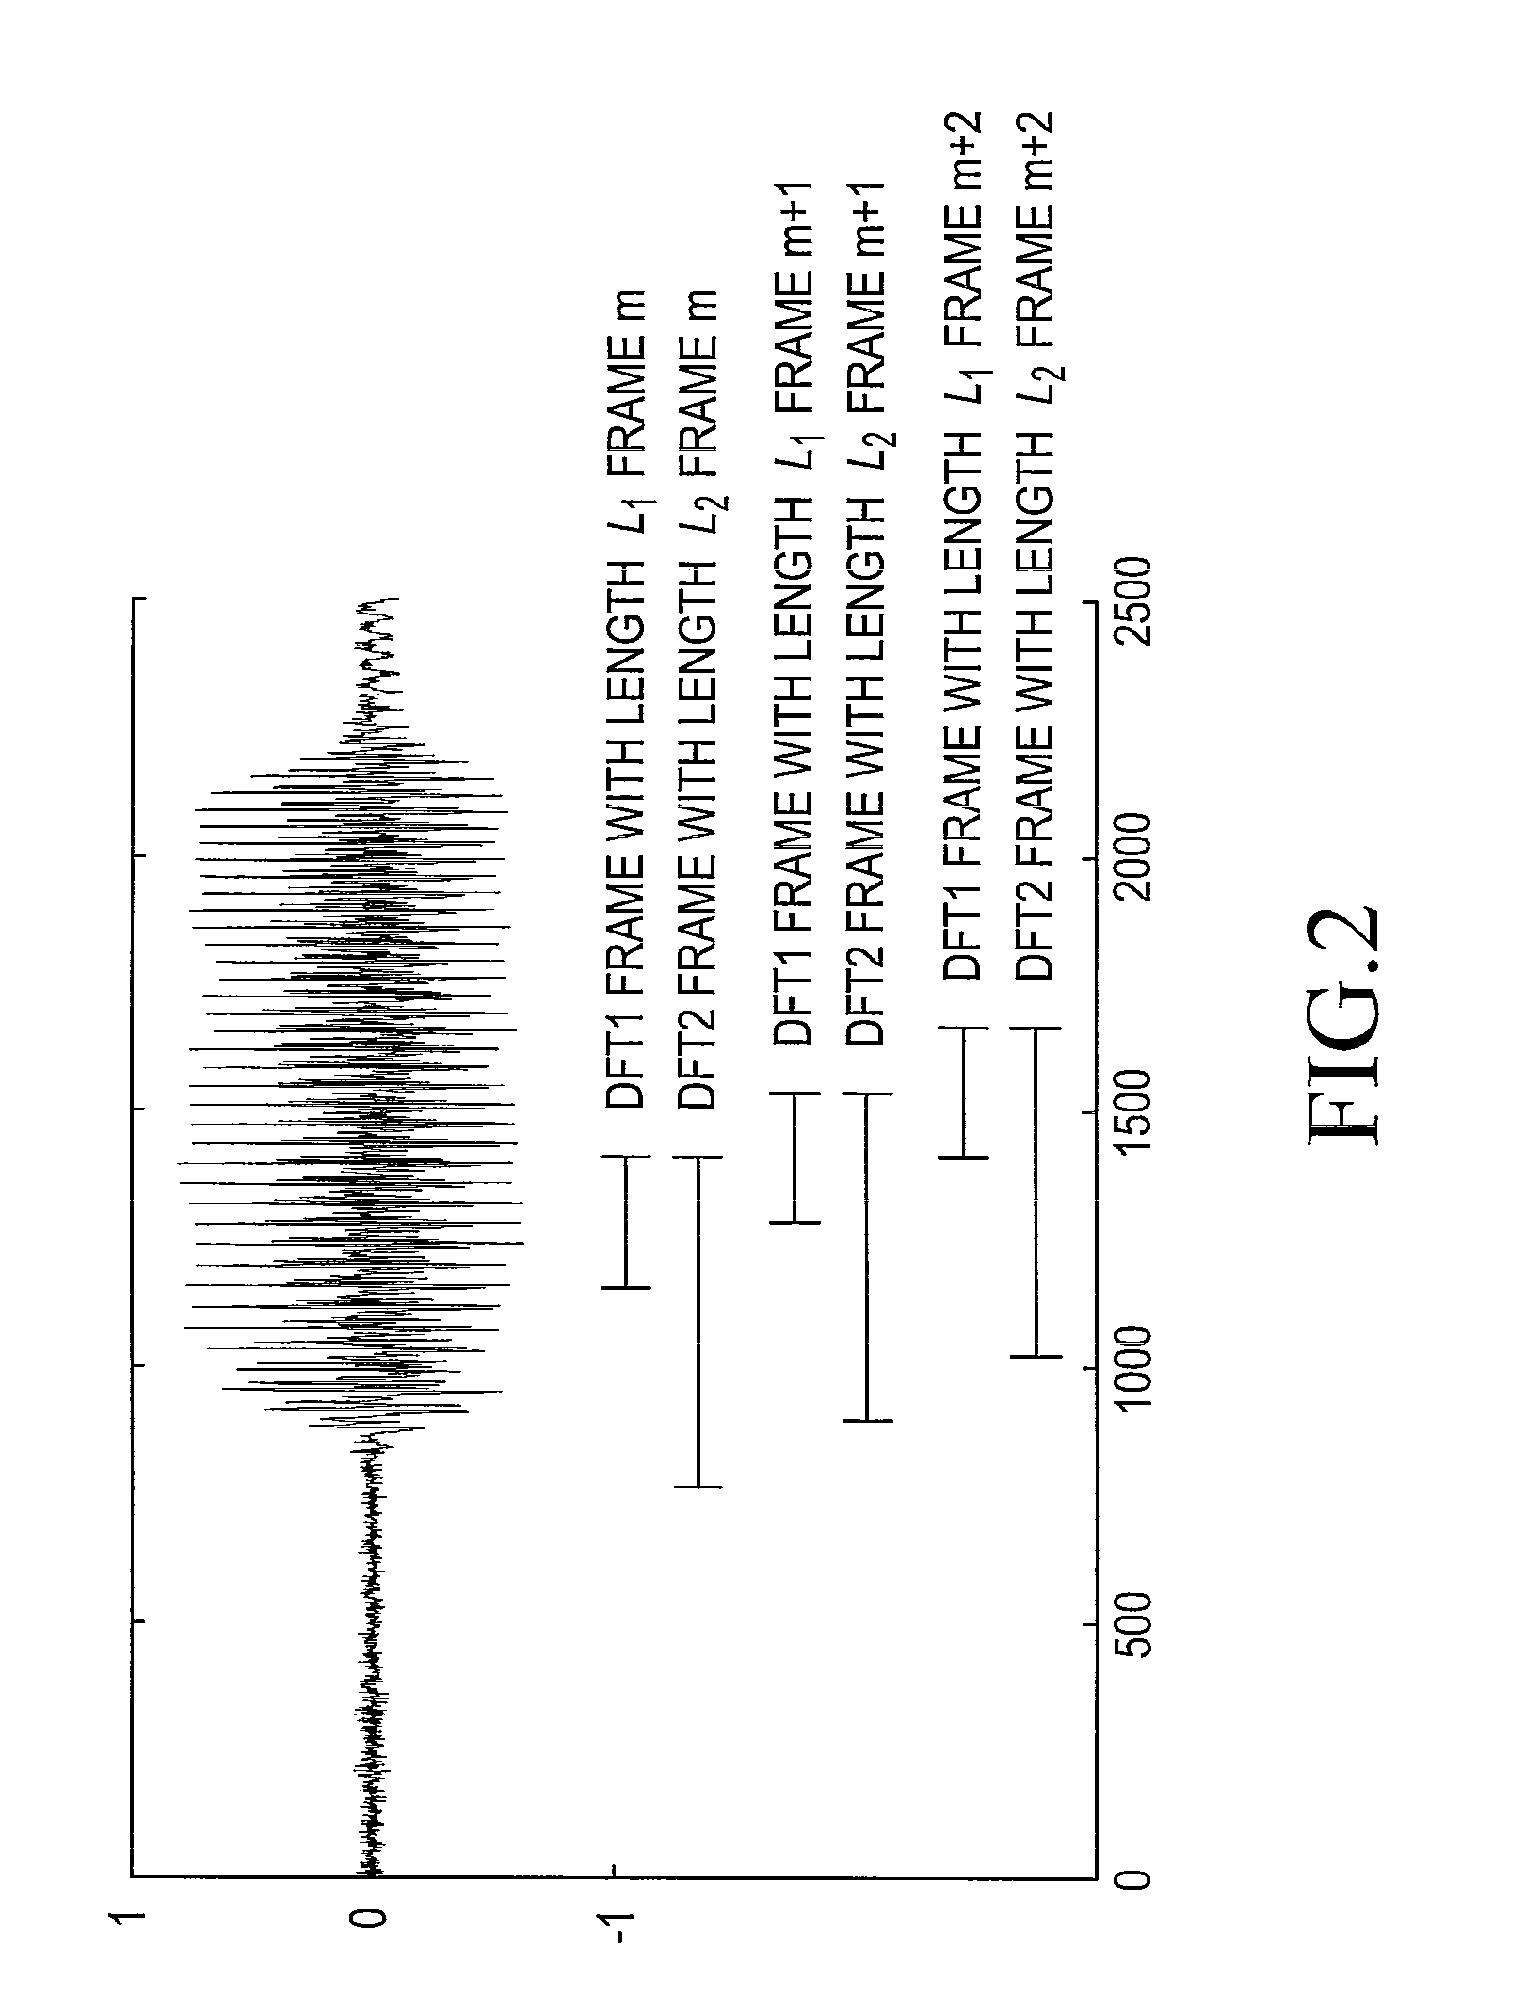
[0127]In a first example of the proposed system we consider the case K>J. Let the sampling frequency fs=8 kHz, and let the DFT1 and DFT2 analysis frames have lengths L1=64 samples and L2=640 samples, respectively. The lengths of the DFT analysis frame and the DFT2 analysis frame then correspond to 8 ms and 80 ms, respectively. The orders of the DFT2 and DFT transform are in this example set at K=1024 (=210) and J=64 (26), respectively.

[0128]The indices of the DFT2 bins corresponding to a sub-band with index-number j, are given by the index set

Bj={k1, . . . , k2}, where k1=(j−½)K / J and k2=(j+½)K / J,

where it is assumed that K and J are integer powers of 2.

[0129]In this example, sub band j consists of P=17 DFT2 spectral values. For example, the sub-band with index-number j=1 then consists of the DFT2 bins with index-numbers 8 . . . 24, and the centre frequency of this band is at the DFT2 bin with index-number k=16.

[0130]Another configuration would be one where ...

example 2

Same Resolution, J=K

[0136]In this example we consider the case K=J, i.e., there is no difference in spectral resolution between the DFT1 and DFT2. Let us again assume that the sampling frequency fs=8 kHz, and let the DFT1 analysis frame have a size of L1=64 samples and the DFT2 analysis frame a size of L2=64 samples. The orders of the DFT2 and DFT1 transform are in this example set at K=J=64, i.e., there is one DFT2 bin k per sub-band j.

[0137]In order to estimate the noise PSD for each sub-band j the steps 3 to 8 from the algorithm description should be followed. An important difference with respect to the previous example is that in step 4 the average noise level in the band is computed by taking the average across one spectral sample, which is, in fact, the spectral sample value itself.

[0138]The present embodiment of the algorithm can e.g. advantageously be used in signal processing applications where an estimate of the noise PSD is needed and processing power is constrained (e.g....


PUM


Abstract

The invention relates to a method of estimating noise power spectral density PSD in an input sound signal comprising a noise signal part and a target signal part. The invention further relates to a system to its use. The object of the present invention is to provide a scheme for estimating the noise PSD in an acoustic signal consisting of a target signal contaminated by acoustic noise. The problem is solved by a method comprising the steps of d) providing a digitized electrical input signal to a control path and performing; d1) storing a number of time frames of the input signal each comprising a predefined number N2 of digital time samples xn (n=1, 2, . . . , N2), corresponding to a frame length in time of L2=N2/fs; d2) performing a time to frequency transformation of the stored time frames on a frame by frame basis to provide corresponding spectra Y of frequency samples; d3) deriving a periodogram comprising the energy content |Y|2 for each frequency sample in a spectrum, the energy content being the energy of the sum of the noise and target signal; d4) applying a gain function G to each frequency sample of a spectrum, thereby estimating the noise energy level |Ŵ|2 in each frequency sample, |Ŵ|2=G·|Y|2; d5) dividing the spectra into a number Nsb2 of sub-bands, each sub-band comprising a predetermined number nsb2 of frequency samples, and assuming that the noise PSD level is constant across a sub-band; d6) providing a first estimate |{circumflex over (N)}|2 of the noise PSD level in a sub-band based on the non-zero noise energy levels of the frequency samples in the sub-band; d7) providing a second, improved estimate |Ñ|2 of the noise PSD level in a sub-band by applying a bias compensation factor B to the first estimate, |Ñ|2=B·|{circumflex over (N)}|2. The invention may e.g. be used in listening devices, e.g. hearing aids, mobile telephones, headsets, active earplugs, etc.

Description

TECHNICAL FIELD[0001]The invention relates to identification of noise in acoustic signals, e.g. speech signals, using fast noise power spectral density tracking. The invention relates specifically to a method of estimating noise power spectral density PSD in an input sound signal comprising a noise signal part and a target signal part.[0002]The invention furthermore relates to a system for estimating noise power spectral density PSD in an input sound signal comprising a noise signal part and a target signal part.[0003]The invention furthermore relates to use of a system according to the invention, to a data processing system and to a computer readable medium.[0004]The invention may e.g. be useful in listening devices, e.g. hearing aids, mobile telephones, headsets, active earplugs, etc.BACKGROUND ART[0005]In order to increase quality and decrease listener fatigue of noisy speech signals that are processed by digital speech processors (e.g. hearing aids or mobile telephones) it is of...

Claims


Application Information

Patent Timeline
Patent Type & Authority Applications(United States)
IPC IPC(8): H04R29/00G10L21/00G10L21/02G10L21/0208G10L21/0216G10L21/057G10L25/93
CPCG10L21/0208G10L2021/0575G10L21/0216
Inventor HENDRIKS, RICHARD C.JENSEN, JESPERKJEMS, ULRIKHEUSDENS, RICHARD
Owner OTICON
Why Eureka
Try Eureka