Superresolution Optical Fluctuation Imaging (SOFI)

Active Publication Date: 2010-12-02
SOFAST
View PDF20 Cites 38 Cited by
  • Summary
  • Abstract
  • Description
  • Claims
  • Application Information

AI Technical Summary

Benefits of technology

[0024]In this invention, we disclose statistical analysis techniques (based on auto- and cross-correlations/cumulants) of image stacks (movies) of fluctuating objects that improve resolution beyond the classical diffraction limit and reduce the background. The time trajectory of every pixel in the image frame is correlated with itself and/or with the time trajectory of an adja

Problems solved by technology

However, features smaller than approximately half the emission wavelength (˜200-300 nm) for visible light cannot be resolved in conventional far-field microscopy due to the above mentioned limit.
Similarly, astronomical observations cannot resolve neighboring celestial objects below the diffraction limit of light.
Other non-optical imaging techniques, such as electron microscopy (scanning electron microscope, transmission electron microscope, cryo-electron microscope) and scanning probe microscopy (scanning tunneling microscope, atomic force microscope), achieve molecular-level resolution, but are not suitable for imaging features within live cells.
They are limited to analyzing surfaces (membranes) or to fixed and thinly sectioned samples.
STED has achieved video-rate resolution enhancement but the method is quite demanding in terms of the labeling procedures, choice of dyes, and requires tedious alignment procedures, which are challenging.
All superresolution methods are capable of enhancing the resolution in 3D, but often at the expense of major technical demands or modifications to the microscope, as taught in Shtengel et al., “Interferometric fluorescent super-resolution microscopy resolves 3D cellular ultrastructure”, 2009, Proceedings of the National Academy of Science, USA, vol.
PALM and STORM achieve nanometer resolution, but with the trade-off of slow acquisition speed.
The acquisition of a full superresolution image usually takes minutes to hours.
Lastly, even though OLID provides fast imaging with enhanced contrast, it lacks superresolution capability.
Even though this approach yields sectioning along the optical axis, the fact that the fluctuations are not originating from independent microscopic (i.e. sub-diffraction sized) emitters but from diffraction limited speckles, imposes a fundamental limit on DSI resolution, as it is diffraction limited.
However a detailed analysis of these approaches reveals dramatic differences in capabilities, resulting effects, uses, and applications.

Method used


Image

  • Superresolution Optical Fluctuation Imaging (SOFI)
  • Superresolution Optical Fluctuation Imaging (SOFI)
  • Superresolution Optical Fluctuation Imaging (SOFI)

Examples


example 1

der Auto-Correlation-Based Sofi With

Arbitrary Time Lags

[0036]The second-order auto-correlation function G2 (ri, τ1, τ2) for arbitrary time lags τ1 is given by:

[0037]G2(ri, τ1, τ2)=δF(ri, t+τ1)·δF(ri, t+τ2)(4)

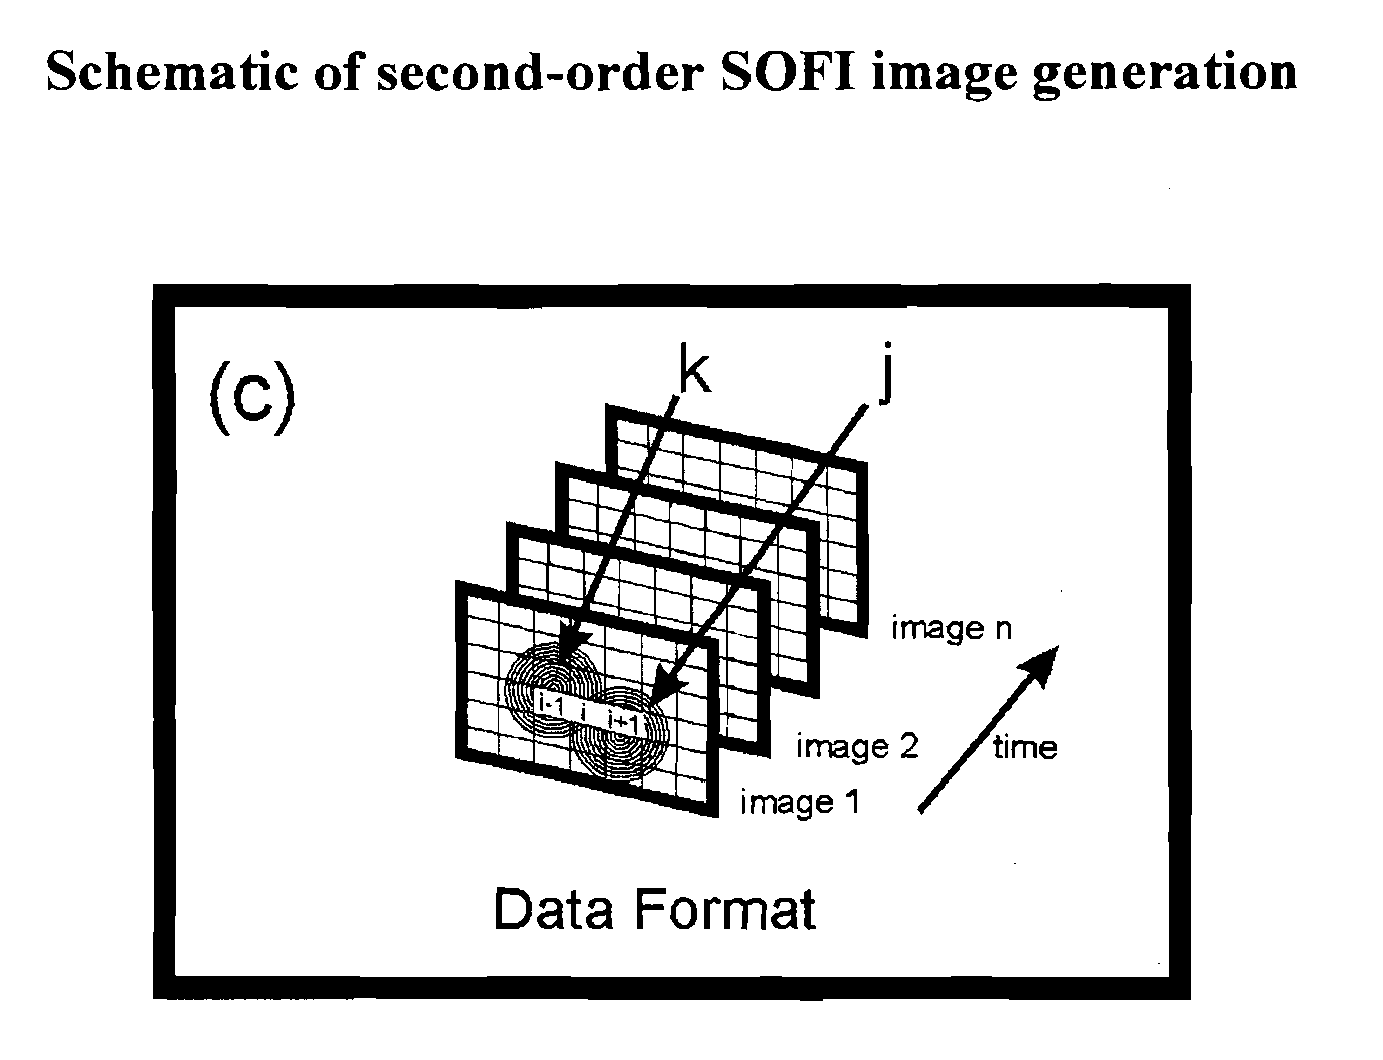
[0038]A SOFI image can be generated by using the second-order auto-correlation function not only for time lag τ1=0 and τ2 =1 as described in paragraph [0028], but for any combination of time lags τ1, τ2 (FIG. 3(b)). A superposition of many such combinations will also yield a SOFI image (Eq. (5) and FIG. 3(c)):

S(ri)=∑τ1,τ2G2(ri,τ1,τ2)(5)

[0039]Note that τj could take finite time lags values or differences between time lags.

example 2

der Auto-Cumulant-Based Sofi

[0040]The above descriptions of the preferred embodiment and Example 1 (paragraphs [0025]-[0032]) utilize second-order auto-correlations. Higher-order SOFI images could be generated by utilizing the concept of auto-cumulants. Auto-cumulants can be derived from the auto-correlation functions and are identical to them for orders 1, 2 and 3 (the first-order correlation corresponds to the temporal mean value). Higher-order auto-correlation functions (for pixel ri) are computed according to:

[0041]Gn(ri, τ1, . . . , τn)=δF(ri,t+τ2) . . . δF(ri,t+τn)(6) utilizing auto-cumulants (J. Mendel,“Tutorial on Higher-Order Statistics (Spectra) in Signal Processing and System Theory: Theoretical Results and Some Applications”,1991, Proceedings of IEEE, vol. 19, no. 3, Equation A-1), Gn, (ri,τ1, . . . , tn) could be computed according to Eqs. (7) below that describe the relationship between auto-cumulants Cn and auto-correlations Gn (only relationships up to 4th order are ...

example 3

der Cross-Correlation-Based Sofi

[0045]Analogous to the second-order auto-correlation SOFI scheme (paragraphs [0025]-[0031]), one can define a spatio-temporal second-order cross-correlations-based SOFI approach. In this case, different pixels' ri1 and ri2 time trajectories are correlated at time lags τ1=0 and τ2=1. The second-order cross-correlation XG2 is then given by (see FIG. 4(a)):

[0046]XG2(ri1,ri2|0,1)=δF(ri1,t+0)·δF(ri2,t+1), (10) Whenever the original PSF is oversampled by several pixels, and those pixels record fluctuations from near-by emitters in a correlated manner, a cross-correlation could be calculated. Although time trajectories of different pixels are used to calculate the cross-correlation terms, the value of XG2 could be assigned to a particular SOFI image's pixel according to:

XG2(ri1,ri2|0,1)=U(ri1-ri22)·∑kU2(rk-ri1+ri22)·ɛk2〈δsk(t+0)·δsk(t+1)〉t(11)

[0047]where k extends over all emitters present in the field-of-view / sample and rk represents emitter k's positions. ...


PUM


Abstract

Statistical analysis techniques based on auto- and cross-correlations / cumulants, of image stacks of fluctuating objects are used to improve resolution beyond the classical diffraction limit and to reduce the background. The time trajectory of every pixel in the image frame is correlated with itself and / or with the time trajectory of an adjacent pixel. The amplitude of these auto- or cross-correlations / cumulants of each pixel, at a given time lag or averaged or integrated over an interval of time lags, is used as the intensity value of that pixel in the generated superresolved optical fluctuation image.

Description

REFERENCE TO RELATED APPLICATIONS[0001]This application relies for priority on provisional application #61183519 of Jörg Enderlein, filed on Jun. 2, 2009 and entitled “Superresolution optical fluctuation imaging (SOFI)”FIELD OF THE INVENTION[0002]This invention relates generally to sub-diffraction and background reduction optical (or electromagnetic) imaging methods based on a signal processing method of data stacks (sequence of multiple x-y images / frames as function of time i.e. a movie). The method relies on multiple-order auto- and cross-correlation (and auto / cross cumulants) statistical analysis of temporal fluctuations (caused, for example, by fluorescence blinking / intermittency) recorded in a sequence of images (a movie). The method can be applied to superresolve stationary and non-stationary samples composed of light- emitting, absorbing or scattering blinking objects. Fields of use include microscopy, telescopy, medical imaging, and other forms of electromagnetic imaging.D...

Claims


Application Information

Patent Timeline
IPC IPC(8): G06K9/32
CPCG01N21/6458G02B21/0076G02B21/008G02B21/367G02B27/58G06T3/4053G06T2207/10056G06T2207/10064H04N5/23232H04N23/951
Inventor ENDERLEIN, JOERG
Owner SOFAST
Why Eureka
Try Eureka