Population Adjusted Indexes

a population and index technology, applied in the field of population adjusted indexes, can solve the problems of not easily applied across a broad range of disease conditions or populations, difficult to evaluate the level and reasonable expense of medical services, and provide a convenient way

Inactive Publication Date: 2011-03-10
BOARD OF RGT THE UNIV OF TEXAS SYST
View PDF6 Cites 36 Cited by
  • Summary
  • Abstract
  • Description
  • Claims
  • Application Information

AI Technical Summary

Benefits of technology

[0010]This disclosure provides for the first time, the ability to provide a continuously updated benchmark for the comparison of medical, business or educational performance by providers or practitioners of such services that effect populations of individuals, and that is based on measurable outcomes rather than on an attempt to account for all relevant variables. Specifically, this disclosure provides for a healthcare performance index useful for evaluating the performance of a service provider comprising performance index values generated from patient populations that has been transformed to be insensitive to the changing patient-mix or patient diversity allowing the comparison of medical, business or educational performance by providers or practitioners of such services regardless of the populations of individuals being treated by these groups. Additionally, the healthcare performance index are useful for comparing the performance and effectiveness of different therapies.

Problems solved by technology

Medical care providers, hospital and practice groups management, payors and insurers, among others have found it difficult t0 evaluate the level and reasonable expense of medical services as applied to a particular group of patients, institutions or practice groups, for example, because of the many variables involved in the health care system.
Actuary tables, for example, are based on static, historical data that do not change in real time and do not provide a convenient way to adjust for individual circumstances of a provider's patient population.
Although this study provided a method of comparing adherence to particular guidelines, it is not easily applied across a broad range of disease conditions or populations because of the number of parameters that must be included, and because of the risk that some important performance criteria may not be included.
However, there are a number of situations where one group wants to track its performance over extended time periods.
While there have been healthcare indexes disclosed in the past, none have been of great help or useful for the healthcare providers to evaluate the performance of their healthcare groups with other healthcare groups.
A major problem is that the performance measures or outcomes that are followed over time and compared to these indexes are typically based on values that have not been risk adjusted to reflect changing patient populations or morbidities that make up the index.
As a result, generalized use of these indices has not been adopted.
While useful in providing risk-adjusted comparisons, using the approach taught in U.S. 2007 / 0154637 is problematic if a healthcare provider wants to develop a trend or index.
The difficulty arises because the risk-adjustment is to a real-time benchmark that varies over time in terms of its performance values and patient population that compose the benchmark.
Unlike the S&P 500 or other “market” portfolios, where the composition of the market portfolio is relatively stable, the real-time benchmark portfolio changes over time causing difficulty in risk-adjusting solely to the patient diversity.
Therefore, the risk-adjusted performance values based on these real-time benchmarks do not provide a means to build a trend, index, or risk-adjusted performance value that one can use for the development of an index.

Method used


Image

  • Population Adjusted Indexes
  • Population Adjusted Indexes
  • Population Adjusted Indexes

Examples


example 1

A Healthcare Index

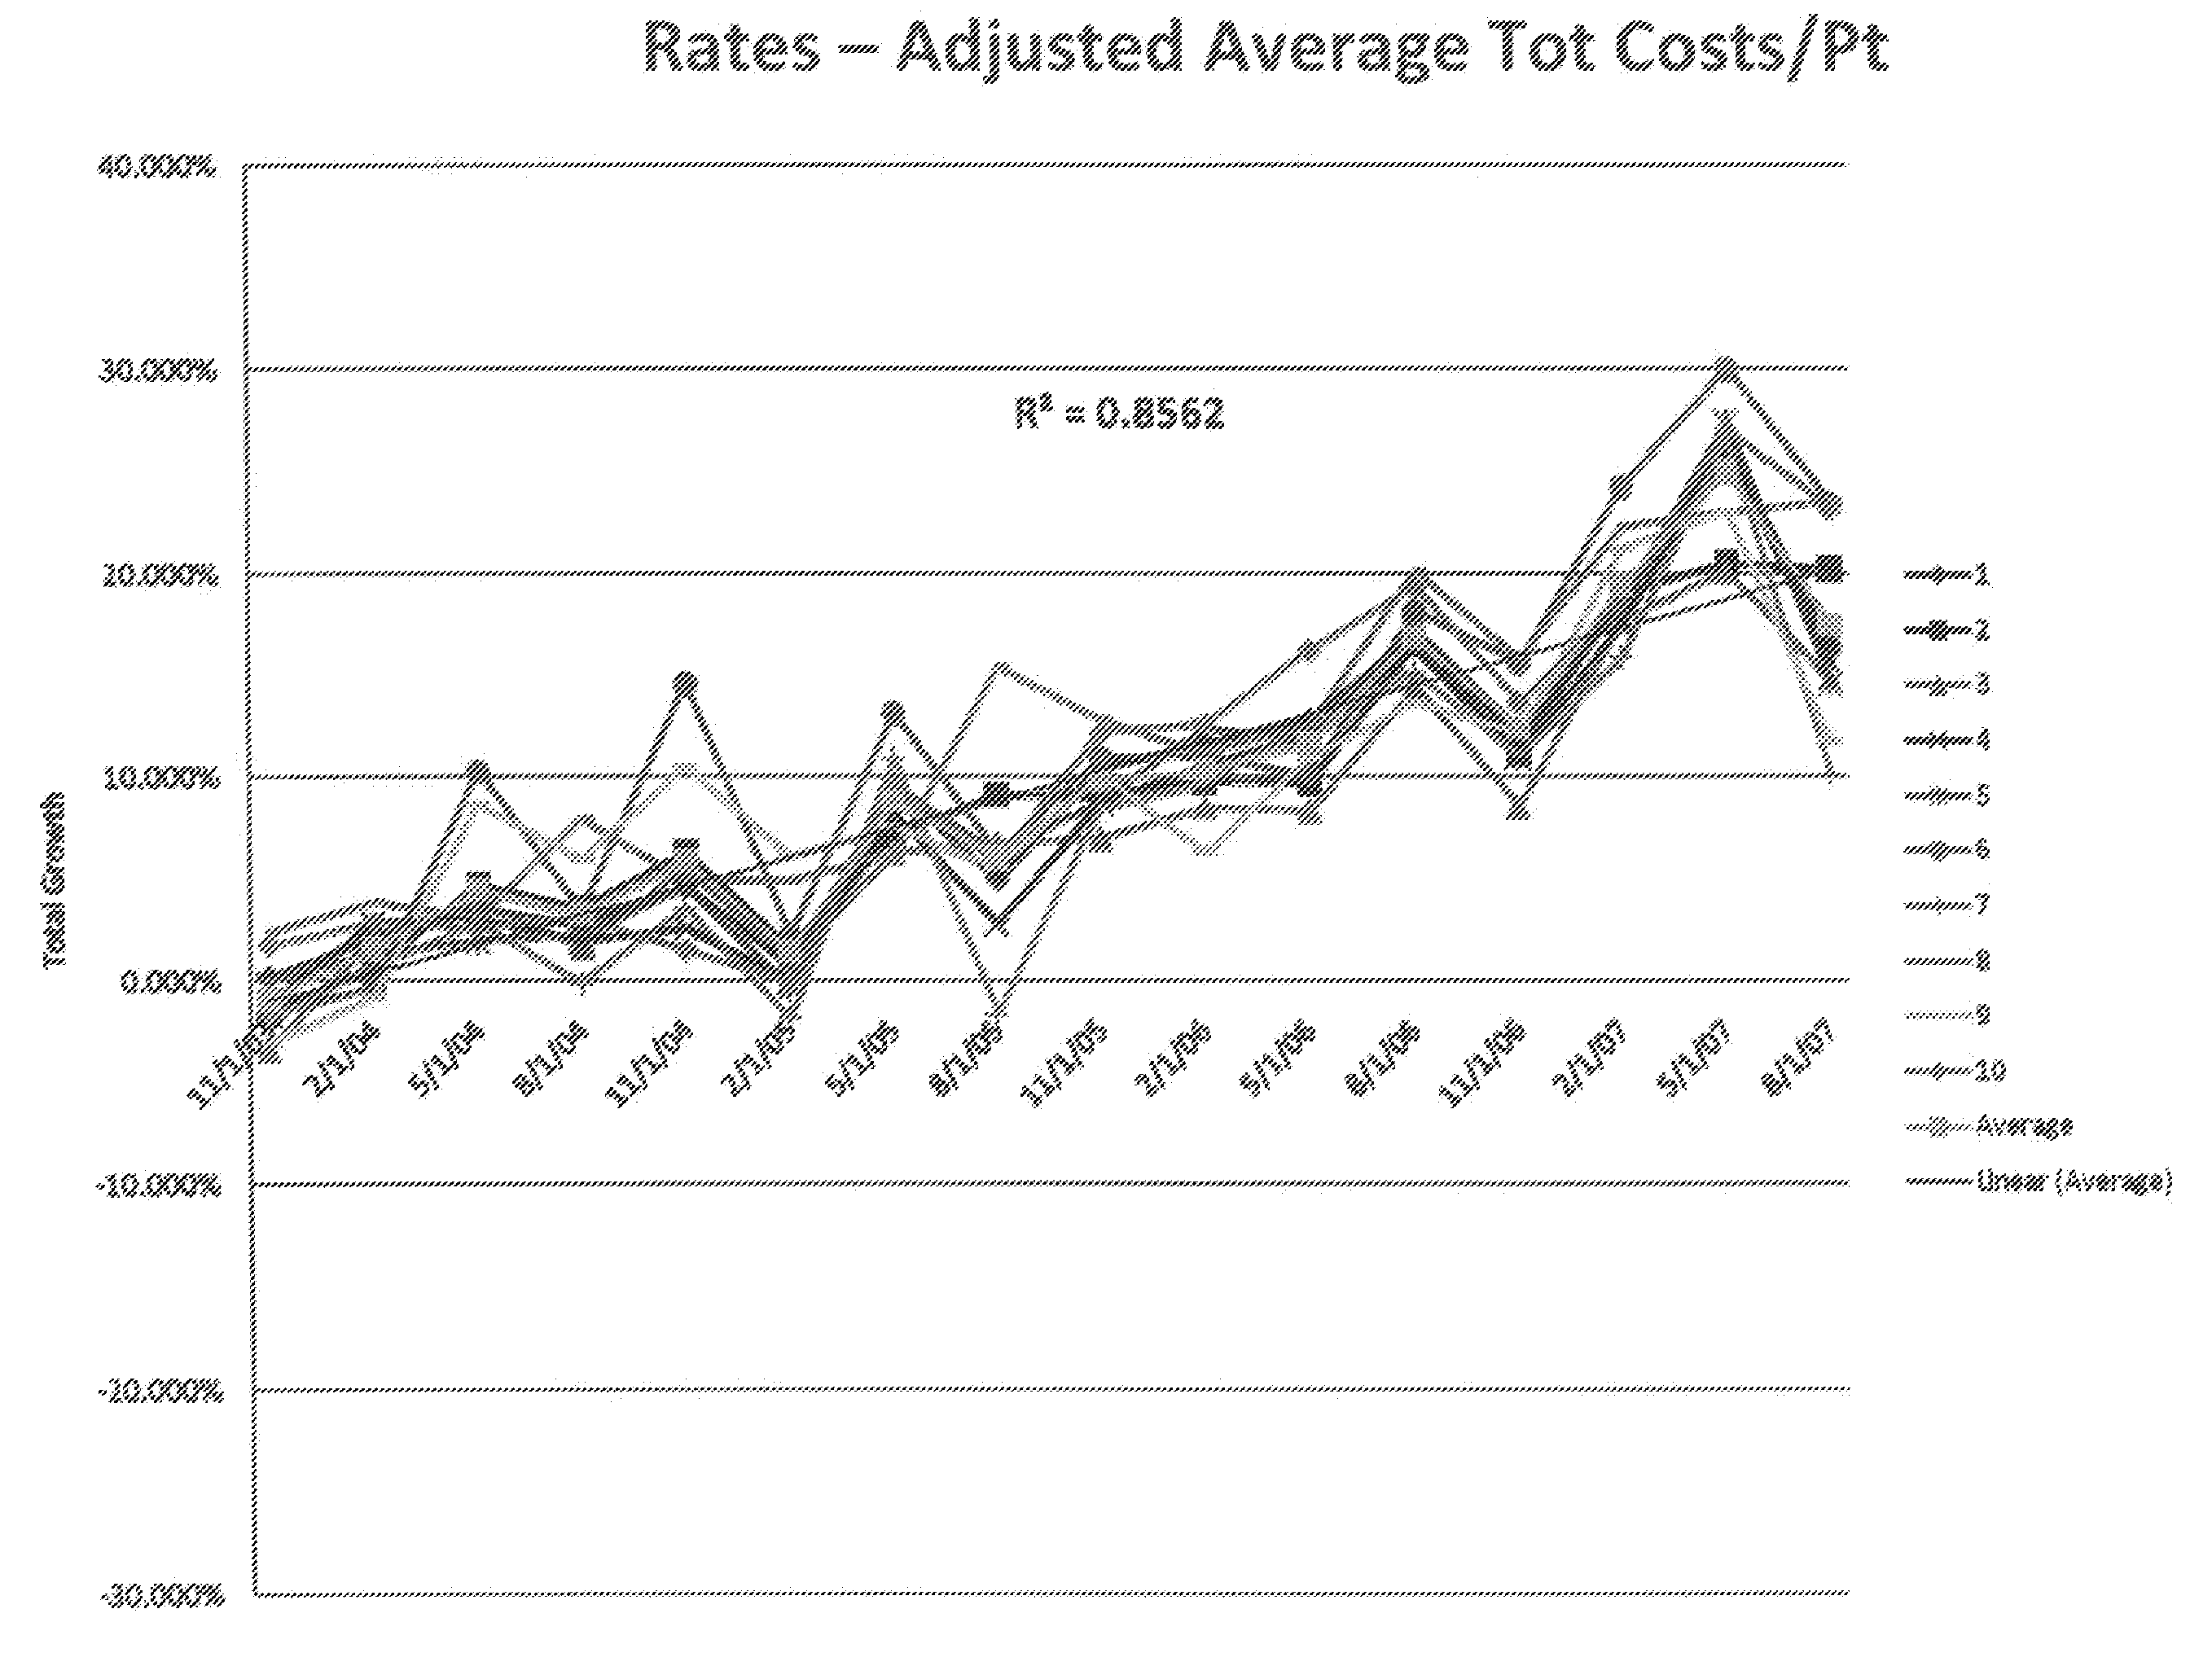
[0145]As an example of a preferred embodiment, an index of cancer healthcare (“CHC Index”) was constructed. FIG. 8 illustrates the 90 day unadjusted index values for performance outcome data as defined as the average total healthcare cost per patient, for patients seen at a medical center for inpatient treatment of their cancers. (Also shown in FIG. 8 is a trend line for the unadjusted index data)

[0146]The index was constructed for a portfolio of patients consisting of 11 clusters. The clusters were defined as a grouping of patients diagnosed with one of the following cancers: uterine, urinary bladder, prostatic, pancreatic, ovarian, non-Hodgkin's lymphoma, lung, leukemia, colorectal, breast, brain & other nervous system cancers. The Unadjusted Index Value consists of the sum of all weighted Cluster Outcomes for each cluster segment as follows:

Unadjusted Index Value(tn)=Σ(Cluster Outcome(i)*Q(i))(tn)

[0147]Wherein, cluster outcome (i) is the outcome value for cluste...

example 2

Comparing Different Healthcare Groups

[0158]In order to demonstrate an additional preferred embodiment, ten hypothetical oncology groups (i.e. MD groups) were compared for performance to treat patients by each MD group as measured by average total pharmaceutical costs per patient. Each MD group portfolio is composed of clusters consisting of patients diagnosed with different cancers. FIG. 12 is a bar graph showing the cluster composition for each MD Group. (Note, MD Group 11 has the same patient-mix as MD Group 1. However, MD Group 11's costs have been increased for the treatment of patients with leukemia and lung cancer).

[0159]FIG. 13 shows the average total pharmaceutical costs per patient for the ten hypothetical MD Groups for a single Time Period (tn). Additionally, FIG. 13 also shows the market portfolio index (plus / minus one standard deviation) as a shaded band. As can be seen in this figure, making comparisons between MD Groups having portfolios with varying patient-mix is dif...


PUM


Abstract

Articles of manufacture including electronic machines including but not limited to computers, computer stations, computing devices, computer systems, software, computer readable memory and other electronic devices adapted to provide an index for a performance characteristic or measure for groups of people or institutions. The index values are risk adjusted to the varying population compositions for groups of people or institutions by comparison to a reference portfolio and are updated in real time to account for the changing constitution of the clusters in the portfolios. Methods of using the disclosed devices include the ability to provide a continuously updated benchmark for the comparison of medical, business or educational performance by providers or practitioners of such services that effect populations of individuals, and that is based on measurable outcomes. Additionally, the methods of using the disclosed devices include the ability to compare the effectiveness of different therapies.

Description

STATEMENT REGARDING FEDERALLY SPONSORED APPLICATIONS[0001]N / ACROSS-REFERENCES TO RELATED APPLICATIONS[0002]N / ABACKGROUND[0003]Medical care providers, hospital and practice groups management, payors and insurers, among others have found it difficult t0 evaluate the level and reasonable expense of medical services as applied to a particular group of patients, institutions or practice groups, for example, because of the many variables involved in the health care system. Actuary tables, for example, are based on static, historical data that do not change in real time and do not provide a convenient way to adjust for individual circumstances of a provider's patient population. As medical insurers move to a pay for performance model, it is important that variability in patient populations or patient mix can be taken into account.[0004]A recent publication in the Journal of the American Medical Association: Mehta, et al., JAW, vol. 300[16], pgs. 1897-1903, Oct. 22 / 29, 2007, discusses the v...

Claims


Application Information

Patent Timeline
Patent Type & Authority Applications(United States)
IPC IPC(8): G06Q50/00G06Q10/00G06F17/30
CPCG06F17/30536G06Q50/22G06Q10/10G06F19/327G06Q40/08G16H40/20G06F16/2462
Inventor CAPELLI, CHRISTOPHER C.LITTLE, WILLIAM T.
Owner BOARD OF RGT THE UNIV OF TEXAS SYST
Why Eureka
Try Eureka