Methods and systems for high sigma yield estimation using reduced dimensionality

a technology of dimensionality reduction and estimation method, applied in the field of methods and systems for estimating the likelihood of statistical events, can solve the problems of failure rate of high-yielding integrated circuits, and achieve the effects of reducing the number of parameters, facilitating cluster formation, and improving accuracy

Inactive Publication Date: 2011-06-23
CADENCE DESIGN SYST INC
View PDF8 Cites 19 Cited by
  • Summary
  • Abstract
  • Description
  • Claims
  • Application Information

AI Technical Summary

Benefits of technology

[0005]Embodiments of the invention provide methods and systems for analysis and estimation of integrated circuit yield and other statistical events. In some embodiments, a screening test of the integrated circuit is carried out to identify failing clusters in the parameter space, which, in some cases, are disjoint. A second sampling is taken to provide more information in the failing regions, and a second test is carried out for determining the failure rate. In some embodiments, the number of parameters are reduced to facilitate cluster formation. Various methods of forming clusters and local probability distribution functions are also described. The methods and systems are also extended to analysis and estimation of other events that can be subject to statistical analysis. Embodiments of the present invention provide more accurate results at less computational cost than conventional techniques, especially for events of low probability. Such events include, for example, failure rates of high-yielding integrated circuits.

Problems solved by technology

Such events include, for example, failure rates of high-yielding integrated circuits.

Method used


Image

  • Methods and systems for high sigma yield estimation using reduced dimensionality
  • Methods and systems for high sigma yield estimation using reduced dimensionality
  • Methods and systems for high sigma yield estimation using reduced dimensionality

Examples


Embodiment Construction

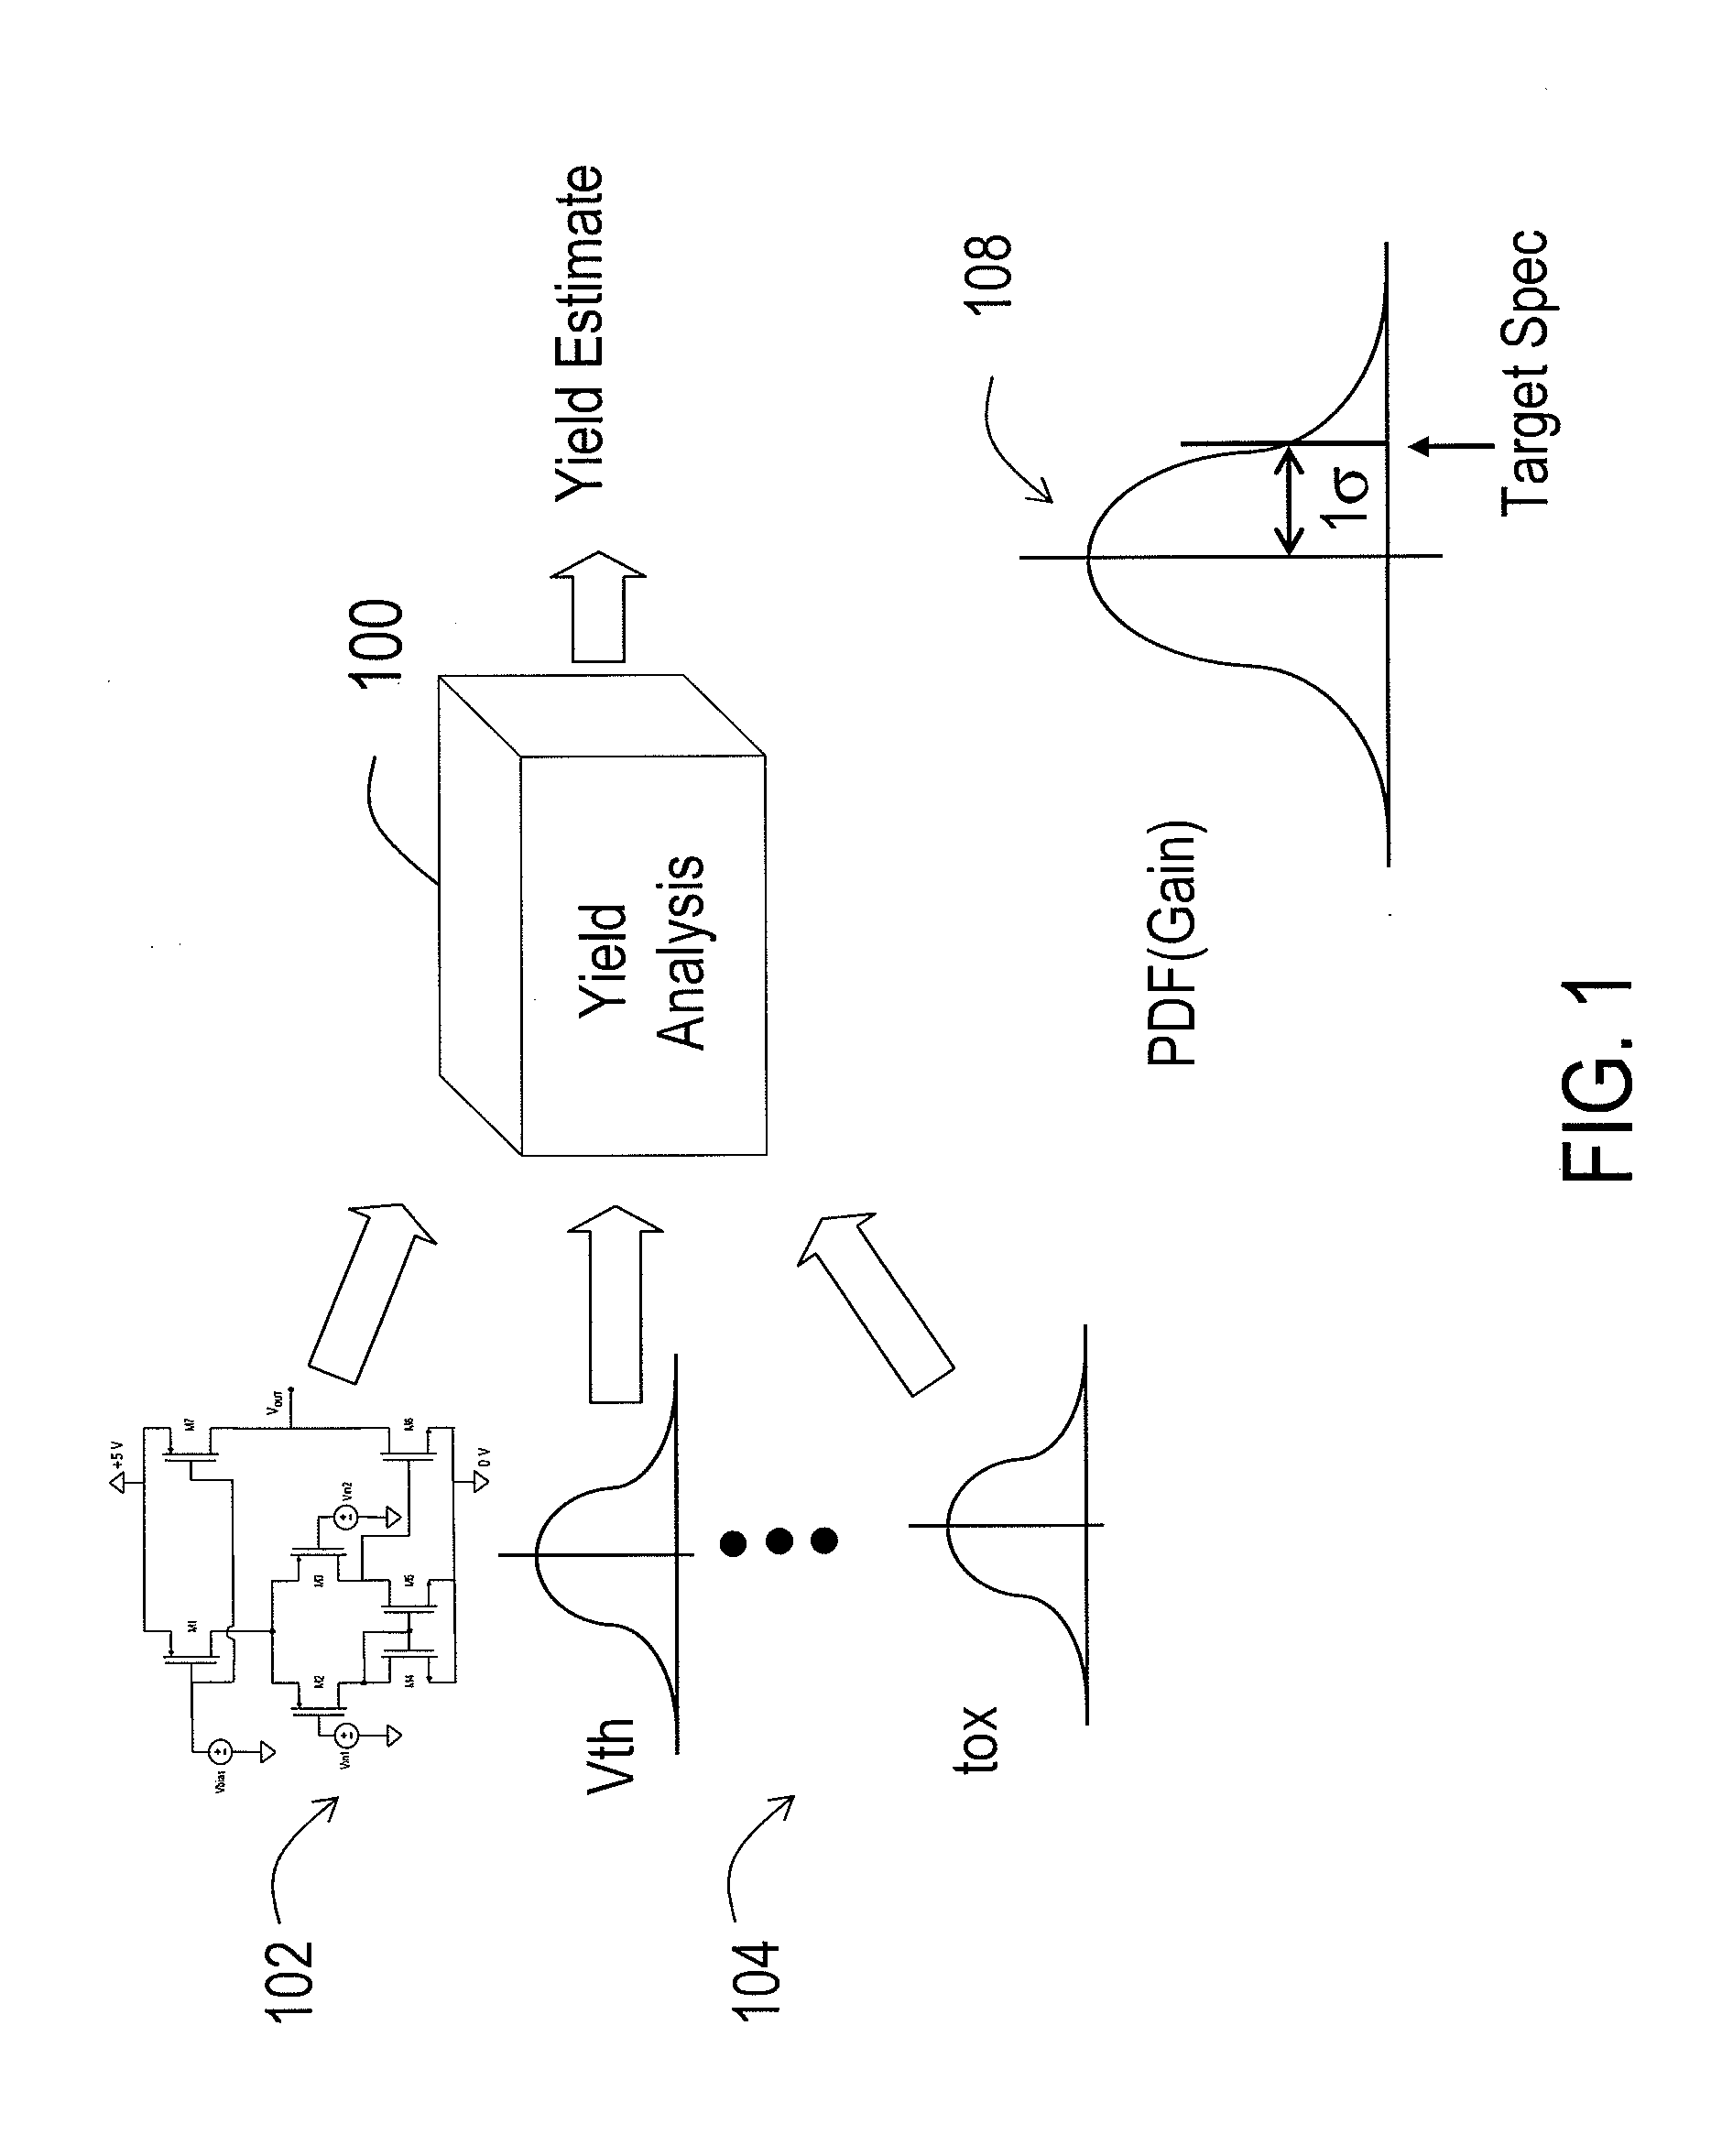
[0027]FIG. 1 is a simplified diagram illustrating an example of a yield analysis process. As shown, block 100 represents a yield analysis tool, which receives as inputs a description of an integrated circuit 102 and device parameters information 104 such as threshold voltage (Vth), gate oxide thickness (tox), and others. Here circuit description 102 can include a netlist, a schematic description, a high-level design language description such as Verilog, and other forms of circuit descriptions. Device parameter information can include statistical device data which can be described in probability distribution functions. Based on the input information, yield analysis tool 100 outputs a yield estimate. As an example, yield analysis tool 100 can determine a probability distribution function (PDF) of certain circuit performance measurements, for example, a gain of circuit 102, PDF(Gain), which is shown as 108 in FIG. 1. A yield can be reported as the percentage of samples having a gain th...


PUM


Abstract

For an integrated circuit associated with a first plurality of parameters whose values are described by a first probability distribution function, a method for estimating a failure probability includes selecting a first plurality of samples, performing a first test to determine an outcome for each of the first plurality of samples and identifying failed samples. A second plurality of parameters is selected that has fewer parameters than the first plurality of parameters. The failed samples are clustered in the space of the second plurality of parameters using a computer-implemented cluster forming method that, in some cases, returns multiple clusters. The method also includes forming a probability distribution function for each of the clusters, forming a composite probability distribution function that includes a weighted combination of the first probability distribution function and the probability distribution function for each of the clusters. The method further includes selecting a second plurality of samples using the composite probability distribution function and performing a second test to determine an outcome for each of the second plurality of samples. A failure probability can then be computed.

Description

CROSS-REFERENCES TO RELATED APPLICATIONS[0001]This application is related to concurrently filed U.S. application Ser. No. ______ (Attorney Docket No. 027957-001700US) by Tiwary, et. al, commonly owned, incorporated by reference herein in its entirety for all purposes.BACKGROUND OF THE INVENTION[0002]The present invention relates generally to methods and systems for estimating the likelihood of statistical events. More particularly, embodiments of the invention provide methods and systems for estimating the failure rate of high-yielding integrated circuits. The invention is also applicable to sampling and estimation in a wide range of applications.[0003]In integrated circuit applications, it is often desirable to achieve a very high yield. Therefore, there is a need for an effective method for yield estimation in the range of high yield. However, a high yield circuit has a low failure rate, and an accurate estimation of a high yield often require collecting samples of failure events ...

Claims


Application Information

Patent Timeline
Patent Type & Authority Applications(United States)
IPC IPC(8): G06F17/18
CPCG01R31/2894
Inventor TIWARY, SAURABHLIU, HONGZHOUZHANG, HUI
Owner CADENCE DESIGN SYST INC
Why Eureka
Try Eureka