

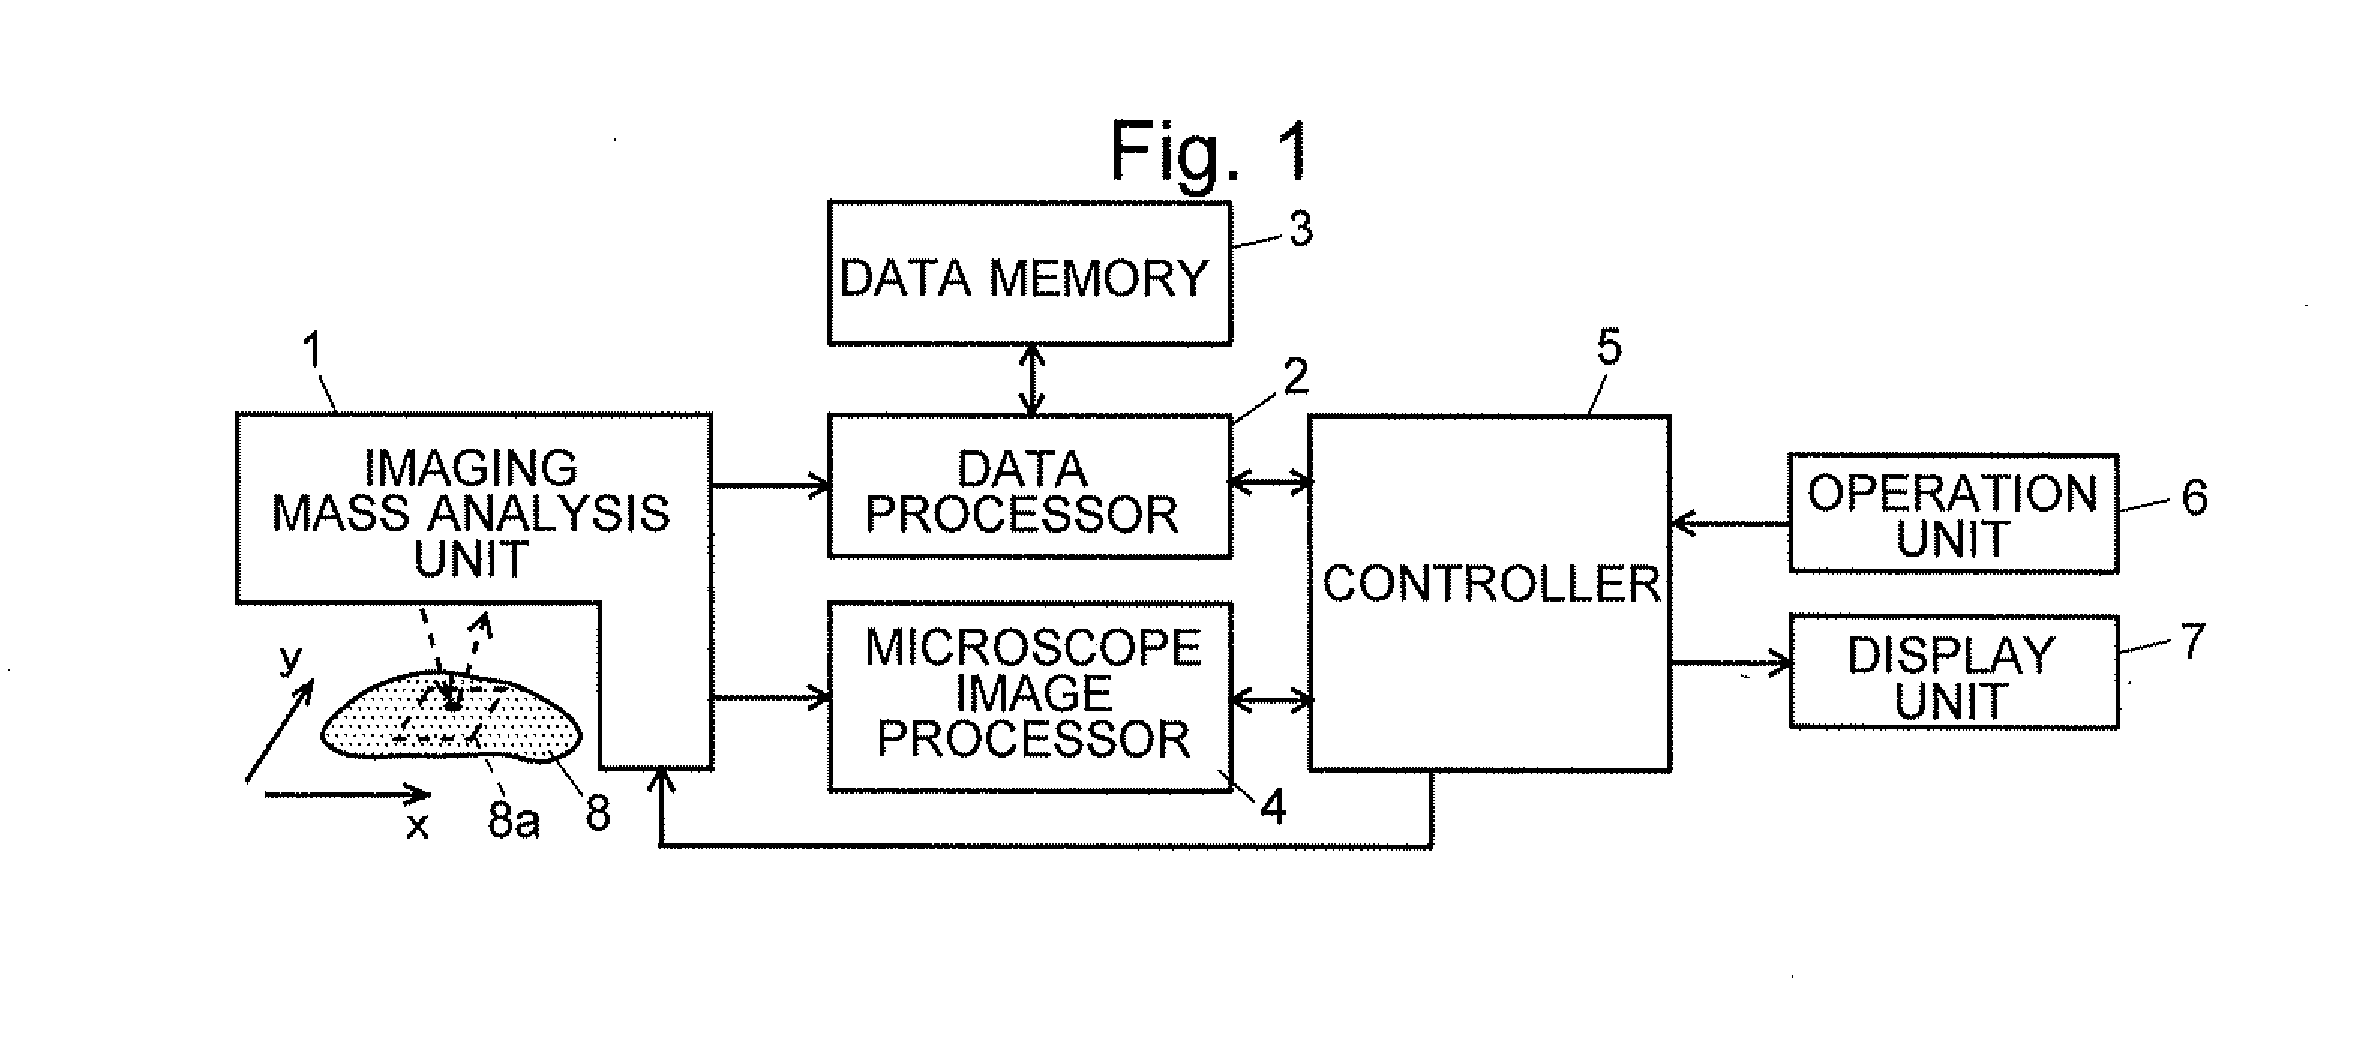
Method and Apparatus for Processing Mass Analysis Data
a mass analysis and data technology, applied in the field of mass analysis data processing methods and apparatuses, can solve the problems of large amount of data, large amount of labor and time, and inability to guarantee, and achieve the effects of facilitating the deduction of the kind of substance, reducing labor and time, and accurate recognition
- Summary
- Abstract
- Description
- Claims
- Application Information
AI Technical Summary
Benefits of technology
Problems solved by technology
Method used
Image

Examples
modification example
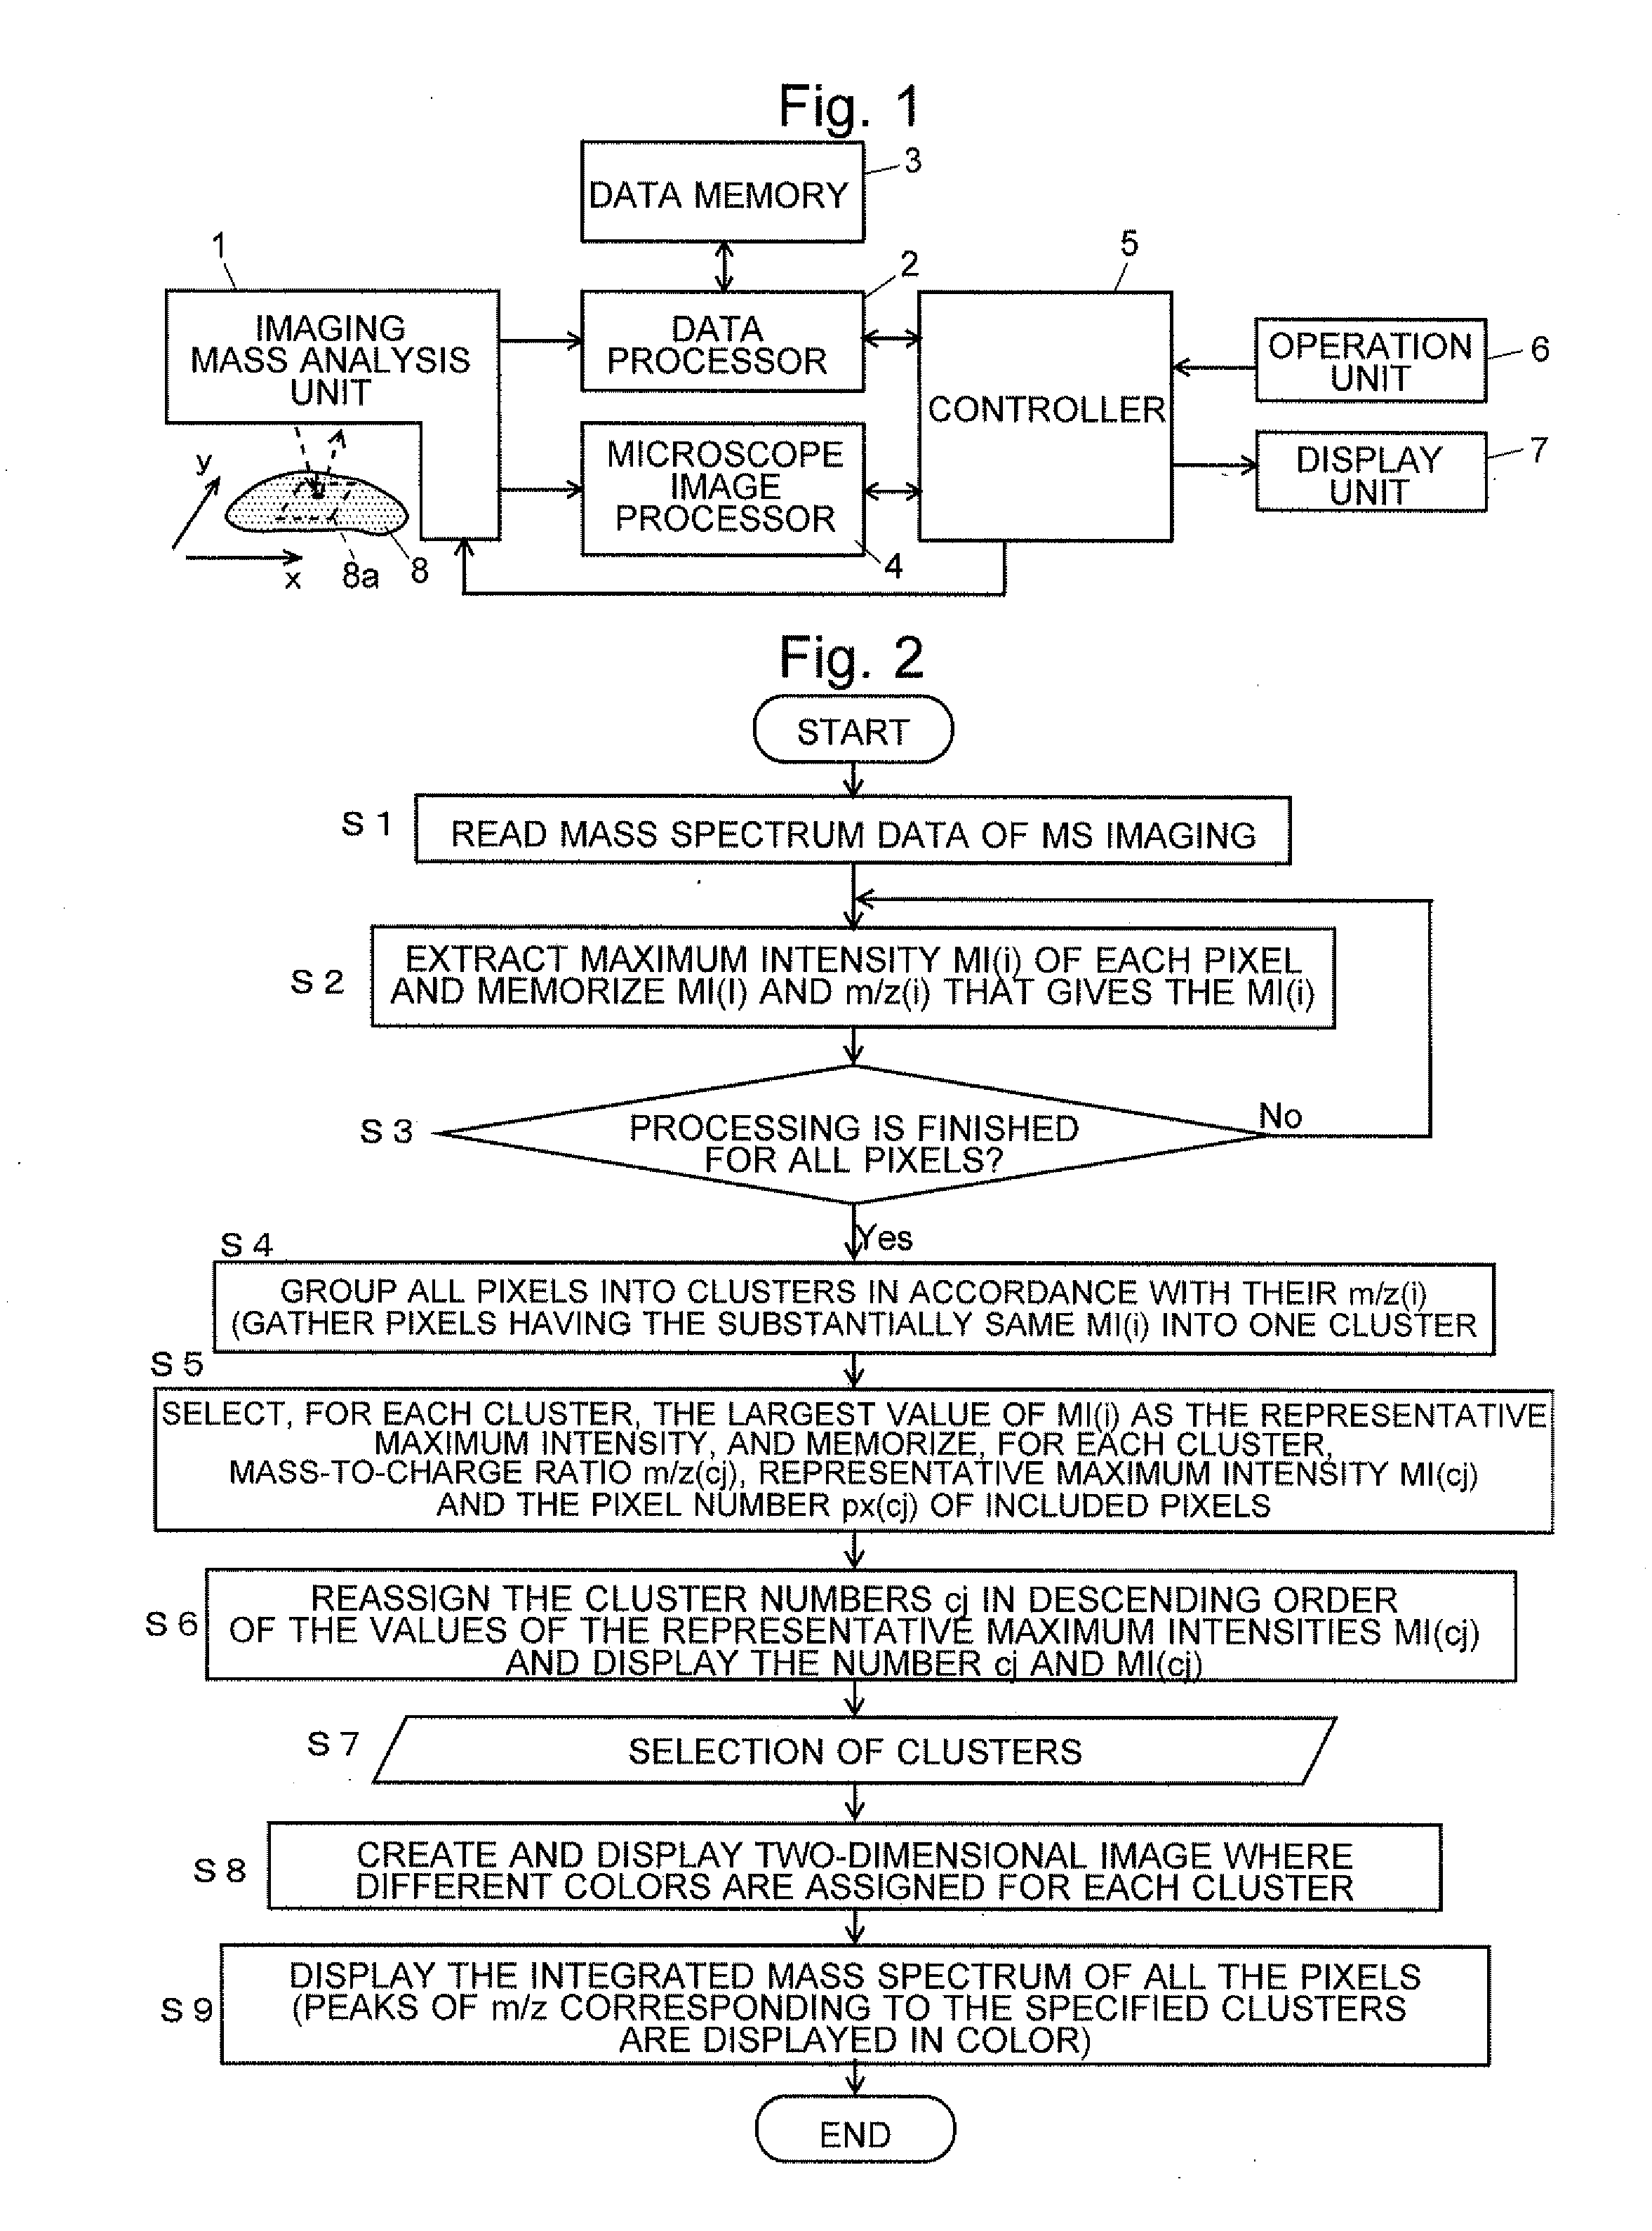
[0079]The data processing method described in the previous embodiment can be modified in the following manner for example.
[0080]In the previously described embodiment, the entire mass-to-charge ratio range of the obtained mass spectrum data is searched for a peak giving the maximum intensity MI(i). However, in some cases, it is possible to limit the mass-to-charge ratio range to be searched for the peak giving the maximum intensity MI(i). This can be achieved by modifying Step S2 of the flowchart shown in FIG. 2 so that the maximum intensity will be searched for within a limited mass-to-charge ratio range. This processing is effective when the mass-to-charge ratio range of the target substance is previously known. This saves a needless processing, which brings about advantageous effects such as: the shortening of the processing time or a reduction in the processing load on hardware devices (i.e. computer).
[0081]The same effect can also be obtained by excluding the mass-to-charge rat...
PUM
 Abstract
Description
Claims
Application Information