Flow cytometry-based systems and methods for detecting microbes

a flow cytometer and microorganism technology, applied in the field of methods to detect microorganisms, can solve the problems of time-consuming steps, assay methods, and the use of microbial dna amplification by polymerase chain reaction (pcr), and achieve the effect of optimizing the performance of a flow cytometer, increasing the sensitivity of at least one detection channel, and increasing the gain

Active Publication Date: 2011-09-08
UNITED STATES OF AMERICA +1
View PDF8 Cites 23 Cited by
  • Summary
  • Abstract
  • Description
  • Claims
  • Application Information

AI Technical Summary

Problems solved by technology

Current methods to detect microbes from a sample usually involve time-consuming steps, such as culturing and / or nucleic acid amplification.
For instance, microbial DNA amplification by polymerase chain reaction (PCR), which is used in many assay methods, may take upwards of several hours.
Likewise, the culturing of microbes in a sample may take several days or even weeks.
The results obtained from such assays are typically non-quantitative.
In addition, culturing and nucleic acid amplification techniques are prone to yield false positive as well as false negative results.
For instance, conventional detection methods may lack the sensitivity required to detect on the order of about 5-10 microbial cells in a sample.
Detection is further problematic when non-target microbes are co-present with the target microbes.
Challenges associated with sample analysis also become even more difficult when samples are derived from complex sources, such as, for example, dilute liquid solutions, biological samples and processed food sources (e.g., peanut butter).
The collection of microbial samples from various sources also presents certain challenges, as many conventional collection techniques do not provide a sufficiently sterile environment to avoid introducing microbial contamination.
Such standard collection methods may be especially impractical for collecting and preserving samples with very few target microbes of interest.
However, such methods also have limitations because many samples have natural fluorescence as well as background particles that can reduce the certainty that detected signals represent the microbes of interest.
Furthermore, the calibration, standardization, and general operation of flow cytometers to yield consistent results can provide challenges, especially to users with limited expertise in flow cytometry.

Method used


Image

  • Flow cytometry-based systems and methods for detecting microbes
  • Flow cytometry-based systems and methods for detecting microbes
  • Flow cytometry-based systems and methods for detecting microbes

Examples


experimental examples

The following examples are provided to more fully illustrate some of the embodiments disclosed hereinabove. It should be appreciated by those of ordinary skill in the art that the techniques disclosed in the examples which follow represent techniques that constitute exemplary modes for practice of the disclosure. Those of ordinary skill in the art should, in light of the present disclosure, appreciate that many changes can be made in the specific embodiments that are disclosed and still obtain a like or similar result without departing from the spirit and scope of the disclosure.

In the examples that follow, the flow cytometry methods set forth hereinabove are collectively referred to as RAPID-B or LRB methods.

example 1

Flow Cytometry Evaluation of E. Coli in Bagged Salad, Cookie Dough and Salami

Bagged salad, cookie dough and salami were procured from various grocery markets. Each sample was prepared for testing in accordance with the FDA Bateriological Analytical Manual (BAM) Chapter 4a the day before testing. All prepared sample weights were 25 grams, weighed before the inoculation or the addition of enrichment broth. All samples for a given product type were ‘made-up’, mixed and tested as a single batch. The BAM specified 9:1 proportion of growth media to sample was observed in all testing. EHEC Enrichment broth mTSB (modified Tryticase Soy Broth, BAM Option 1) was used for all reference testing. Spiking inoculation levels were verified by a 5 PCA plate array for each inoculation level; inoculation levels were calculated based on the average of the results from the array.

All product samples were spiked with non-Shiga toxin producing E. coli O157:H7, ATCC reference code 43888. Samples of salami a...

example 2

Flow Cytometry Evaluation of E. coli in Spinach, Jalepeño Peppers and Ground Beef

Spinach, jalapeno peppers and ground beef were procured from various grocery markets. Sample preparation and data acquisition for both the RAPID-B and Reference Methods were performed essentially as outlined in Example 1.

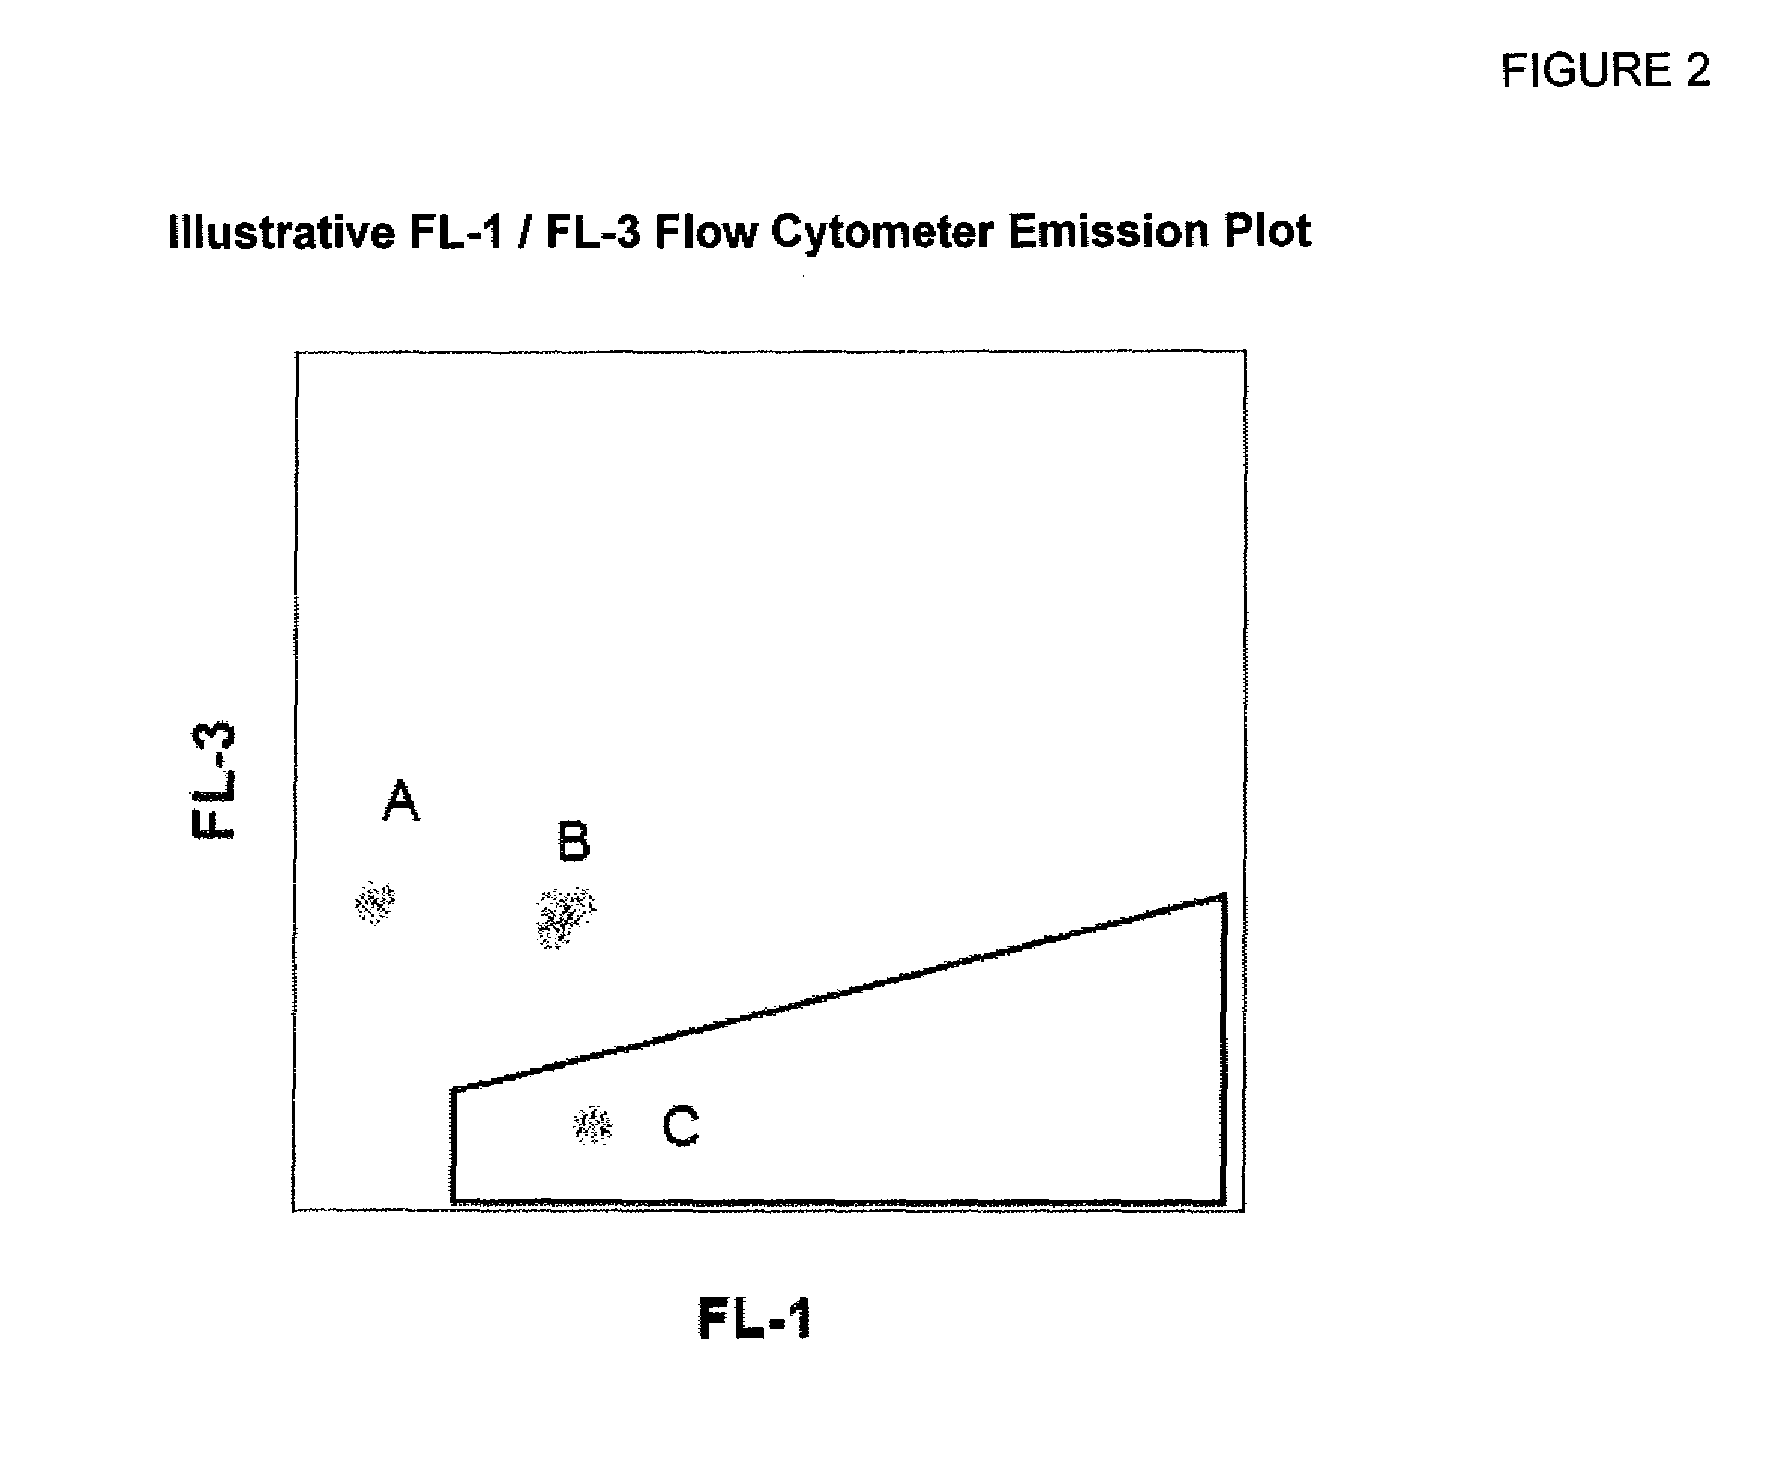
Testing results for spinach, jalepeño peppers and ground beef are summarized in Tables 7-9. FIGS. 12A and 12B present illustrative gated flow cytometry emission plots obtained by RAPID-B methods for jalepeño pepper matrices at various dilution levels. FIG. 13 presents an illustrative gated flow cytometry emission plot for a negative control jalepeño pepper matrix. Sensitivities and false negative rates comparable to those of Example 1 were observed. The Reference Method in this case produced a false positive for sample B-7.

TABLE 7E. coli 0157 Testing of Spinach Using RAPID-B Flow Cytometry MethodsApprox.Approx.Inocul.Inocul.Qualitative ResultVol.BAMLRBFinalFinalLRB Cell CountBrothSample...


PUM

PropertyMeasurementUnit
wavelengthaaaaaaaaaa

Abstract

In various embodiments, the present disclosure describes methods and systems for detecting microbes in a sample. The methods are generally applicable to quantifying the number of target bacteria in a sample counted from a detection region of a flow cytometer histogram. The detection methods can be employed in the presence of other microorganisms and other non-target microbe components to selectively quantify the amount of a target microbe. The methods are advantageous over those presently existing for testing of foodstuffs and diagnostic evaluation in their speed, accuracy and ease of use. Various swab collection devices and kits useful for practicing the present disclosure are also described herein.

Description

STATEMENT REGARDING FEDERALLY-SPONSORED RESEARCHNot applicable.BACKGROUNDCurrent methods to detect microbes from a sample usually involve time-consuming steps, such as culturing and / or nucleic acid amplification. For instance, microbial DNA amplification by polymerase chain reaction (PCR), which is used in many assay methods, may take upwards of several hours. Likewise, the culturing of microbes in a sample may take several days or even weeks. The results obtained from such assays are typically non-quantitative. In addition, culturing and nucleic acid amplification techniques are prone to yield false positive as well as false negative results.The aforementioned challenges in detecting microbes are further amplified when very few target microbes of interest are present within a particular sample. For instance, conventional detection methods may lack the sensitivity required to detect on the order of about 5-10 microbial cells in a sample. Detection is further problematic when non-tar...

Claims


Application Information

Patent Timeline
Patent Type & Authority Applications(United States)
IPC IPC(8): C12Q1/70G01N21/75C12Q1/68B82Y15/00
CPCC12Q1/06G01N1/38G01N15/1459G01N2015/1402G01N33/56911G01N2001/028G01N33/569Y10T436/101666Y02A50/30C12Q1/04G01N15/1012G01N15/1434G01N21/6486G01N2201/06113G01N2201/127
Inventor BUZATU, DAN A.WILKES, JON G.MOSKAL, TED A.NEVIUS, BILLTAYLOR, JASON T.TUCKER, RANDAL K.MILLER, MELINDARAMSANOOP, SHAWN
Owner UNITED STATES OF AMERICA
Why Eureka
Try Eureka