Shaped Compressed Pellets for Slow Release of Well Treatment Agents Into a Well and Methods of Using Same
- Summary
- Abstract
- Description
- Claims
- Application Information
AI Technical Summary
Benefits of technology
Problems solved by technology
Method used
Image
Examples
example 1
[0062]About 800 g of 10 / 50 mesh diatomaceous earth (Celite MP-79) absorbent was added into a mixing bowl. A paddle mixer blade was attached and liquid organophosphate (Solutia Dequest 2000) was added to the mixing bowl at a rate in which the liquid was readily absorbed, and the liquid did not puddle. After all of the liquid was added, mixing was continued until a homogenous blend was produced. The blend was then dried at 225 F until the percent moisture of the resulting product was less than 3%. The composite thus prepared contained 25 percent by weight of organophosphate scale inhibitor
[0063]To the composite was then added a binder of an epoxy resin (A), phenolic resin (B) and polyvinyl alcohol (C). The mixture contained about 50 percent by weight of the resin. The mixture was then compressed under a pressure of about 250 psi for about 1 minute in a mold to render a cylindrical pellet resembling a hockey puck having a diameter of about 1 inch and a thickness of about 0.5 inch to re...
example 2
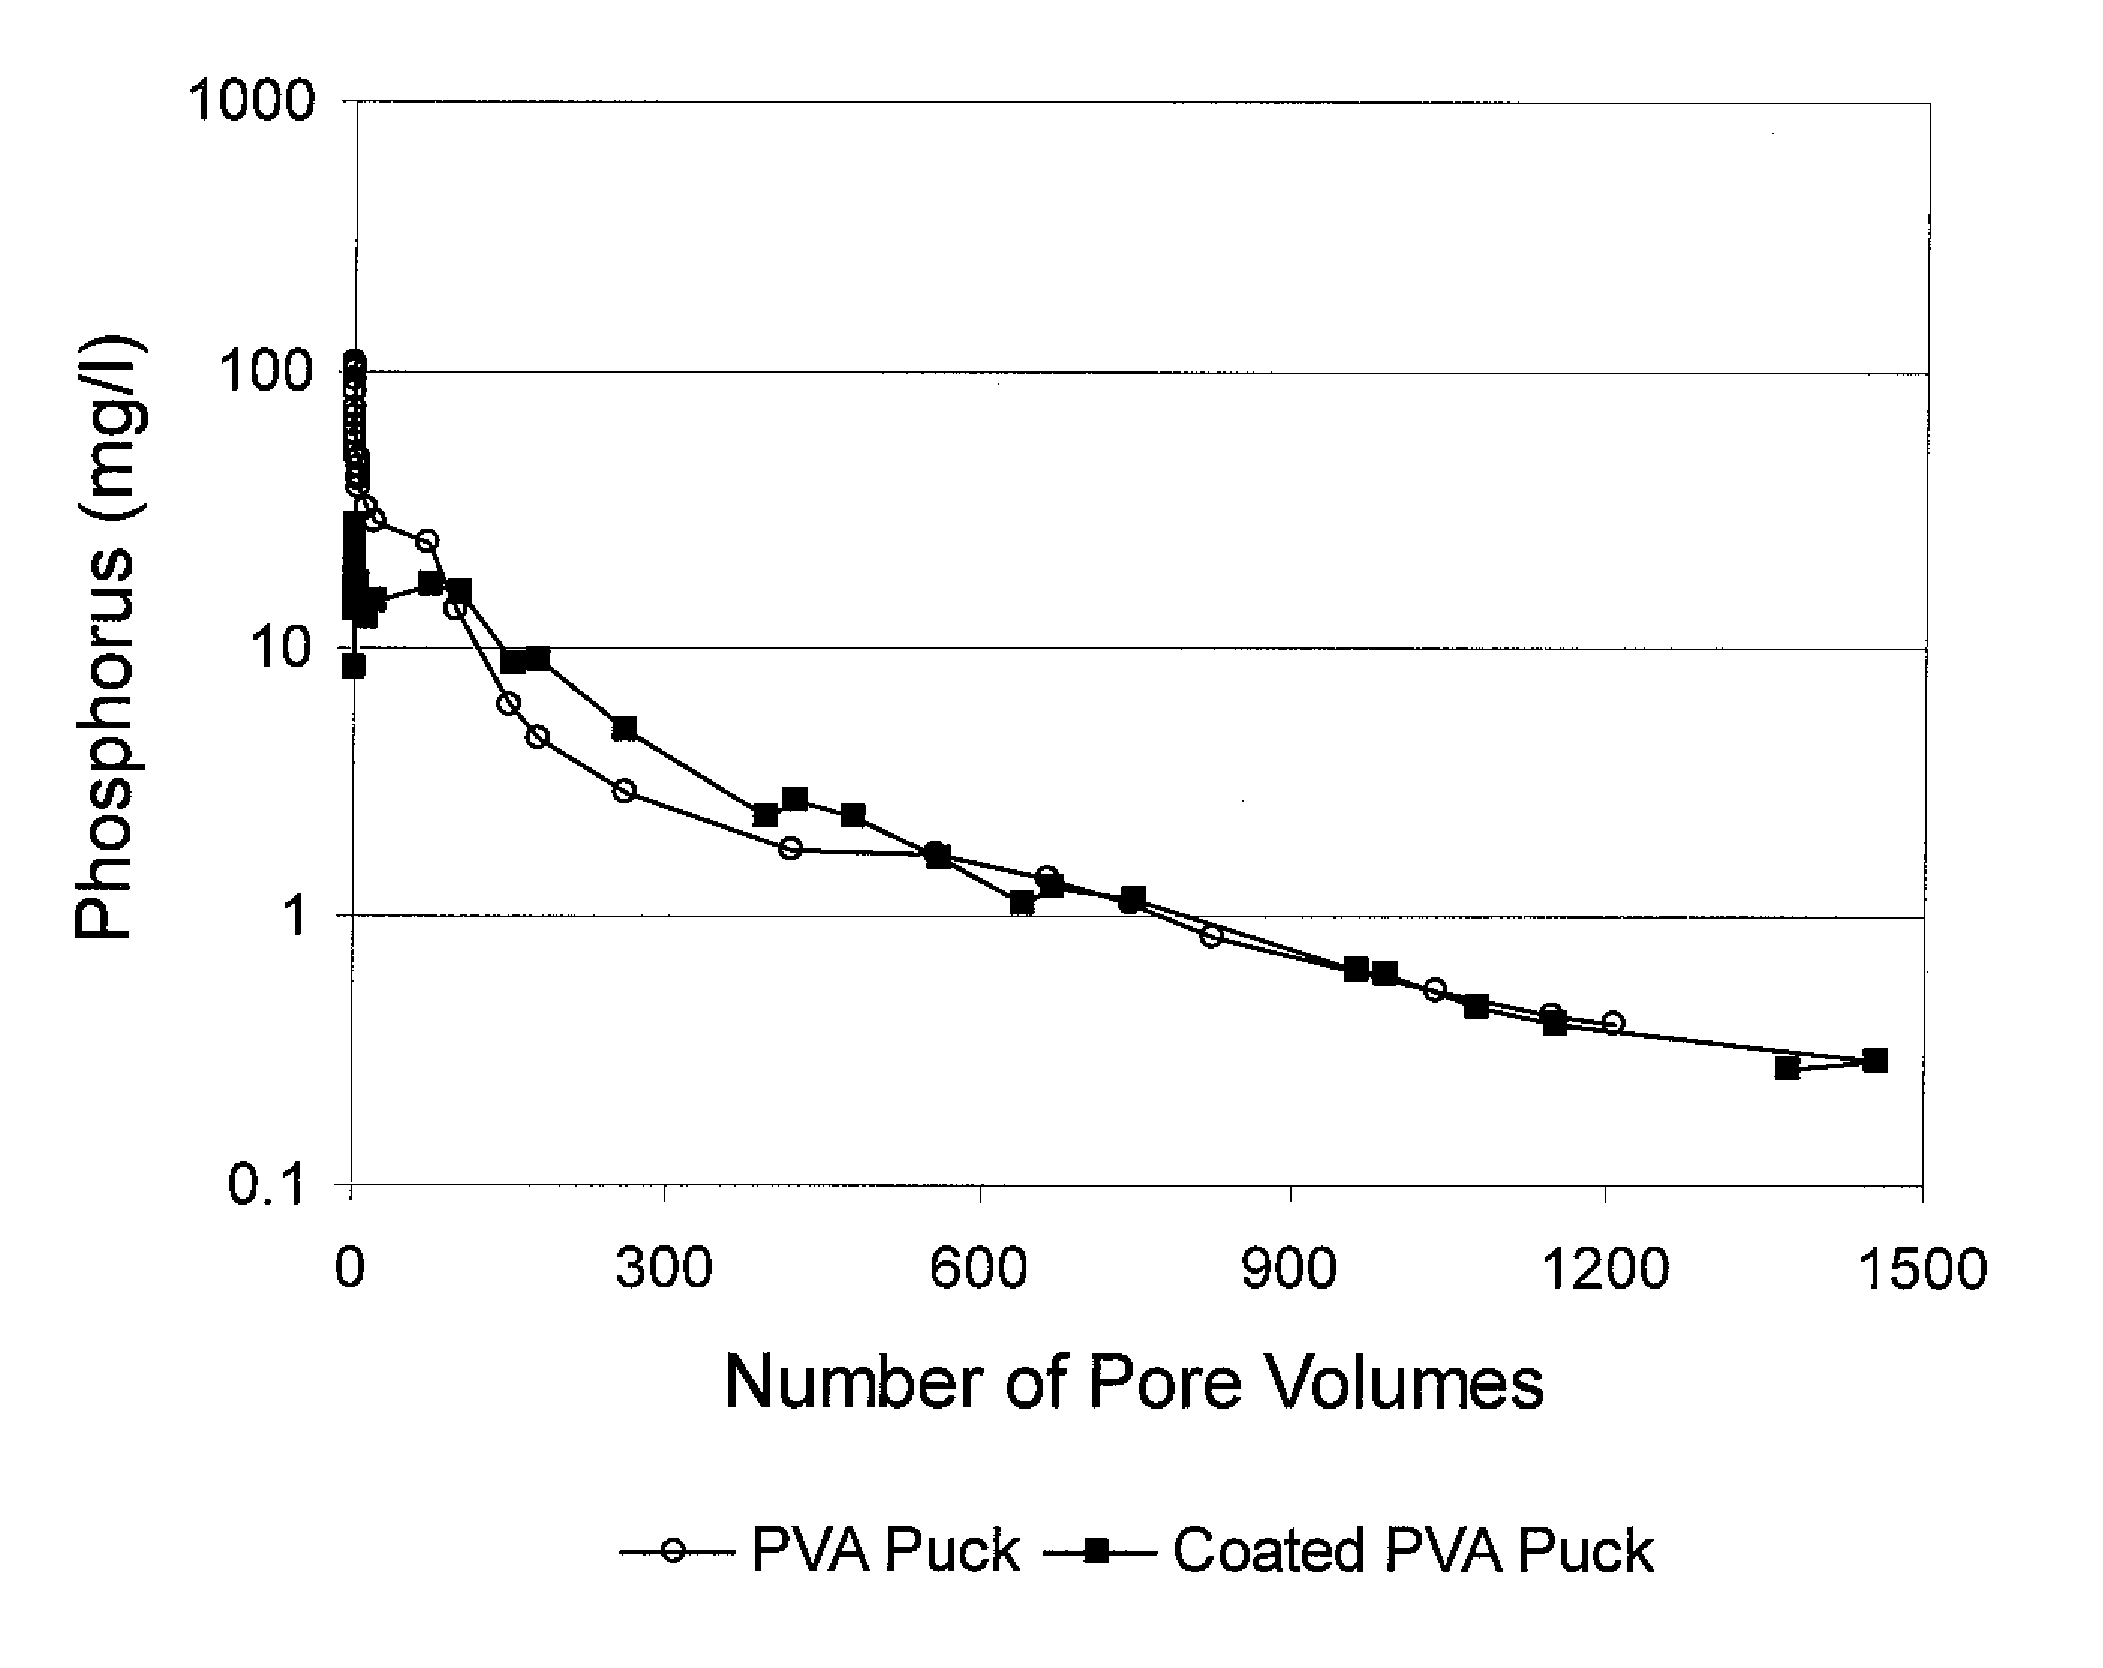
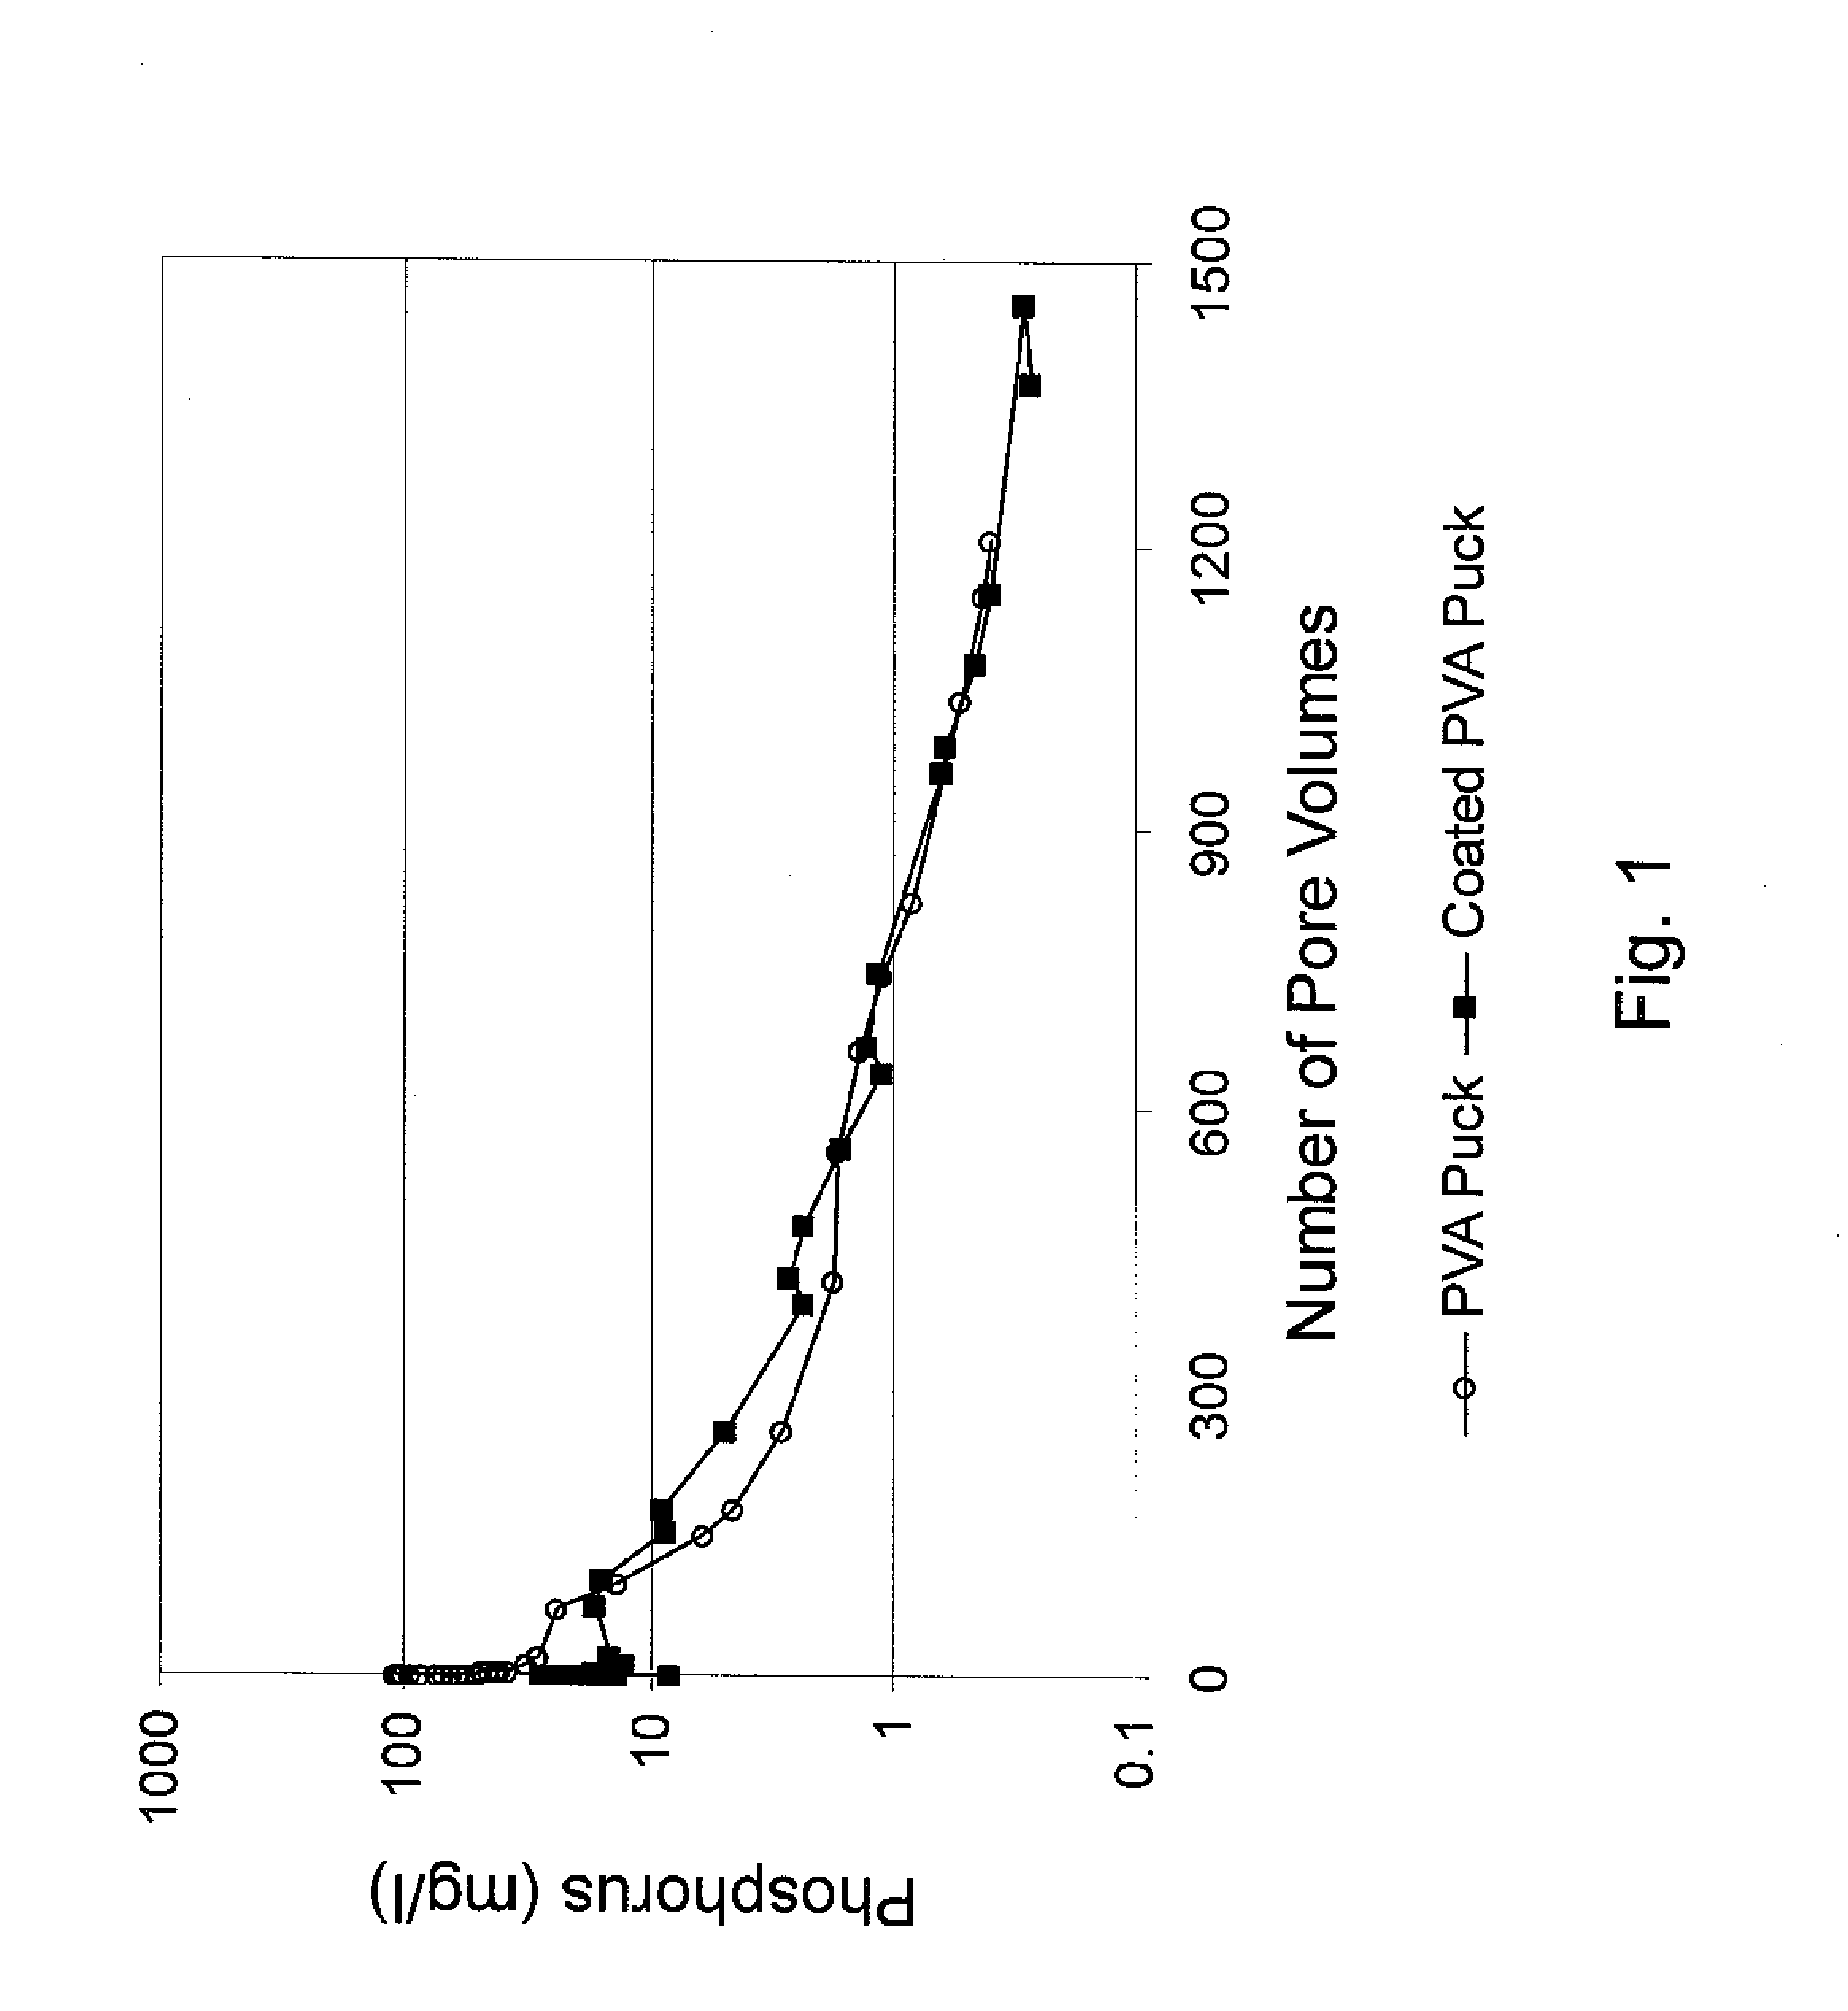
[0064]The elution characteristics of Puck C and Puck D were then determined by packing approximately 440 grams 20 / 40 Ottawa white frac sand and 3 pieces of the pucks into a 30 cm length stainless steel column (ID=3.48 cm). The pore volume of the column was approximately 80 milliliters. The column was eluted with a synthetic brine (0.025 mol / L CaCl2, 0.015 mol / L NaHCO3, 1 mol / L NaCl, sparged with 100% CO2) at 60° C. at a flow rate of 270 ml / hour. The effluent solution was collected and analyzed for phosphorus and calcium concentration to obtain the inhibitor flow back curve, set forth in FIG. 1. As illustrated in FIG. 1, the concentration of phosphorus in the effluent gradually decreased as synthetic brine was pumped into the column. After 1200 pore volumes of return flow, the concentration of effluent phosphorus remained approximately 0.4 ppm. There was no significant difference found between the phosphorus return curves of Puck (C) and Puck (D). The data demonstrates the ease that ...
example 3
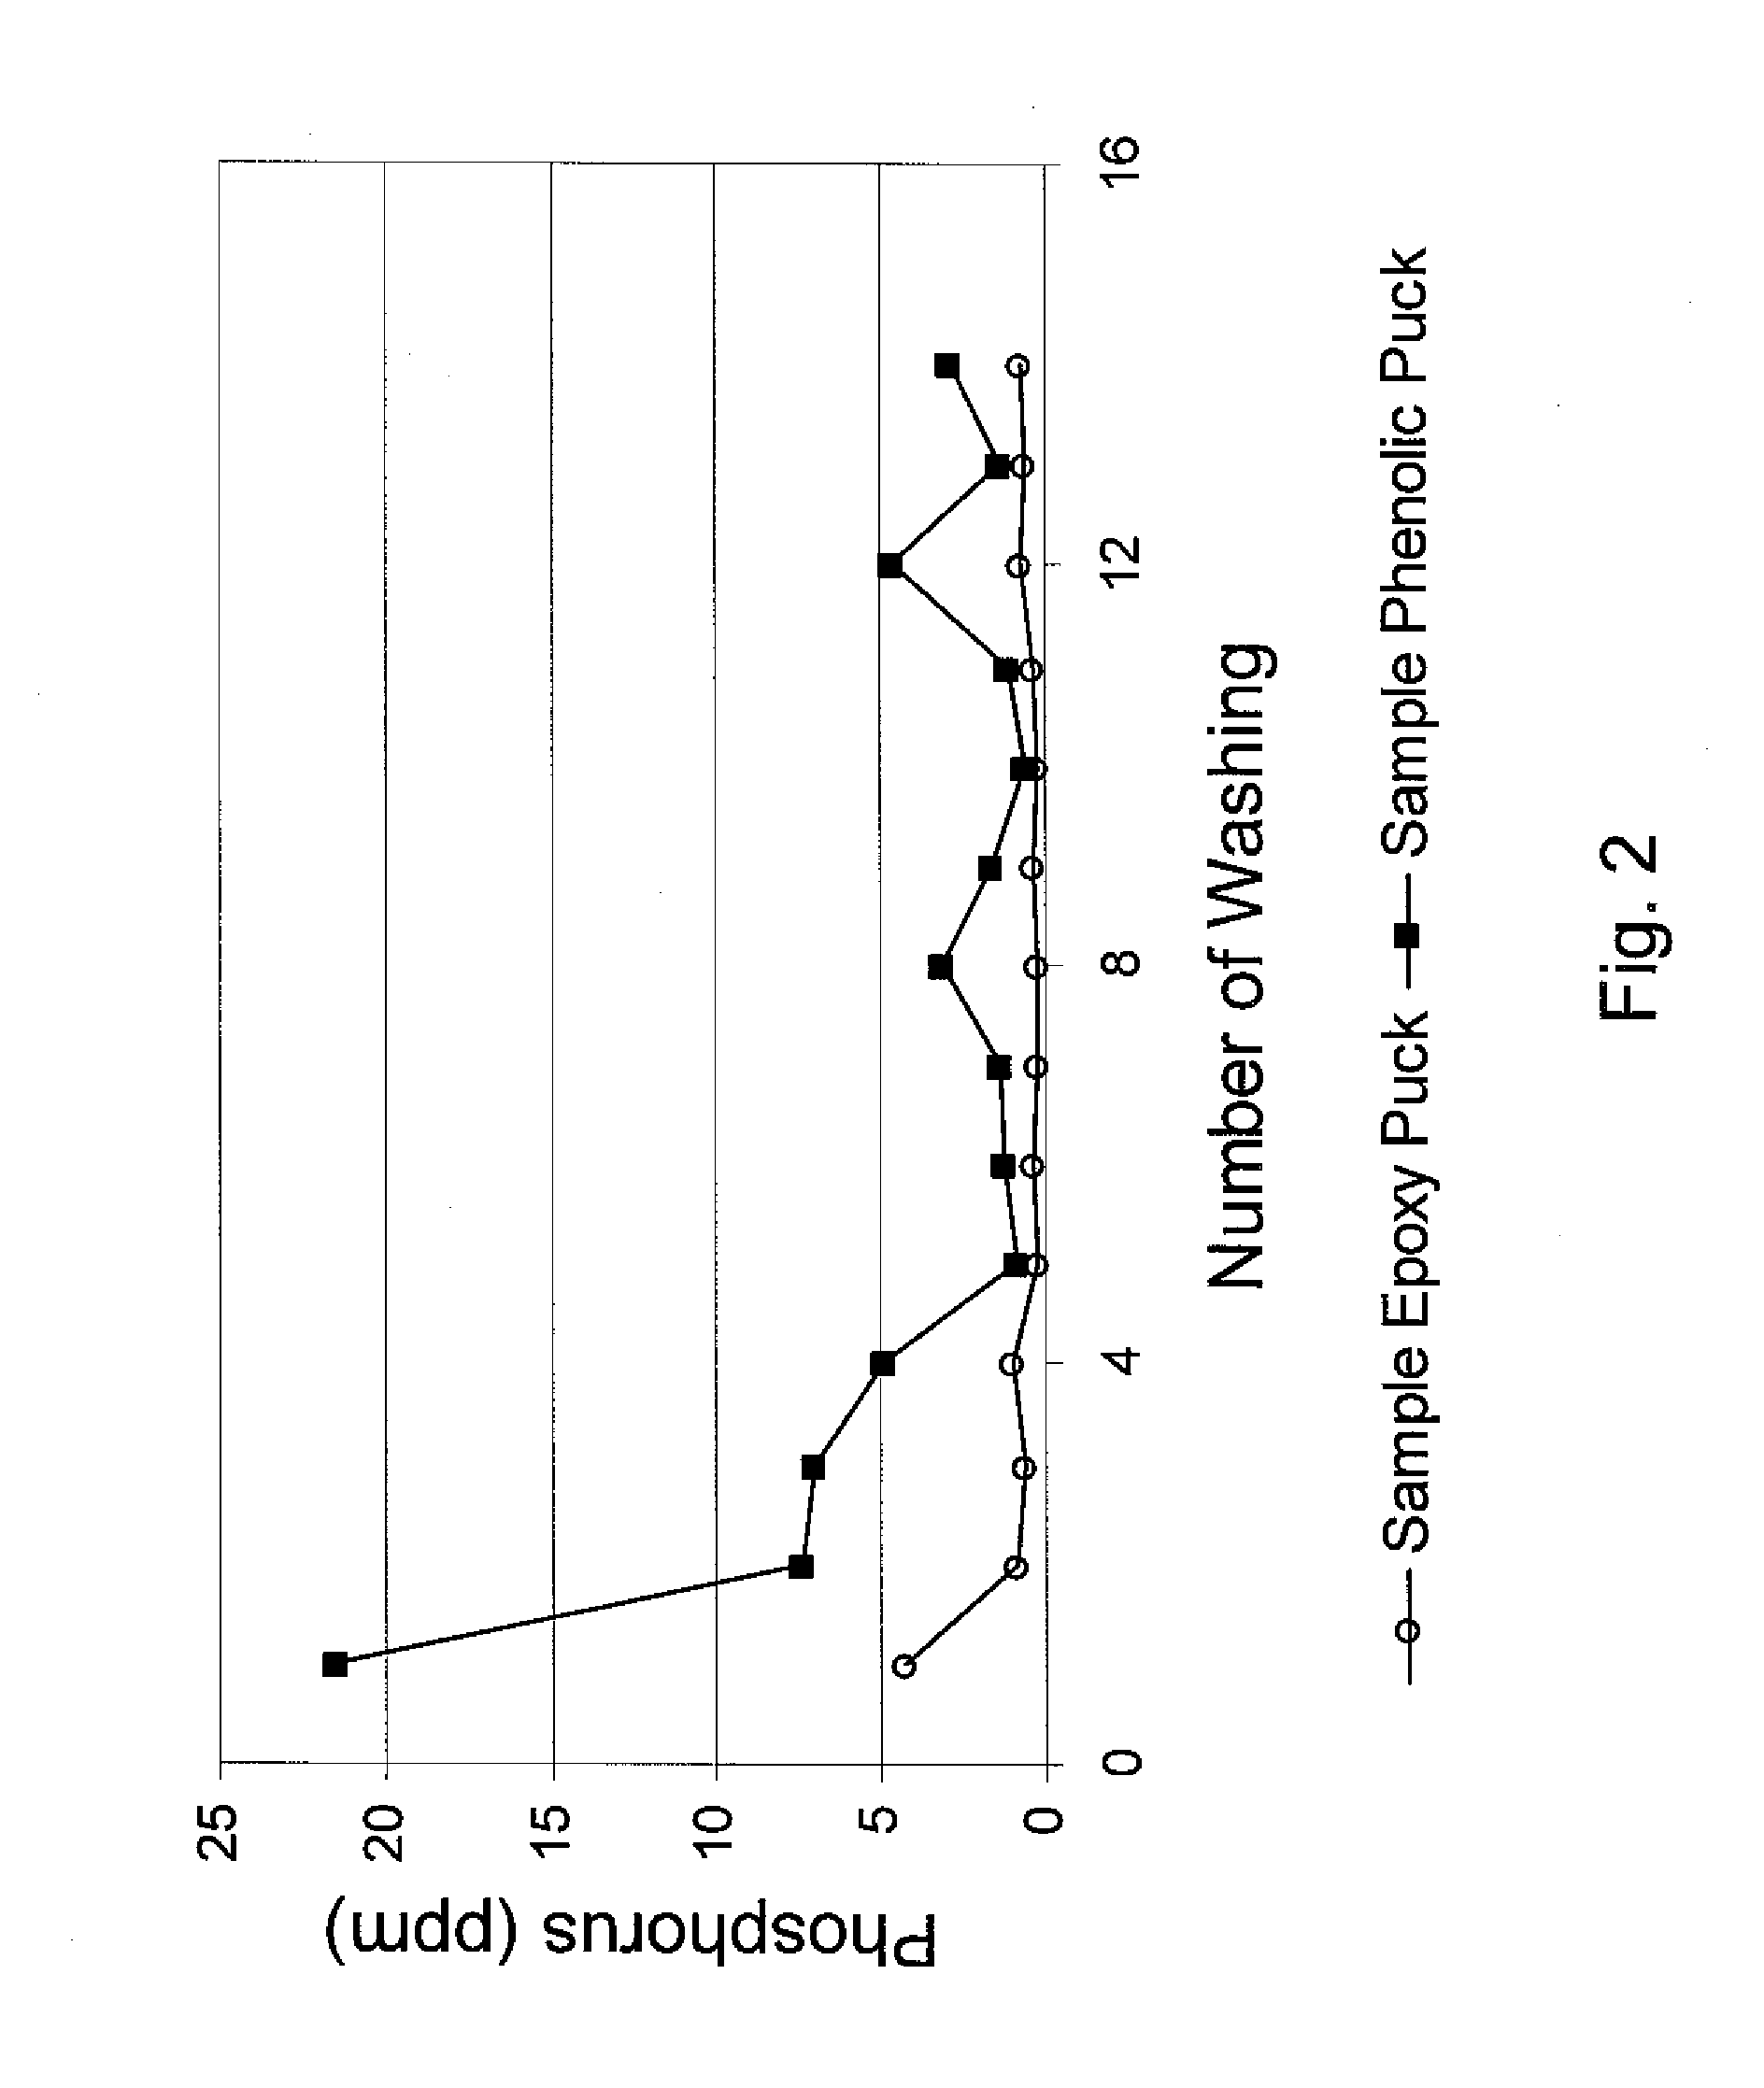
[0065]Puck (A) and Puck (B) were mixed with 500 ml of water. After 30 minutes, the supernatant was removed and the concentration of phosphorus in the supernatant was measured by (ICP) spectrophotometer. The test was repeated 14 times. The amount of residual phosphorous in the supernatant, illustrated as the static breaker test, is illustrated in FIG. 2. FIG. 2 demonstrates that the concentration of phosphorus in the effluent concentration of Puck (B) was higher than that of sample Puck (A) after washing with tap water.
PUM
 Abstract
Description
Claims
Application Information
 - R&D
- Intellectual Property
- Life Sciences
- Materials
- Tech Scout
- Unparalleled Data Quality
- Higher Quality Content
- 60% Fewer Hallucinations
Browse by: Latest US Patents, China's latest patents, Technical Efficacy Thesaurus, Application Domain, Technology Topic, Popular Technical Reports.
© 2025 PatSnap. All rights reserved.Legal|Privacy policy|Modern Slavery Act Transparency Statement|Sitemap|About US| Contact US: help@patsnap.com


