
Tire uniformity through dispersion optimization

Active Publication Date: 2012-02-09
MICHELIN RECH & TECH SA +1
View PDF4 Cites 22 Cited by
  • Summary
  • Abstract
  • Description
  • Claims
  • Application Information

AI Technical Summary

Benefits of technology

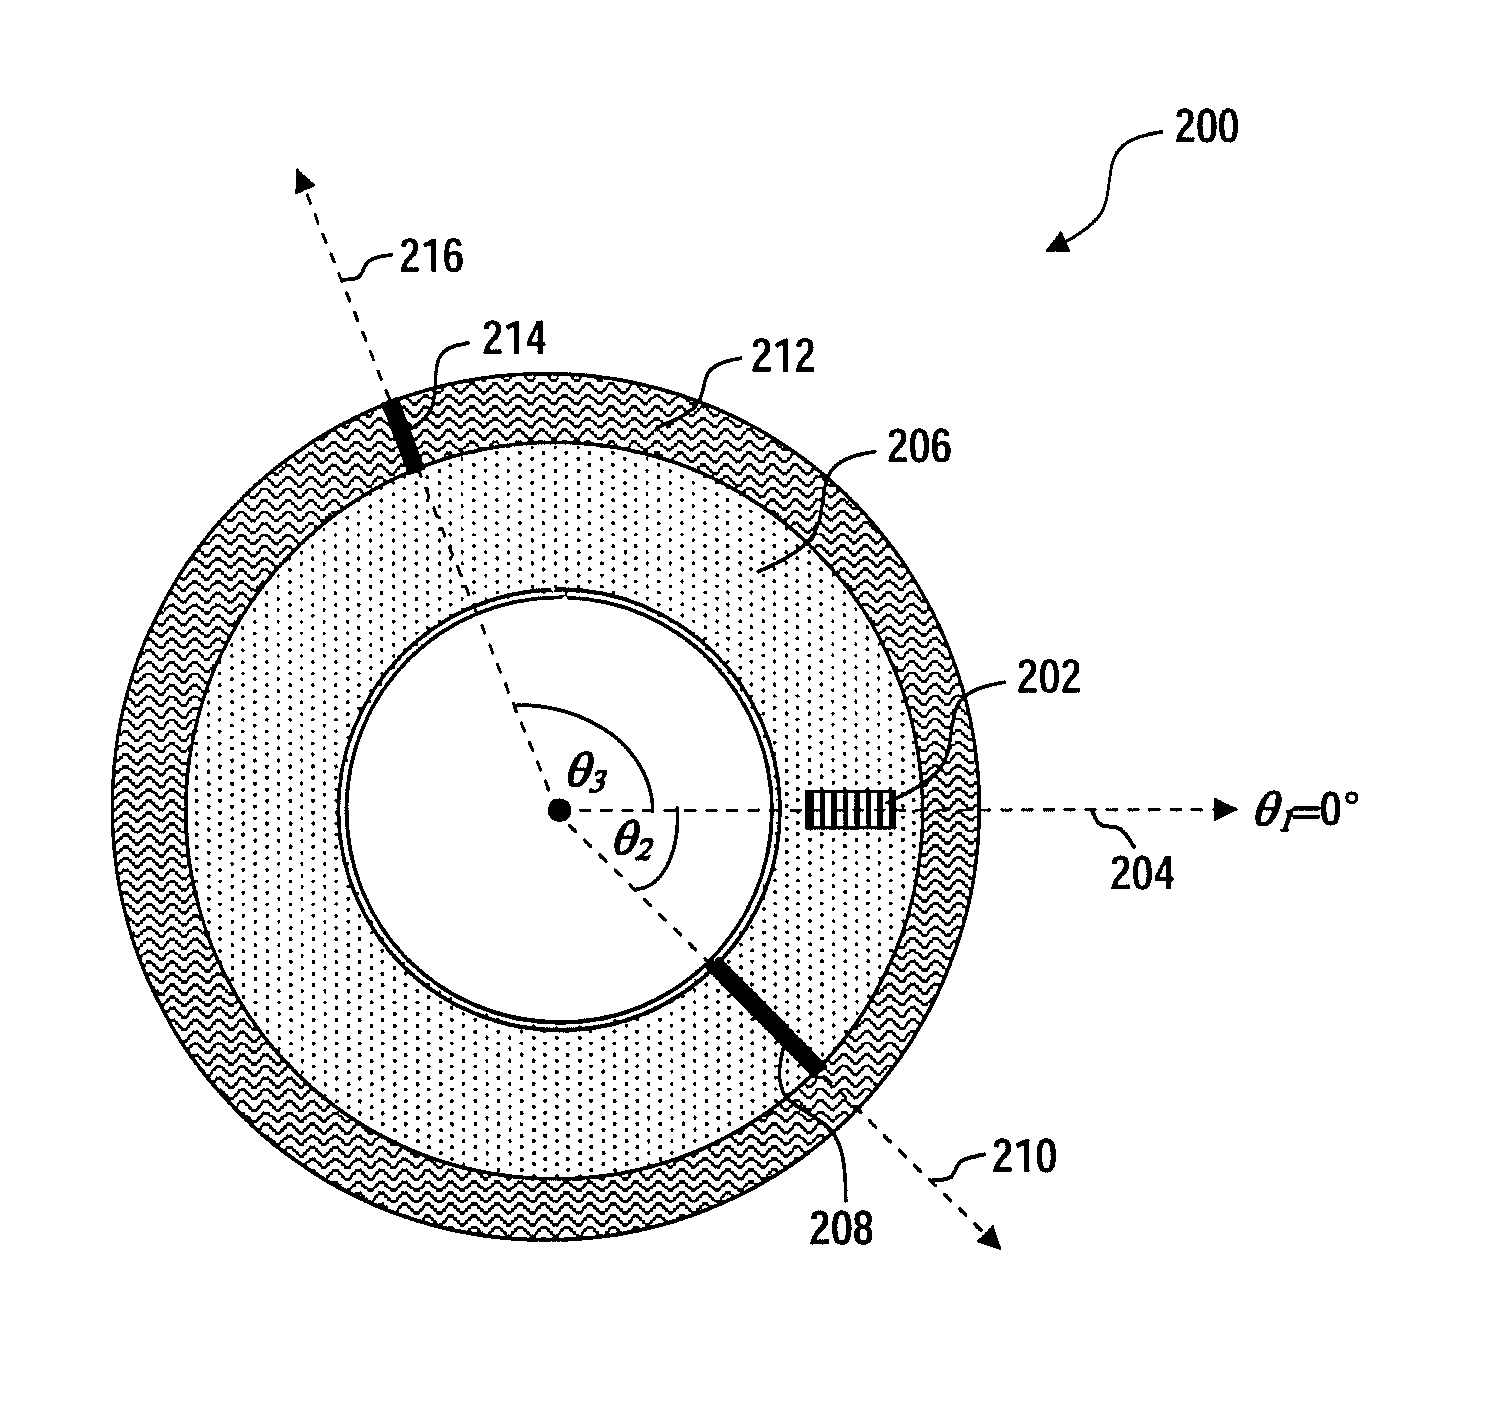
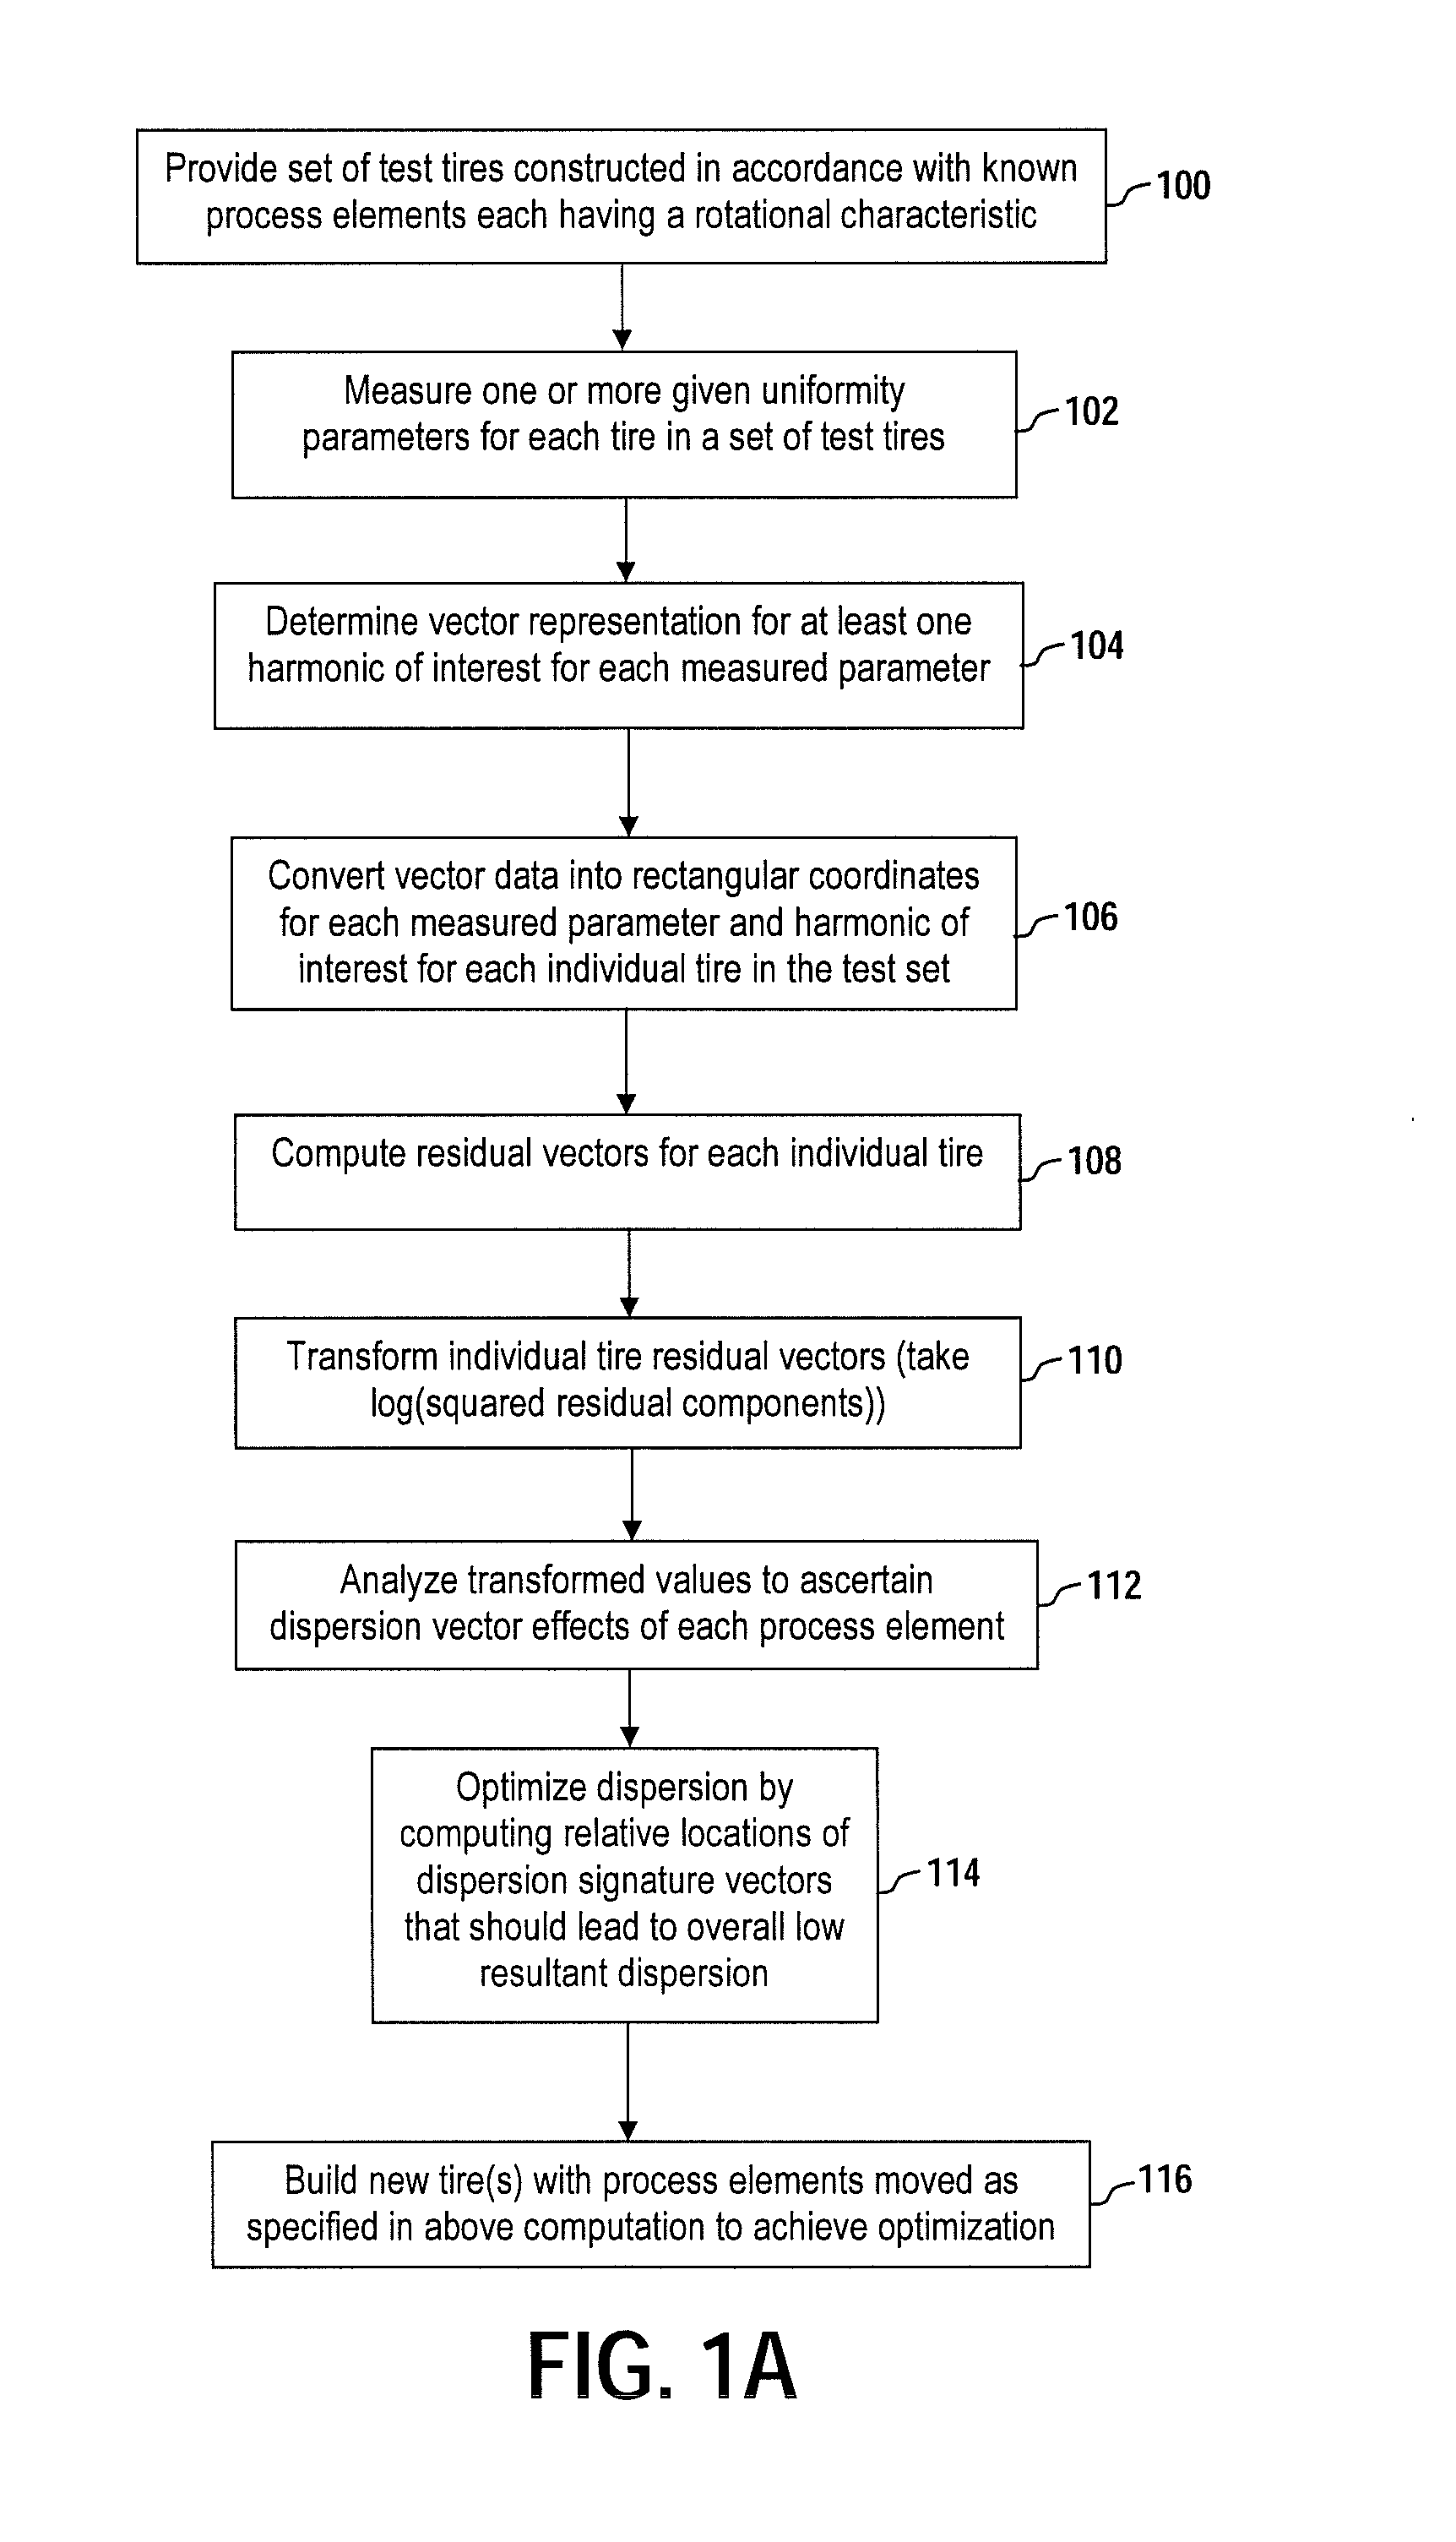
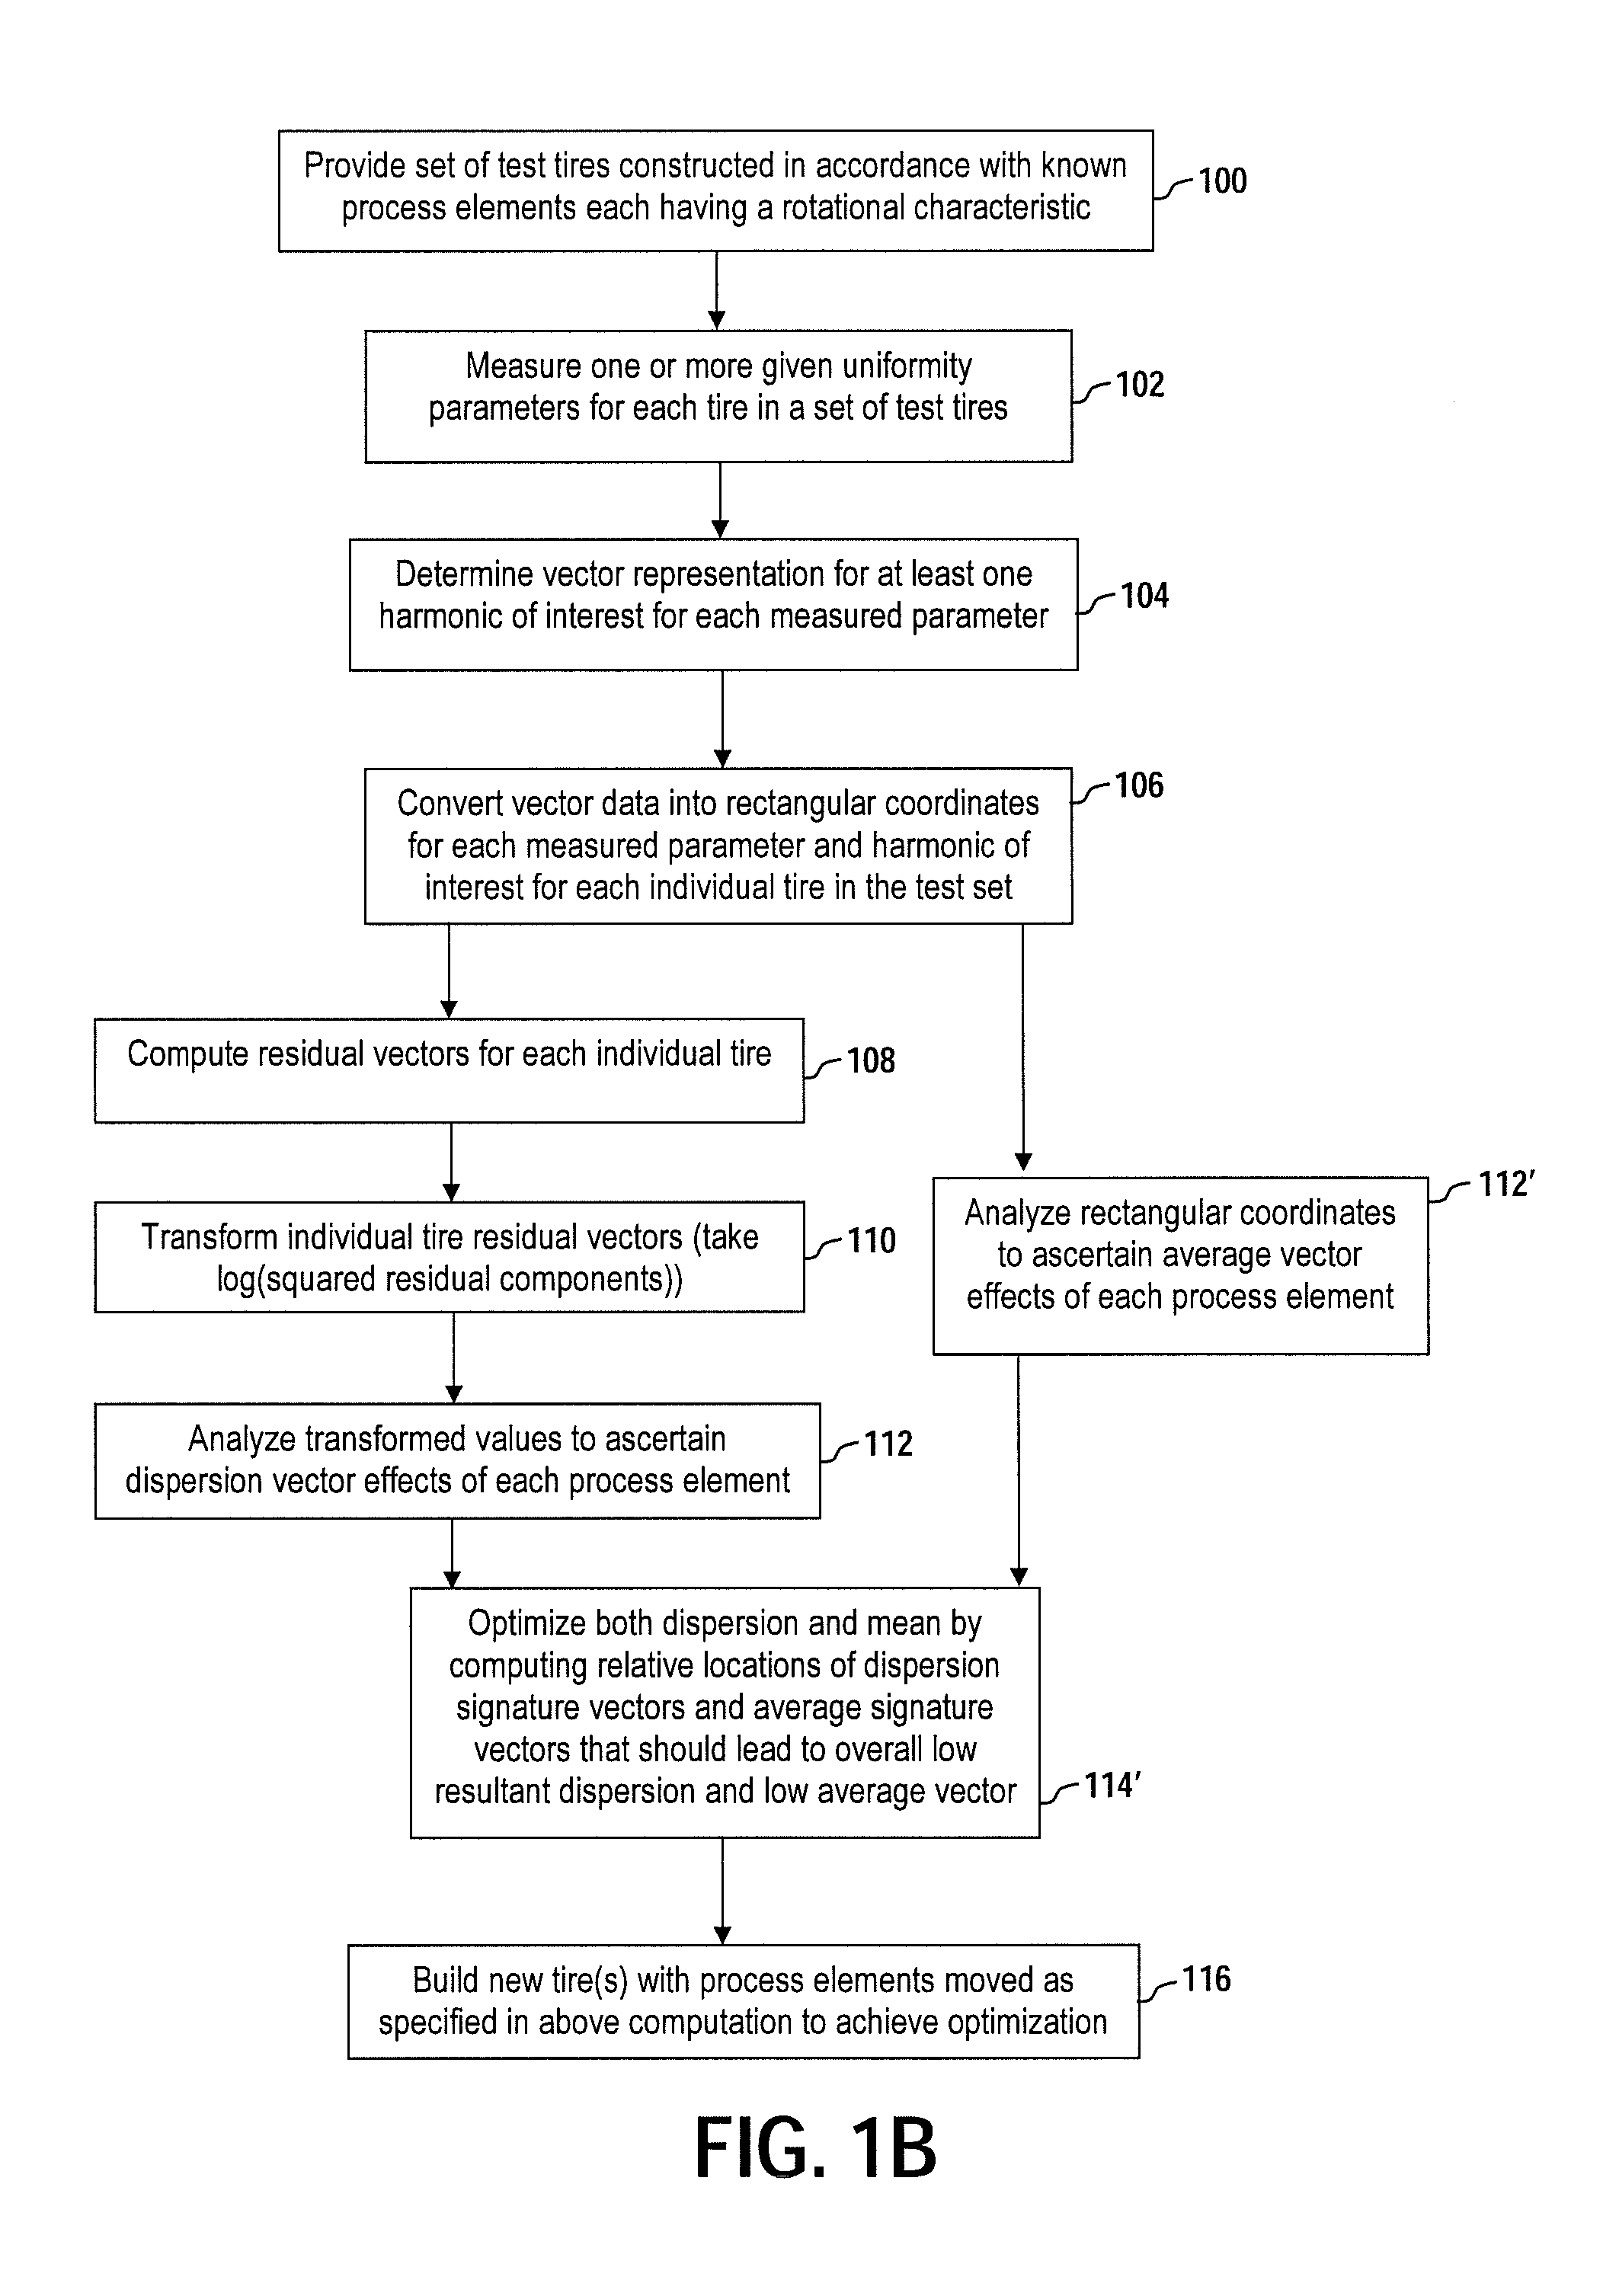
[0012]In one exemplary method, the rectangular coordinates are used to compute residual vectors for each measured test tire. Residual vectors generally correspond to the individual rectangular coordinates with the mean vector (or average value of the measured parameters across the set of test tires) subtracted out. The residual vectors are then transformed by computing the log of the squared value of each residual component. The contribution of each process element to the transformed residual vectors is then determined, for example, using regression-based signature analysis. Knowing the signatures of each process element can enable a subsequent determination of optimized relative angular locations for each process element that reduce dispersion of the measured uniformity parameter.

Problems solved by technology

Conventional tire building methods unfortunately have many opportunities for producing non-uniformities in tires.
During rotation of the tires, non-uniformities present in the tire structure produce periodically-varying forces at the wheel axis.
Tire non-uniformities are important when these force variations are transmitted as noticeable vibrations to the vehicle and vehicle occupants.
Many different factors can contribute to the presence of non-uniformities in tires, even when the tires are built under seemingly identical process conditions.
Although known technologies for tire uniformity improvement have been developed, no design has emerged that generally encompasses all of the desired characteristics as hereafter presented in accordance with the subject technology.

Method used


Image

  • Tire uniformity through dispersion optimization
  • Tire uniformity through dispersion optimization
  • Tire uniformity through dispersion optimization

Examples


example

[0063]To better appreciate the processes illustrated in FIGS. 1A and 1B, a numerical example of dispersion analysis is presented. The results below provide simulated data (i.e., test results for hypothetical tires), but exemplify the types of improvements in uniformity achieved from applying the subject analysis to actual manufactured tires. The same type of input data available from the following hypo would be available for actual manufactured tires, and the same regression analysis techniques and equation fitting would be employed. Comparison of resulting output data has constructively verified that similar outputs and corresponding yield values are achieved from analysis of hypothetical and actual tire data. The results below are helpful to explain the disclosed techniques as well as demonstrate improvements in uniformity and corresponding customer yield.

[0064]Consider a hypothetical set of tires having non-uniformity contributions from three process elements A, B and C and a var...


PUM

PropertyMeasurementUnit
Pressureaaaaaaaaaa
Massaaaaaaaaaa
Residual entropyaaaaaaaaaa

Abstract

A system and related method for improving tire uniformity includes providing at least one set of test tires constructed with one or more process elements provided at known relative angular locations. At least one uniformity parameter, such as radial or lateral run-out, balance, mass variation, radial lateral or tangential force variation, is measured for at least one harmonic of interest for each test tire. Respective rectangular coordinates are determined for each measured uniformity parameter and harmonic of interest for each tire. A form of the determined rectangular coordinates (e.g., the rectangular coordinates themselves and / or the log of the residuals squared) is analyzed for each tire to identify optimized relative angular locations for each process element that reduce dispersion (or dispersion and mean) of the measured uniformity parameter. New tires are built with the one or more process elements positioned in the identified optimized relative angular locations.

Description

FIELD OF THE INVENTION[0001]The invention relates to tire uniformity, and more specifically to a method for analyzing and controlling the uniformity of tires during and after tire manufacturing.BACKGROUND OF THE INVENTION[0002]Tire non-uniformity relates to the symmetry (or lack of symmetry) relative to the tire's axis of rotation in mass, geometric or stiffness characteristics. Conventional tire building methods unfortunately have many opportunities for producing non-uniformities in tires. During rotation of the tires, non-uniformities present in the tire structure produce periodically-varying forces at the wheel axis. Tire non-uniformities are important when these force variations are transmitted as noticeable vibrations to the vehicle and vehicle occupants. These forces are transmitted through the suspension of the vehicle and may be felt in the seats and steering wheel of the vehicle or transmitted as noise in the passenger compartment. The amount of vibration transmitted to the...

Claims


Application Information

Patent Timeline
IPC IPC(8): G01M17/02
CPCB29D30/0061B29D30/0633B29D30/0662G01M17/02B29D2030/0635B29D2030/0665B29D2030/0066
Inventor MAWBY, WILLIAM DAVID
Owner MICHELIN RECH & TECH SA
Learn More