Flow cytometry method through the control of fluorescence intensities

a flow cytometry and intensity technology, applied in the field of flow cytometry through the control of fluorescence intensities, can solve the problems of complex gating strategy, insufficient indentification of different cell populations, and unsuitable reference method for manual microscopic sorting of leukocytes, etc., and achieve the effect of more rapid and convenient operation

Inactive Publication Date: 2012-09-13
THE CATHOLIC UNIV OF KOREA IND ACADEMIC COOPERATION FOUND
View PDF3 Cites 10 Cited by
  • Summary
  • Abstract
  • Description
  • Claims
  • Application Information

AI Technical Summary

Benefits of technology

[0029]Still another aspect of the present invention provides an antibody composition including an antibody conjugated with a fluorochrome and a non-conjugated antibody. Here, an amount of the antibody conjugated with the fluorochrome is adjusted so that fluorescence intensities of cell populations can be adjusted in different levels in flow cytometry. Using an antibody conjugated with a c

Problems solved by technology

The manual microscopic sorting of leukocytes is not suitable as a reference method due to a lack of qualitative parameters and inaccuracy.
Also, there is the limited number of colors that can be classified by a flow cytometer, and thus different cell populations are not sufficiently indentified.
However, a very complex gating strategy should be used to classify up to 11 different types of cells.
However, these methods can merely classify positive an

Method used


Image

  • Flow cytometry method through the control of fluorescence intensities
  • Flow cytometry method through the control of fluorescence intensities
  • Flow cytometry method through the control of fluorescence intensities

Examples


example 1

Single-Color 3-Target Flow Cytometry

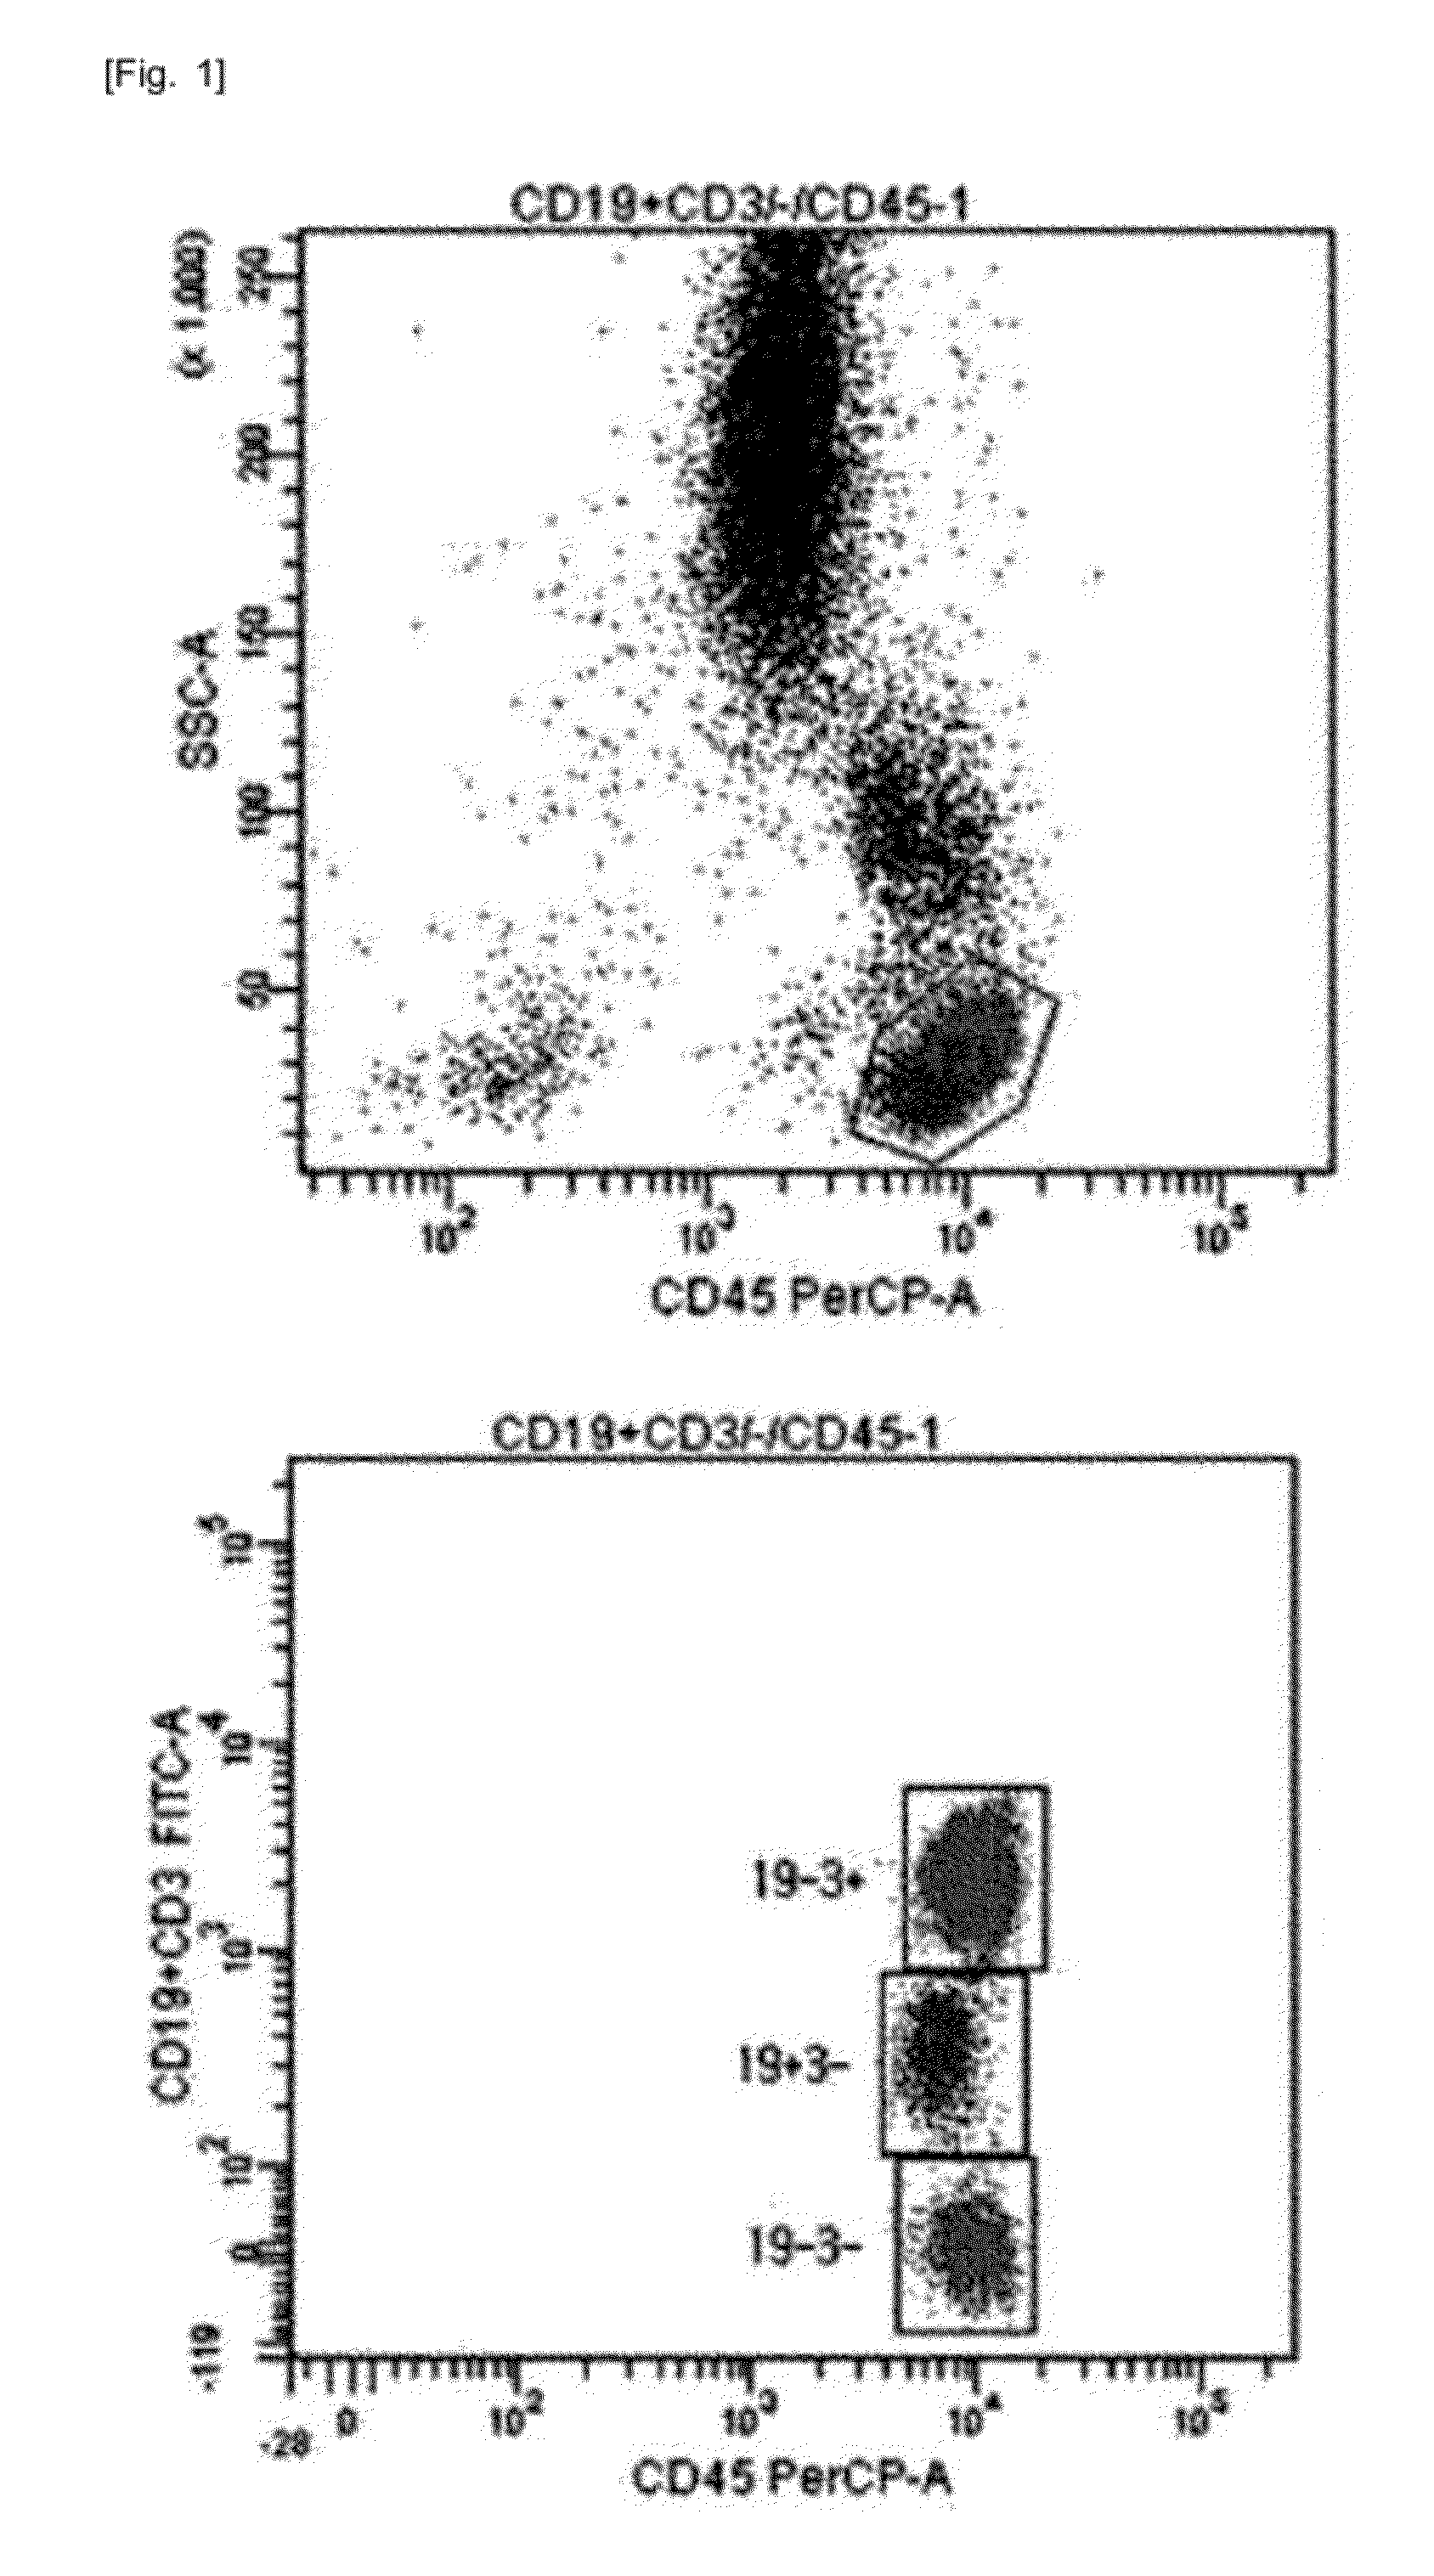
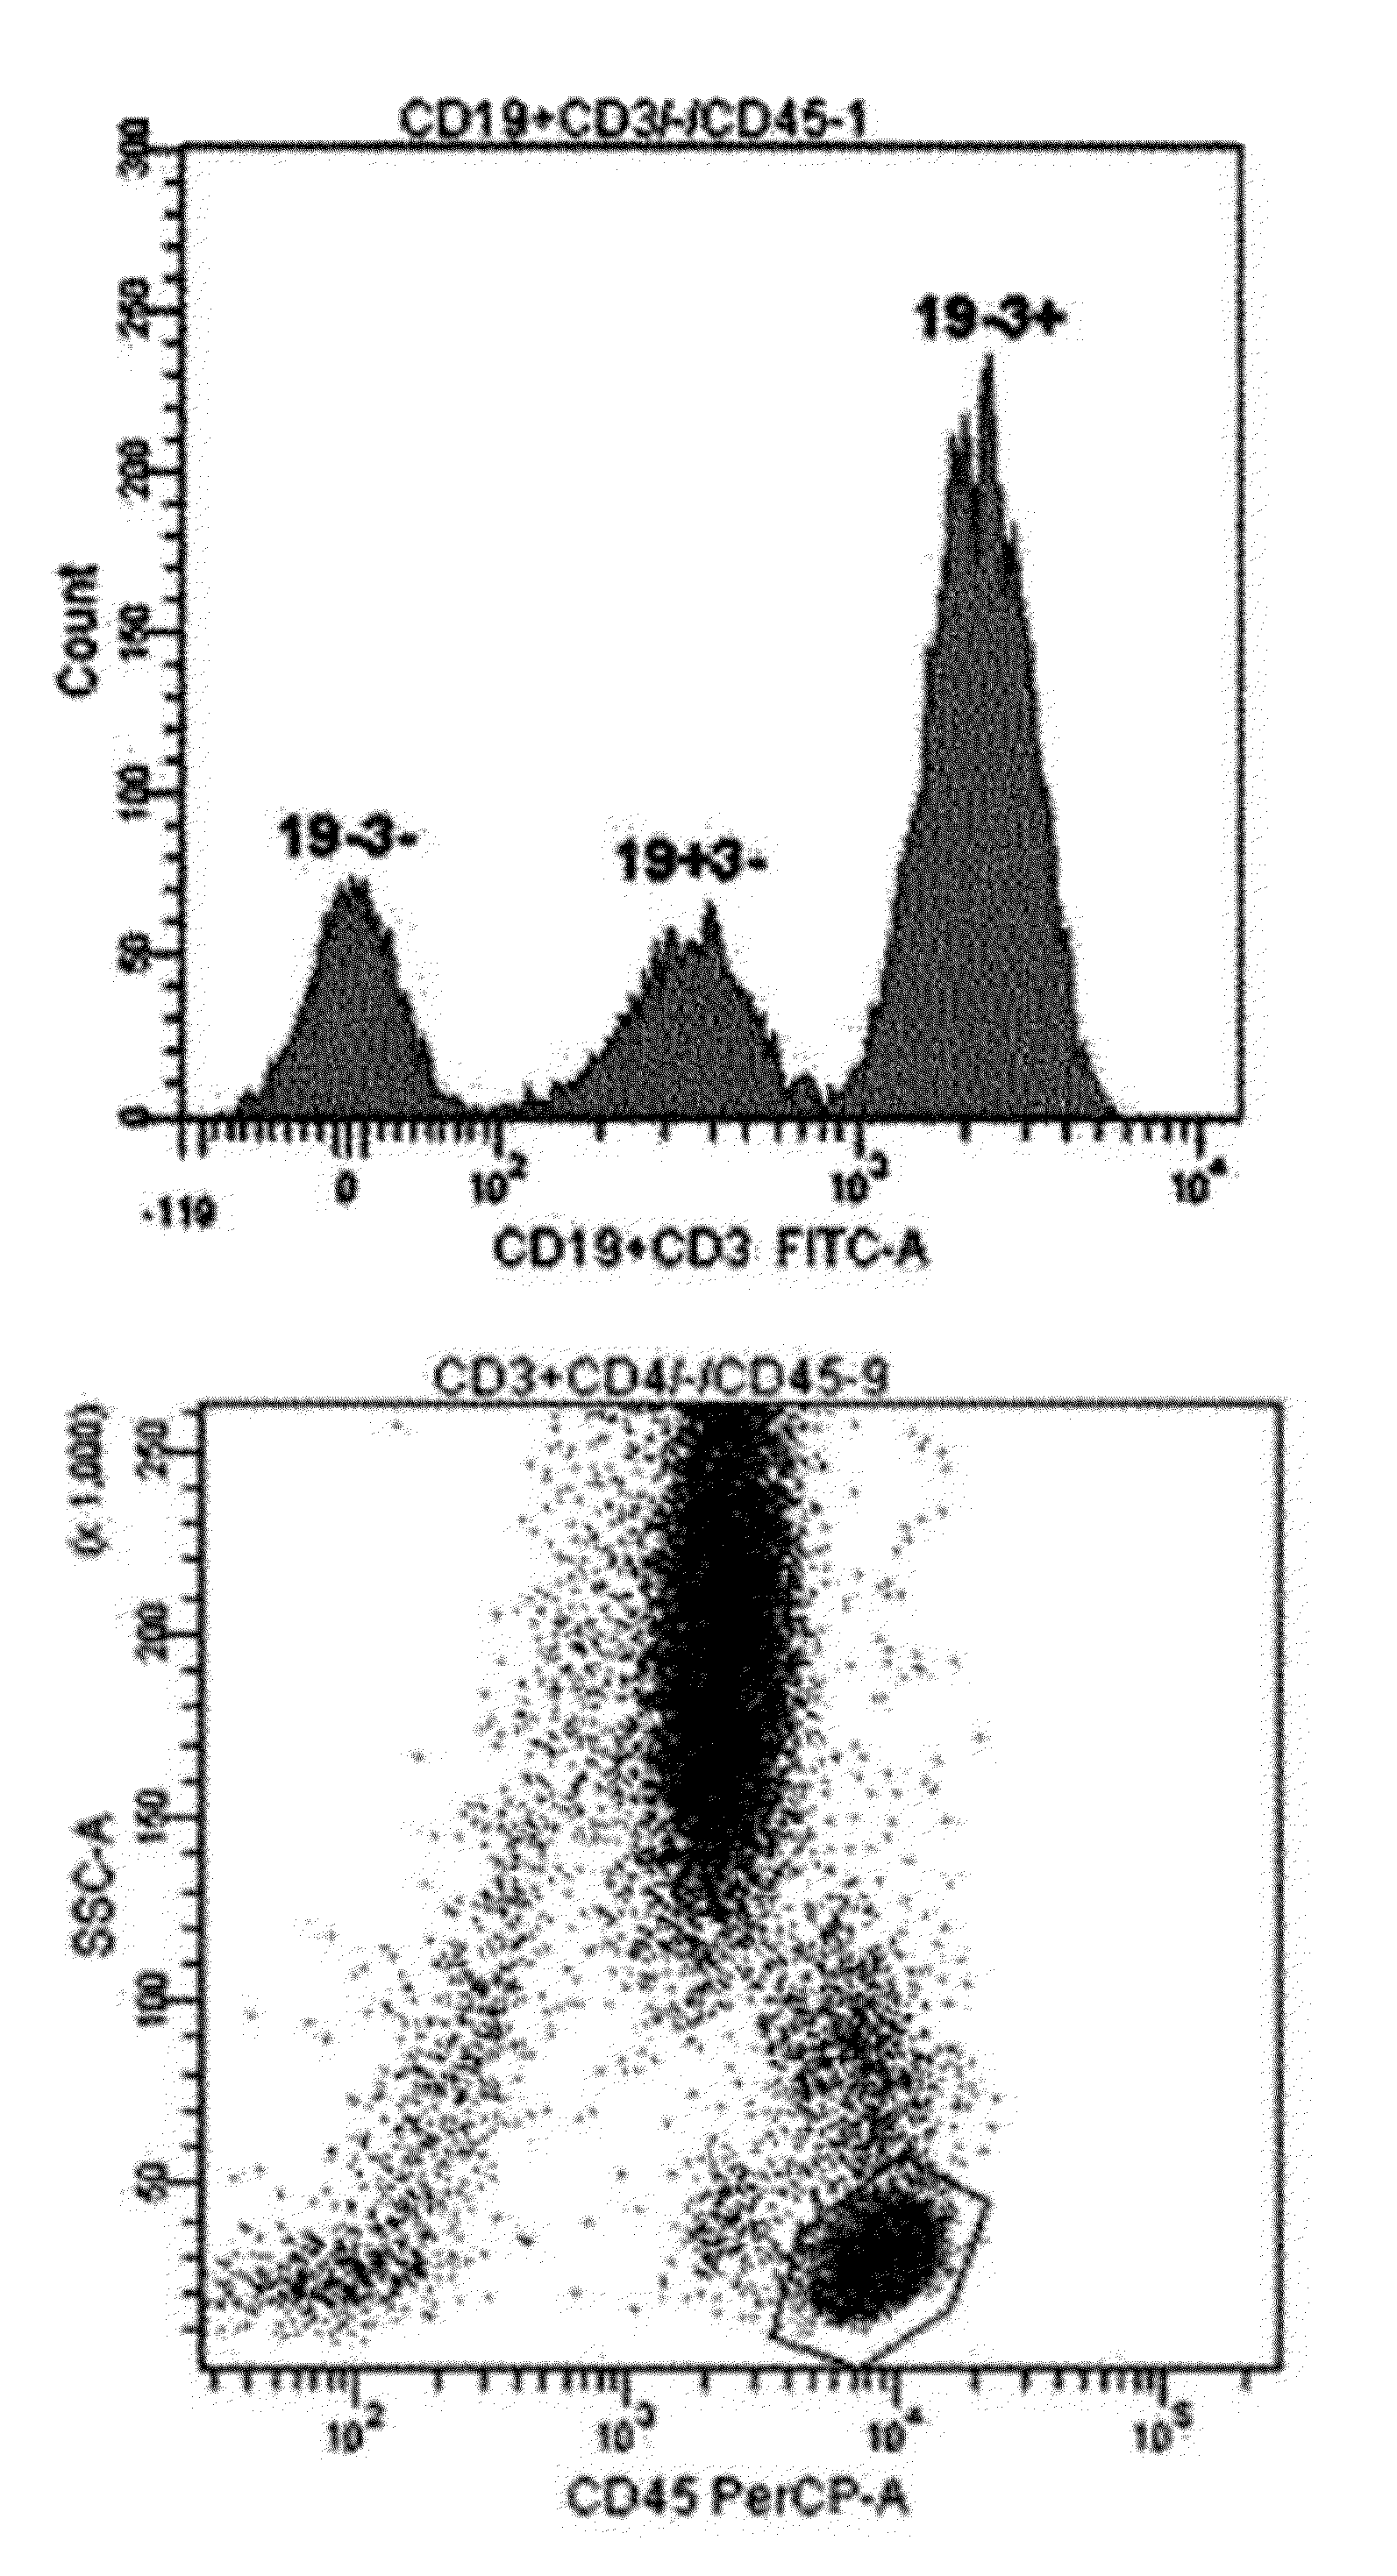
[0043]For single-color 3-target flow cytometry, two kinds of monoclonal antibodies labeled with the same fluorochrome having different intensities were used. One monoclonal antibody cocktail consisting of 0.1 μl CD3-FITC, 5 μl CD4-FITC, and 5 μl CD45-PerCP, and another monoclonal antibody cocktail consisting of 0.5 μl CD19-FITC, 5 μl CD3-FITC, and 5 μl CD45-PerCP were used (see Table 1). After incubation at room temperature for 20 minutes, erythrocytes were lysed in BD FACS™ lysing solution (Becton Dickinson Biosciences, Ontario, Canada) and incubated in a dark room for 10 minutes or more. The resultant cells were washed with phosphate buffered saline (PBS) (Medical & Biological Laboratories co., LTD, Nagoya, Japan) and then re-suspended in 0.2 mL PBS. Lymphocytes were gated using CD45 / SSC (see FIG. 1). For precision analysis, two peripheral blood samples obtained from a healthy adult were analyzed 10 times each, and CVs were calculated (see Table...

example 2

Single-Color 4-Target Flow Cytometry

[0047]For single-color 4-target flow cytometry, three kinds of monoclonal antibodies labeled with the same fluorochrome having different intensities were used.

[0048]The flow cytometry was performed in the same way as in Example 1 except that a monoclonal antibody cocktail consisting of 0.1 μl CD56-PE, 0.5 μl CD19-PE, 20 μl CD4-PE and 5 μl CD45-PerCP was used.

[0049]As can be seen from FIG. 2, although three kinds of monoclonal antibodies labeled with the same fluorochrome having different intensities were used, the four cell populations were clearly classified, and the profiles of four peaks in the histogram were clear enough to determine a marker with ease.

example 3

Two-Color 9-Target Flow Cytometry

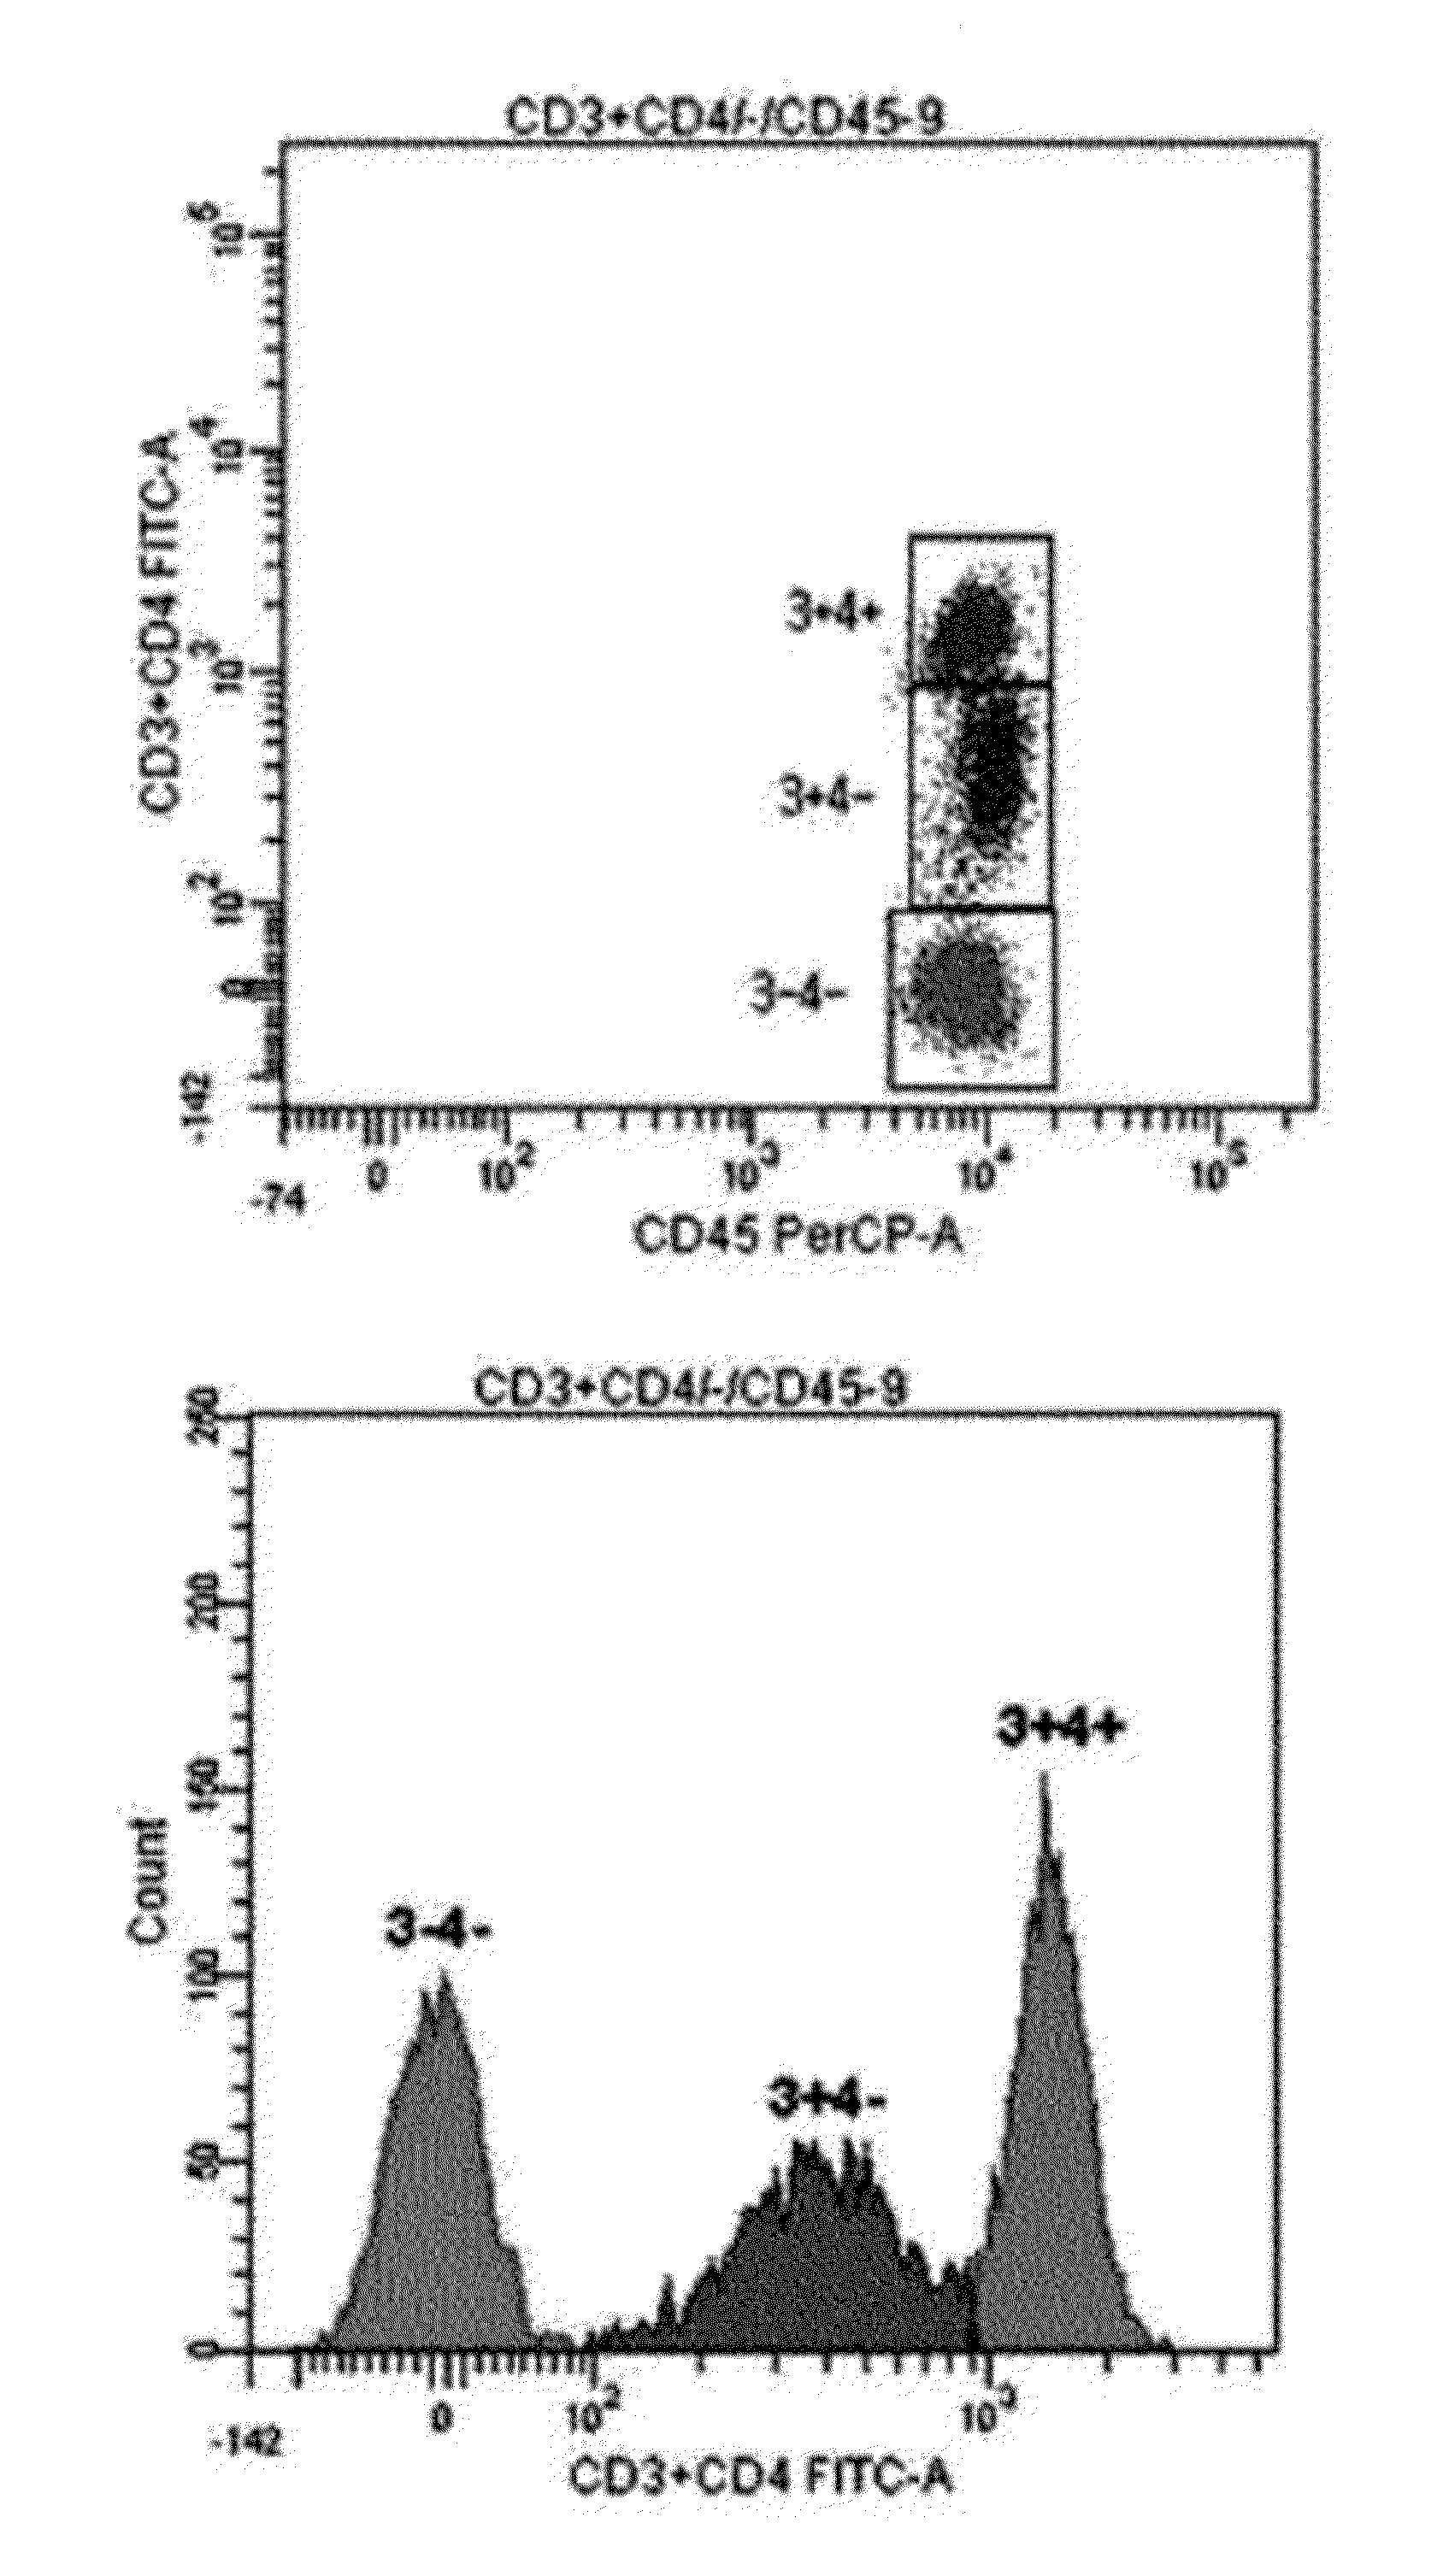
[0050]For 2-color 9-target flow cytometry, two kinds of monoclonal antibodies labeled with FITC having different intensities and two kinds of monoclonal antibodies labeled with PE having different intensities were used. A monoclonal antibody cocktail consisting of 0.1 μl CD5-FITC, 5 μl CD3-FITC, 0.5 μl CD19-PE, 5 μl CD4-PE, and 5 μl CD45-PerCP was used for flow cytometry of a bone marrow sample obtained from a mantle cell lymphoma patient (see Table 1). Also, to show that fluorescence intensities of antibodies used in a method according to an exemplary embodiment of the present invention can be adjusted by adjusting intensities of a fluorochrome conjugated to the respective antibodies rather than concentrations of the antibodies, a monoclonal antibody cocktail consisting of 5 μl old CD3-FITC whose fluorescence had faded (period of validity Jul. 1, 2004, 5 years 3 months prior), 5 μl CD4-FITC, 5 μl old CD25-PE (period of validity Jun. 30, 2004, 5 year...


PUM


Abstract

Provided is a flow cytometry method including adjusting cell populations targeted by antibodies conjugated with a same-color fluorochrome to show different fluorescence intensities according to types of the antibodies. Unlike a conventional flow cytometry method capable of classifying a positive and negative of one target using one antibody per color, the flow cytometry method adjusts several types of antibodies conjugated with a single-color fluorochrome to respectively show different fluorescence intensities, or adjusts the amounts of antibodies conjugated with a fluorochrome differently according to types of the antibodies, thereby classifying a positive and negative of multiple targets using one color. Accordingly, even when a current flow cytometer capable of classifying a limited number of colors is used, it is possible to classify a variety of cell populations to be clinically examined.

Description

CROSS-REFERENCE TO RELATED APPLICATION[0001]This application claims priorities to and the benefit of Korean Patent Application No. 10-2009-0113899 filed on Nov. 24, 2009 and Korean Patent Application No. 10-2010-0117617 filed on Nov. 24, 2010, the disclosures of which are incorporated herein by reference in their entirety.BACKGROUND[0002]1. Field of the Invention[0003]The present invention relates to a flow cytometry method through the control of fluorescence intensities.[0004]2. Discussion of Related Art[0005]Although most hematologic analyzers are good at quantitative enumeration of leukocytes, a microscopic examination of blood smears is required to ascertain the presence of abnormal cells. The manual microscopic sorting of leukocytes is not suitable as a reference method due to a lack of qualitative parameters and inaccuracy. In such case, immunophenotypic characterization of abnormal cells by flow cytometry is necessary to readily examine a cytological abnormality and obtain a ...

Claims


Application Information

Patent Timeline
IPC IPC(8): G01N21/64C12M1/34
CPCG01N33/56972G01N33/582G01N15/1459G01N2015/1402G01N2015/1488
Inventor HAN, KYUNG JA
Owner THE CATHOLIC UNIV OF KOREA IND ACADEMIC COOPERATION FOUND
Why Eureka
Try Eureka