Method for Selection of Surfactants in Well Stimulation
- Summary
- Abstract
- Description
- Claims
- Application Information
AI Technical Summary
Benefits of technology
Problems solved by technology
Method used
Image
Examples
example 1
Water Solubility
[0043]99.9 gram of source water was poured into a glass bottle. 0.1 grams of a linear ethoxyated alcohol surfactant was added to the source water. The bottle was shaken by hand by hand for 30 seconds and the solution was allowed to stand overnight. A turbidity meter was used to measure the turbidity of the solution. If the value is higher than 20%, preferably 40%, then the surfactant is verified to be soluble or dispersible.
example 2
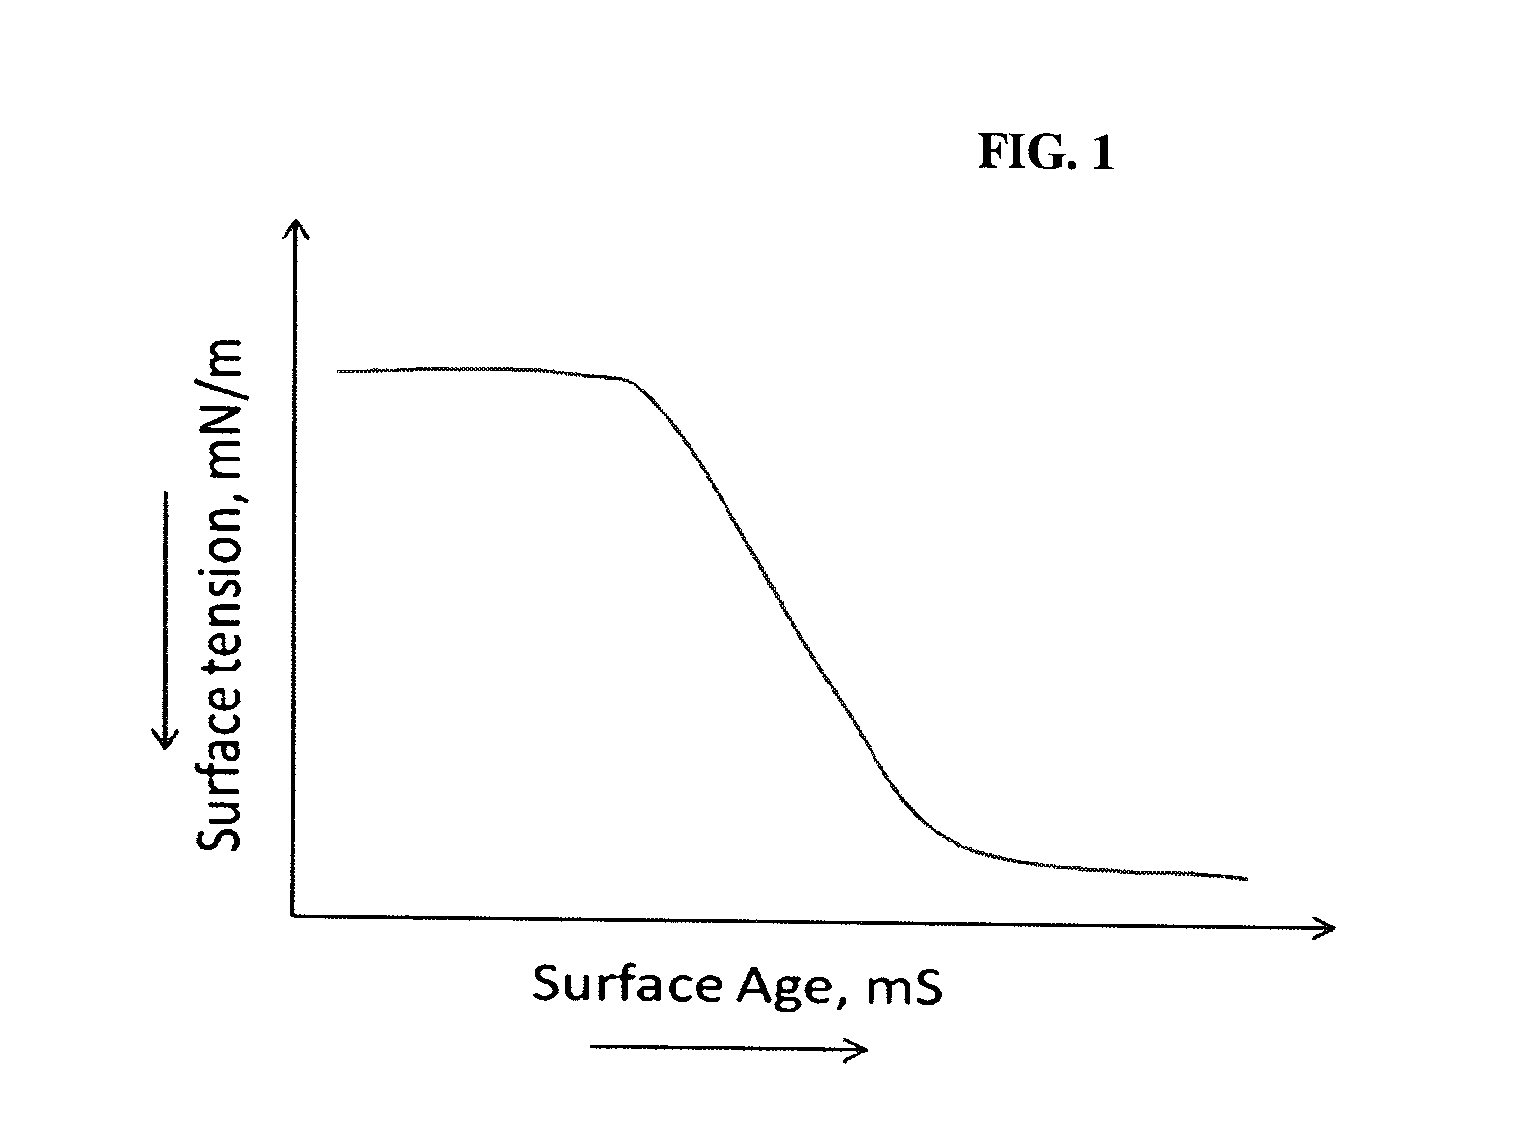
Dynamic Surface Tension
[0044]100 grams of 1000 parts per million (ppm) of the surfactant in source water was prepared to form a surfactant solution. 70 grams of surfactant solution was added to the measuring container in a bubble pressure tensiometer (e.g. Kruss BP100)
[0045]Start the measurement and record the surface tension as a function of surface age time
[0046]The characteristic time τd and the equilibrium surface tension γeq were determined from the data fitting of the curves, following the equation below:
Δγ(tτd)≅Δγeq(1-τdt)
[0047]The diffusion coefficient was determined from the molecular size a and the volume fraction φb of the surfactant:
D≅1φb2azπτd
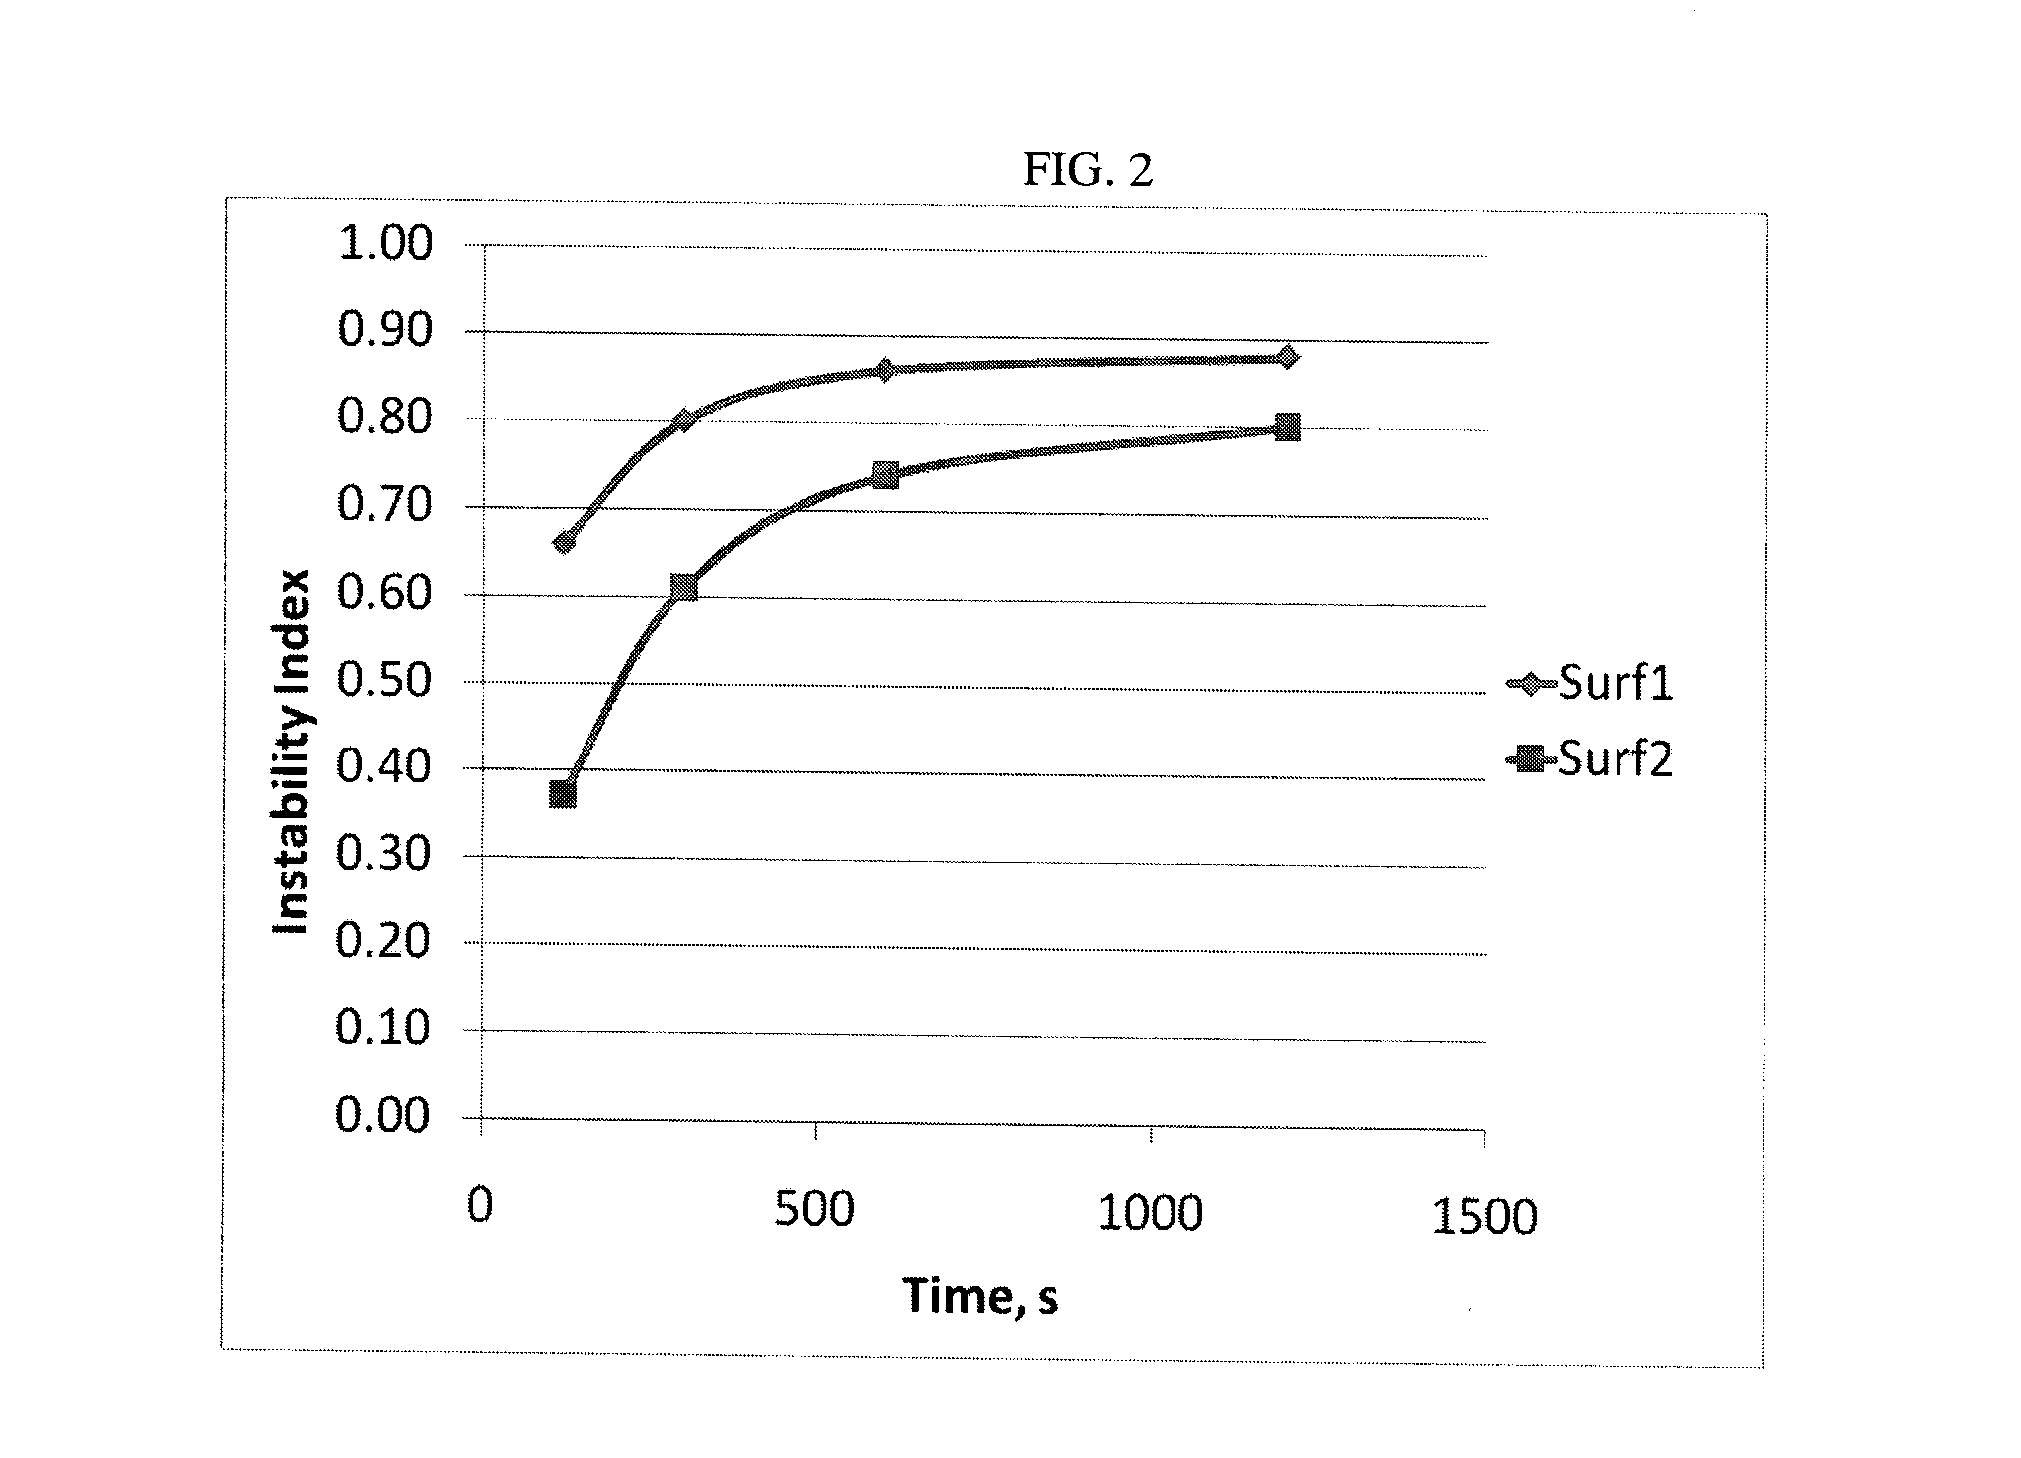
[0048]The diffusion coefficients of various surfactants were compared under different field conditions and the faster surfactants are selected as shown in FIG. 2.
example 3
Emulsion Tendency
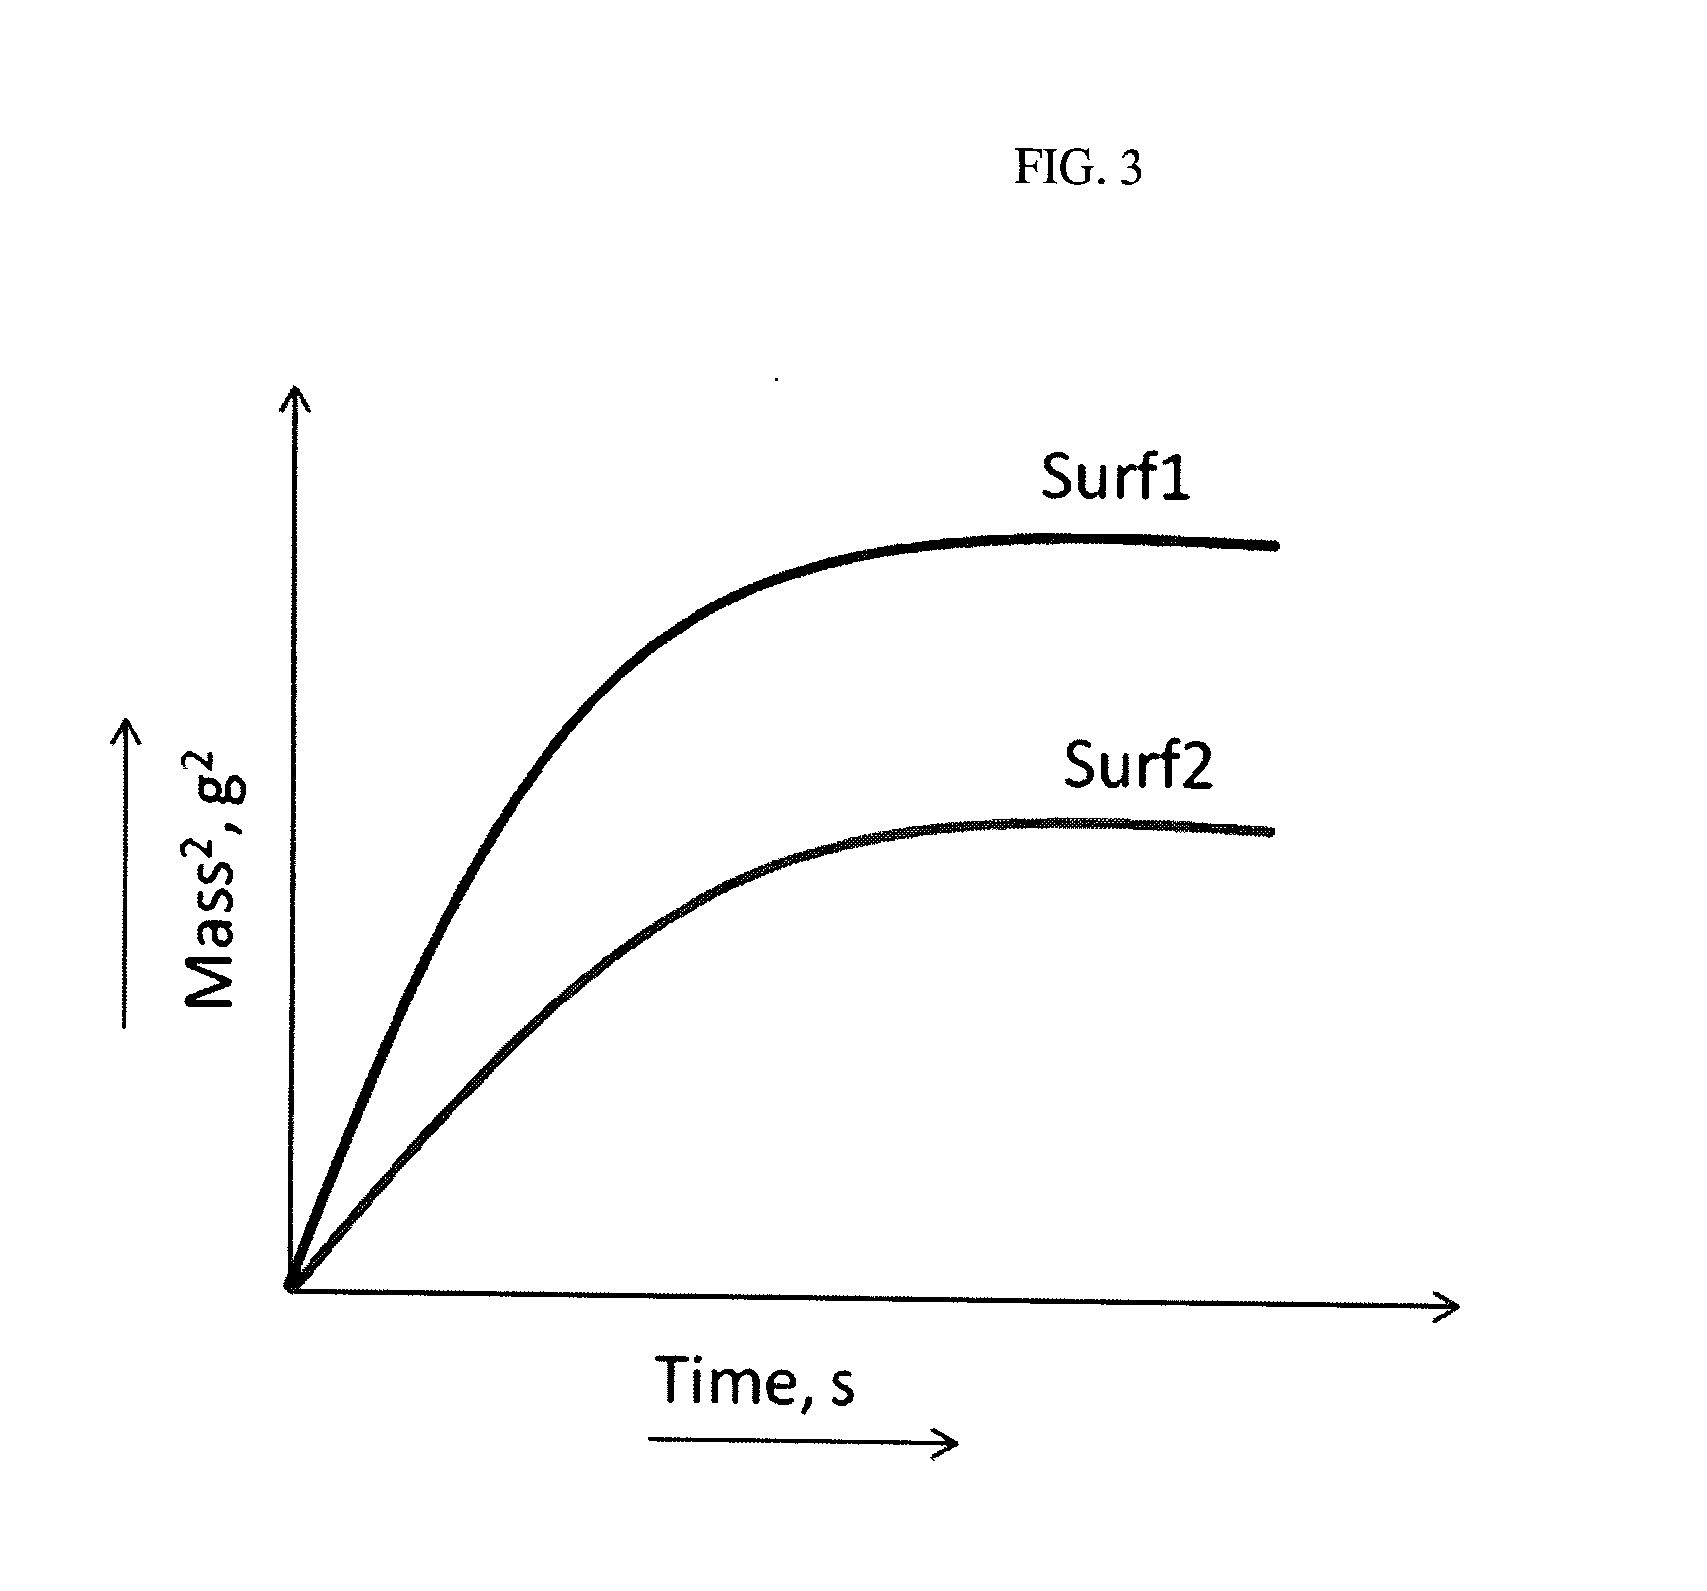
[0049]Equal volumes of 1000 ppm surfactant solution and crude oil were combined in a quartz tube (note that condensate may also be used). The tube was shaken with a mechanical shaker. A high speed blender may also be used. The tube was immediately placed in a dynamic scattering device such as LumiSizer or Turbiscan. The data was collected for two hours. The phase separation rates or instability index of emulsions were then calculated from the slopes of the curves by
ΔTransmission or BackScattering=f(Time).
[0050]Those values are chosen as a reference to compare the efficiency of surfactants. FIG. 3 compares the phase separation rates of a non-emulsifying surfactant (surf 1-a linear ethoxylated alcohol) and a weakly emulsifying one (surf 2-a linear ethoxylated sulfate). FIG. 4 illustrates the droplet size distributions between surf 1 and surf2.
PUM
 Abstract
Description
Claims
Application Information
 - R&D
- Intellectual Property
- Life Sciences
- Materials
- Tech Scout
- Unparalleled Data Quality
- Higher Quality Content
- 60% Fewer Hallucinations
Browse by: Latest US Patents, China's latest patents, Technical Efficacy Thesaurus, Application Domain, Technology Topic, Popular Technical Reports.
© 2025 PatSnap. All rights reserved.Legal|Privacy policy|Modern Slavery Act Transparency Statement|Sitemap|About US| Contact US: help@patsnap.com


