
Fluorescence-endoscope apparatus

a fluorescence endoscope and endoscope technology, which is applied in the field of fluorescence endoscope equipment, can solve the problems of too dark fluorescence images of the darker fluorescent components, the saturation of the fluorescence image of the excessively-bright fluorescent components, and the inability to detect the light intensity of the fluorescent components

Active Publication Date: 2014-01-02
OLYMPUS CORP
View PDF6 Cites 2 Cited by
  • Summary
  • Abstract
  • Description
  • Claims
  • Application Information

AI Technical Summary

Benefits of technology

The present invention is a fluorescence-endoscope apparatus that can capture multiple types of fluorescence images with different fluorescent components present in biological tissue. The apparatus uses a so-called UNMIXING technique to separate the fluorescence signals and improve the image quality. However, conventional methods using the UNMIXING technique have limitations in achieving suitable brightness for each fluorescence component and may result in reduced frame rate when changing exposure time. The invention provides a solution by incorporating a spectral image-acquisition unit with a tunable light-dispersing element and a sensitive camera to allow for changing exposure time and separating fluorescence components based on their brightness. This allows for improved image quality and separate observation of different fluorescence components present in the biological tissue.

Problems solved by technology

The brightness of each fluorescent component (human tissue, residue, or fluorescence agent) present in the biological tissue of an observation target is not uniform.
When the other fluorescent components present in the biological tissue are excessively bright and if the exposure time is increased further, the brightnesses of the fluorescence images of the excessively-brighter fluorescent components are saturated.
However, if the exposure time for the fluorescence images of the other fluorescent components present in the biological tissue is reduced in a similar manner in accordance with the change made in the exposure time for the fluorescence image of the excessively bright fluorescent component and if, for example, the other fluorescent components are darker, the fluorescence images of the darker fluorescent components become too dark to be detected.
Thus, when the fluorescence image is detected by adjusting the exposure conditions, such as the exposure time etc., so that a suitable brightness is achieved for each fluorescence wavelength, the UNMIXING coefficients become unsuitable, and it is sometimes difficult to separate the fluorescent components suitably.
Because the intensity detected from the darker fluorescent component 2 at the fluorescence wavelength λ2 is weak, the detected signal tends to be affected by noise, and it is difficult to obtain the correct density even when the UNMIXING processing is performed.
For the fluorescent component that is dark at the maximum-fluorescence wavelength, if only the exposure time for the fluorescence image at the maximum-fluorescence wavelength is increased, then the detection level of the fluorescence wavelengths of the other fluorescent components contained in the image varies, and a divergence from the UNMIXING coefficients (the component ratios of the fluorescent components) occurs, making separation of the fluorescent components difficult.
However, for example, if the exposure time is evenly decreased for the fluorescence images of all fluorescent components at the maximum-fluorescence wavelength in accordance with a suitable adjustment of the exposure time for the fluorescent component that is bright at the maximum-fluorescence wavelength, then the fluorescence images of the other fluorescent components at the maximum-fluorescence wavelength become darker, making it difficult to detect the darker fluorescent components, or the detected signal tends to be affected by noise, making it difficult to obtain the correct densities even if the UNMIXING processing is performed.
If only the exposure time for the fluorescence image at the maximum-fluorescence wavelength of the fluorescent component that is excessively-bright at the maximum-fluorescence wavelength is reduced, then the detection level of the fluorescence wavelengths of the other fluorescent components present in the image varies, and a divergence from the UNMIXING coefficients (the component ratios of the fluorescent components) occurs, making separation of the fluorescent components difficult.

Method used


Image

  • Fluorescence-endoscope apparatus
  • Fluorescence-endoscope apparatus
  • Fluorescence-endoscope apparatus

Examples


example 1

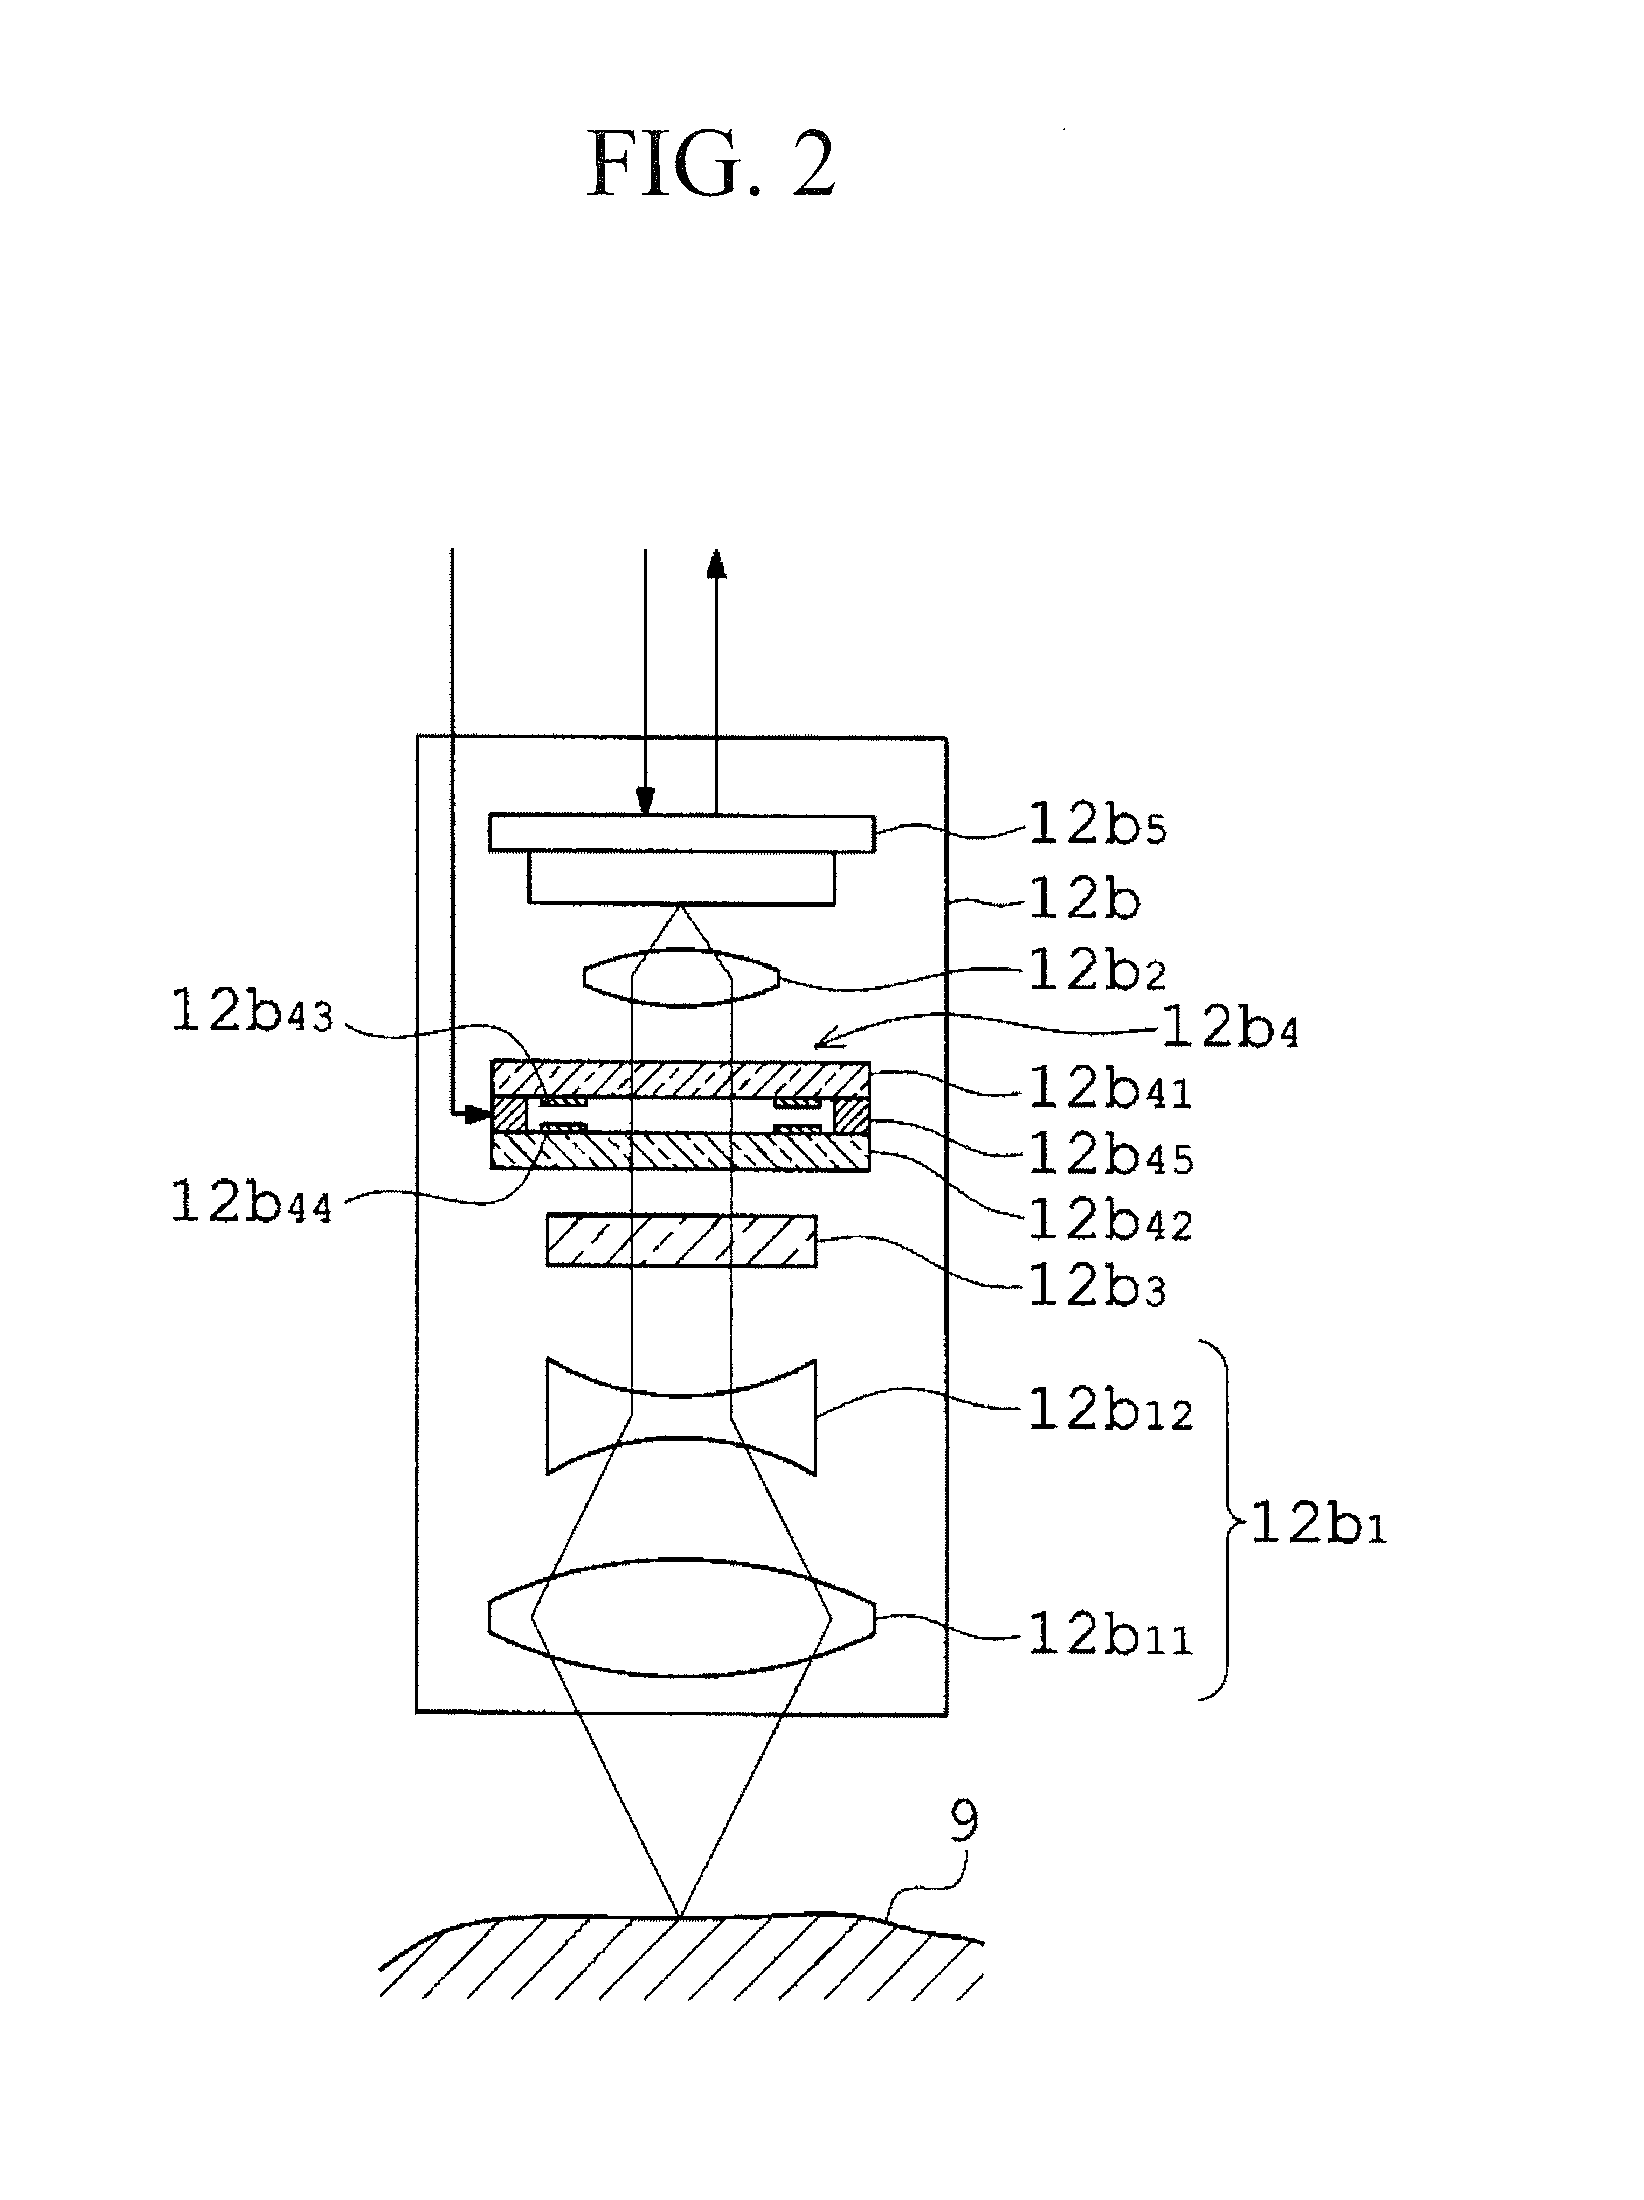
[0228]FIGS. 7A to 7E are explanatory diagrams showing the exposure conditions in the fluorescence-endoscope apparatus of Example 1 and computation performed by the fluorescent-component-density computation unit 13d2, where FIG. 7A is a diagram showing, in time-series, the light in each of the wavelength ranges selected by and transmitted through the tunable light-dispersing element 12b4 under the reference exposure conditions, FIG. 7B is a diagram showing, in time-series, the light in each of the wavelength ranges that has been, at substantially the same time as in FIG. 7A, photoelectrically converted through the image acquisition device 12b5 and stored in each of the frame memories 13c1, 13c2, and 13c3, FIG. 7C is a diagram showing, in time-series, the light in each of the wavelength ranges selected by and transmitted through the tunable light-dispersing element 12b4 under the exposure conditions in Example 1, FIG. 7D is a diagram showing, in time-series, the light in each of the w...

example 2

[0235]FIGS. 8A to 8C are explanatory diagrams showing the exposure conditions in the fluorescence-endoscope apparatus of Example 2 and computation performed by the fluorescent-component-density computation unit 13d2, where FIG. 8A is a diagram showing, in time-series, the light in each of the wavelength ranges selected by and transmitted through the tunable light-dispersing element 12b4 under the reference exposure conditions, FIG. 8B is a diagram showing, in time-series, the light in each of the wavelength ranges selected by and transmitted through the tunable light-dispersing element 12b4 under the exposure conditions in Example 2, and FIG. 8C is a diagram showing a matrix equation that is used in the UNMIXING processing performed by the fluorescent-component-density computation unit 13d2 under the exposure conditions shown in FIG. 8B.

[0236]With the fluorescence-endoscope apparatus of Example 2, as shown in FIG. 8B, the exposure conditions are changed through the exposure-conditio...

example 3

[0243]FIGS. 9A to 9C are explanatory diagrams showing the exposure conditions in the fluorescence-endoscope apparatus of Example 3 and computation performed by the fluorescent-component-density computation unit 13d2, where FIG. 9A is a diagram showing, in time-series, the intensity and the irradiation timing of each excitation light beam that excites the fluorescence wavelengths of the individual fluorescent components under the reference exposure conditions, FIG. 9B is a diagram showing, in time-series, the intensity and the irradiation timing of each excitation light beam that excites the fluorescence wavelengths of the individual fluorescent components under the exposure conditions in Example 3, and FIG. 9C is a diagram showing a matrix equation that is used in the UNMIXING processing performed by the fluorescent-component-density computation unit 13d2 under the exposure conditions shown in FIG. 9B.

[0244]With the fluorescence-endoscope apparatus of Example 3, as shown in FIG. 9B,...


PUM


Abstract

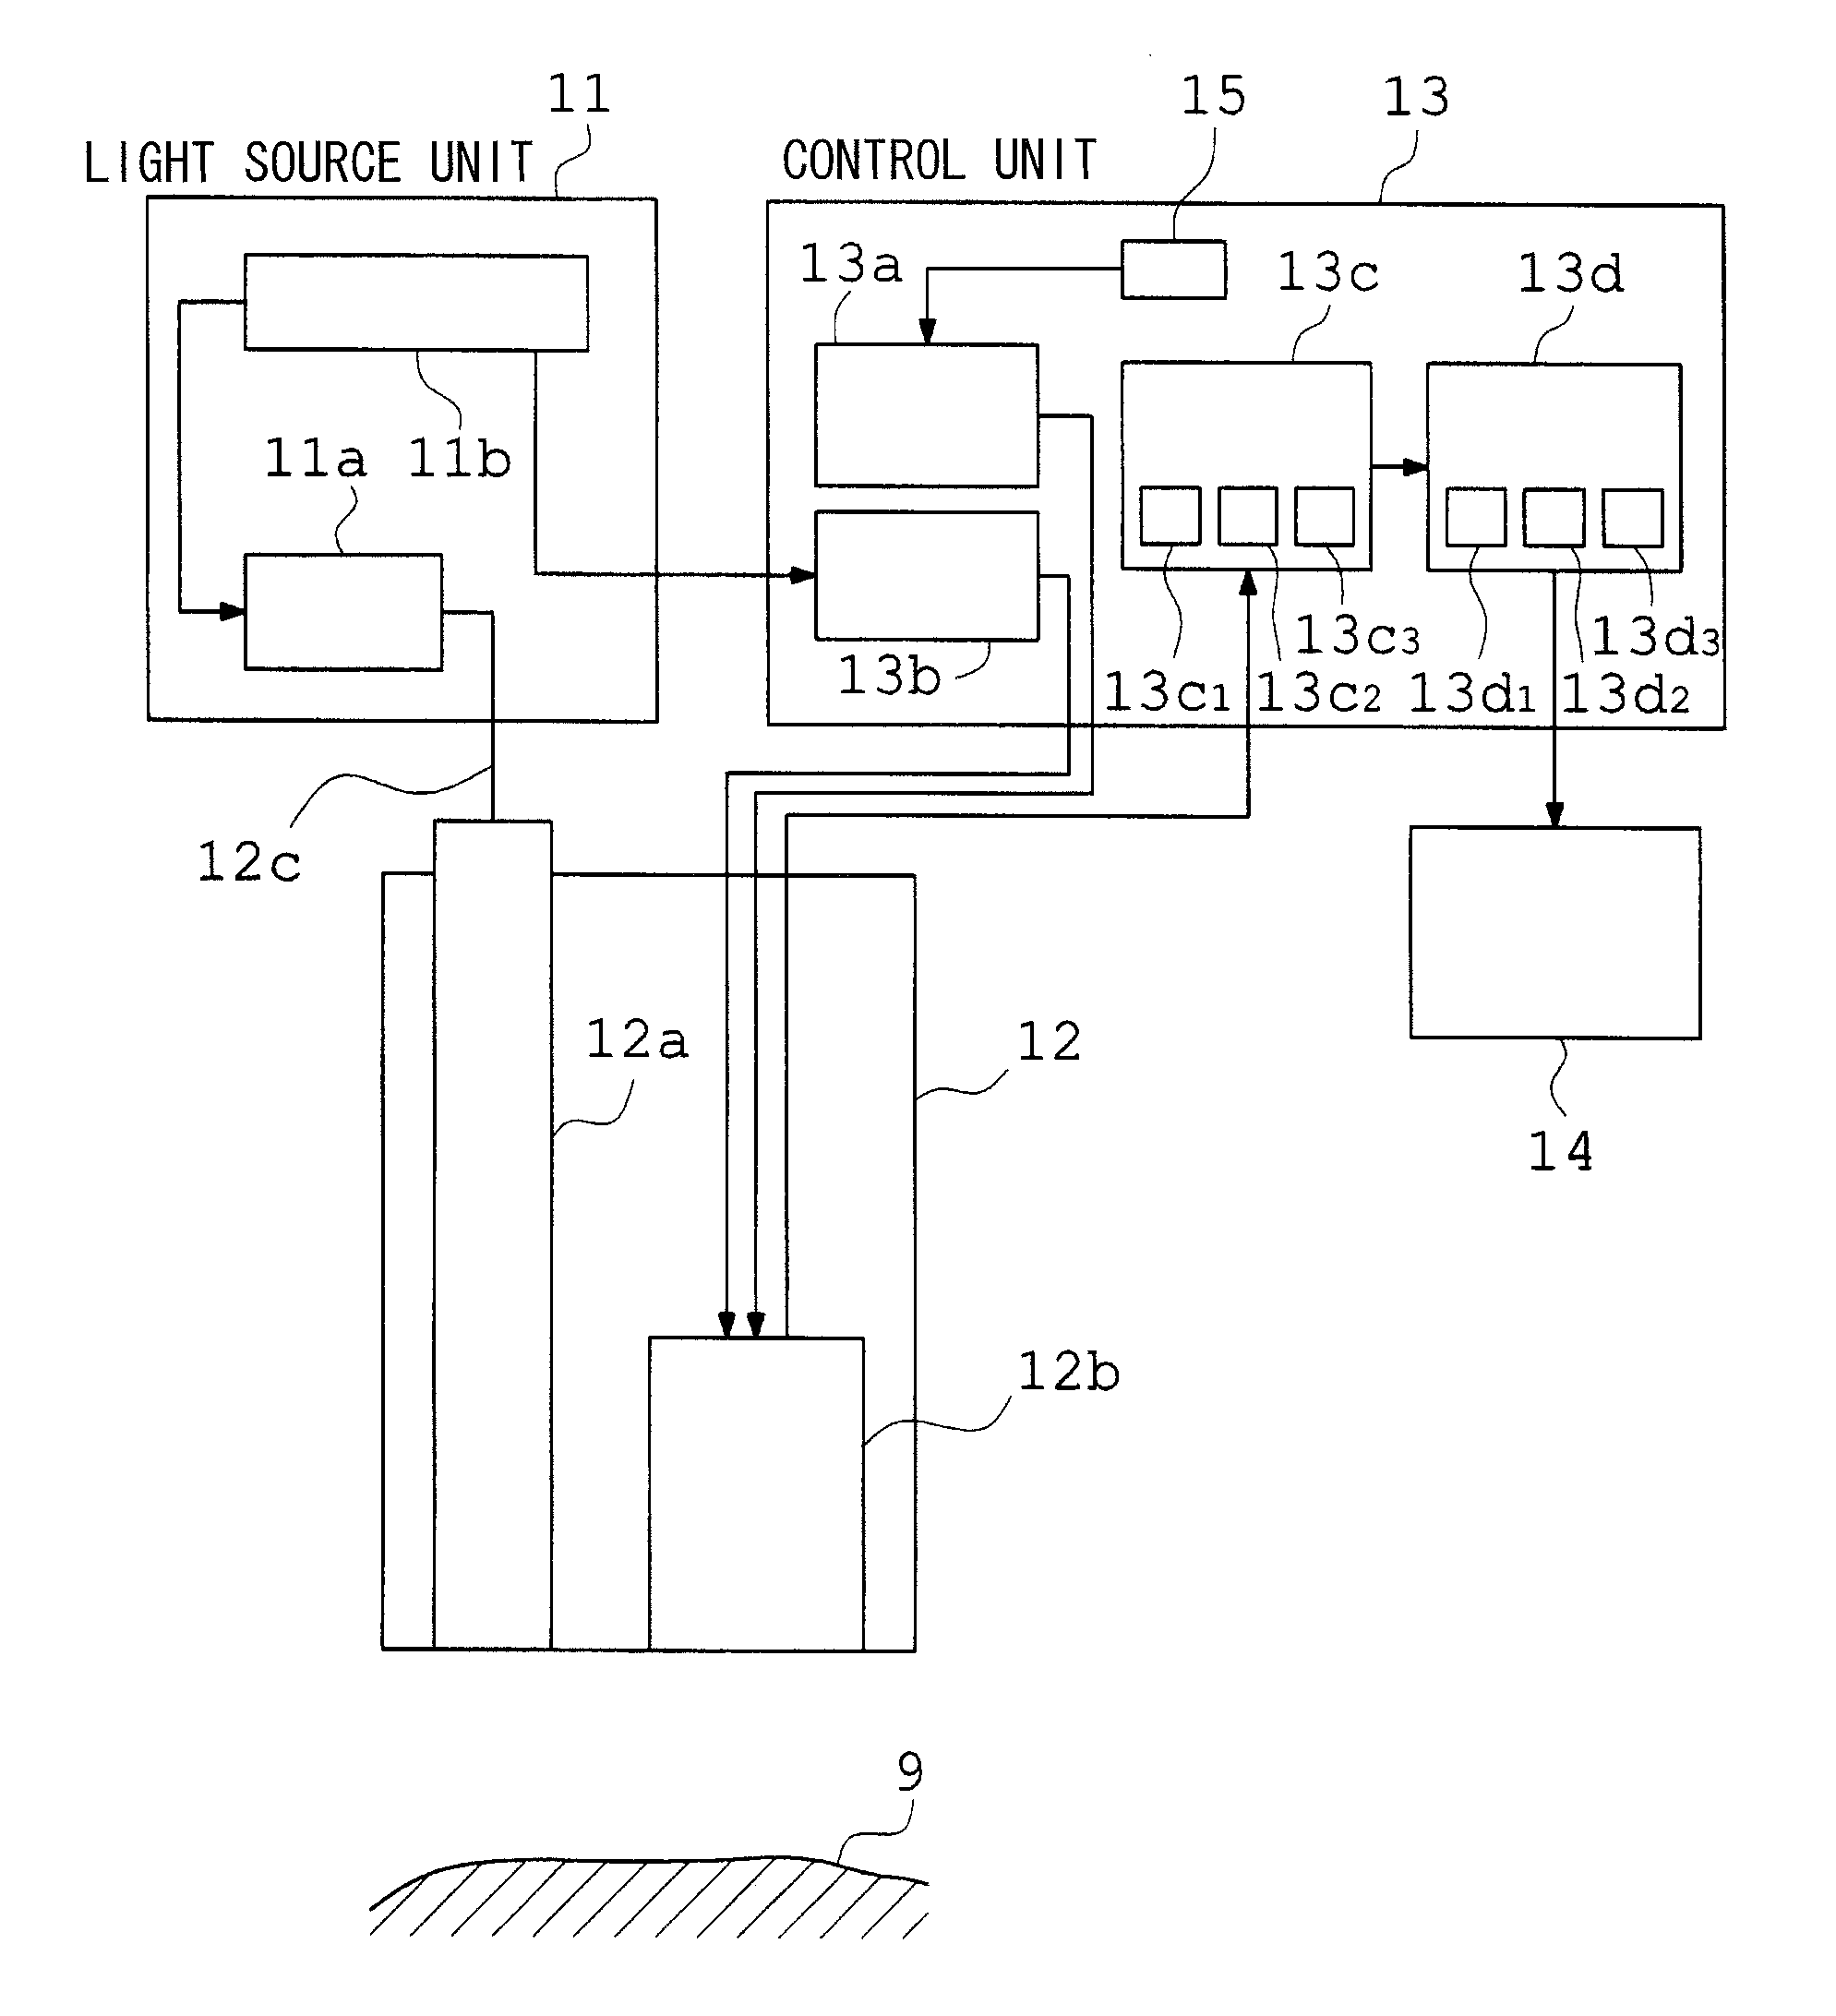
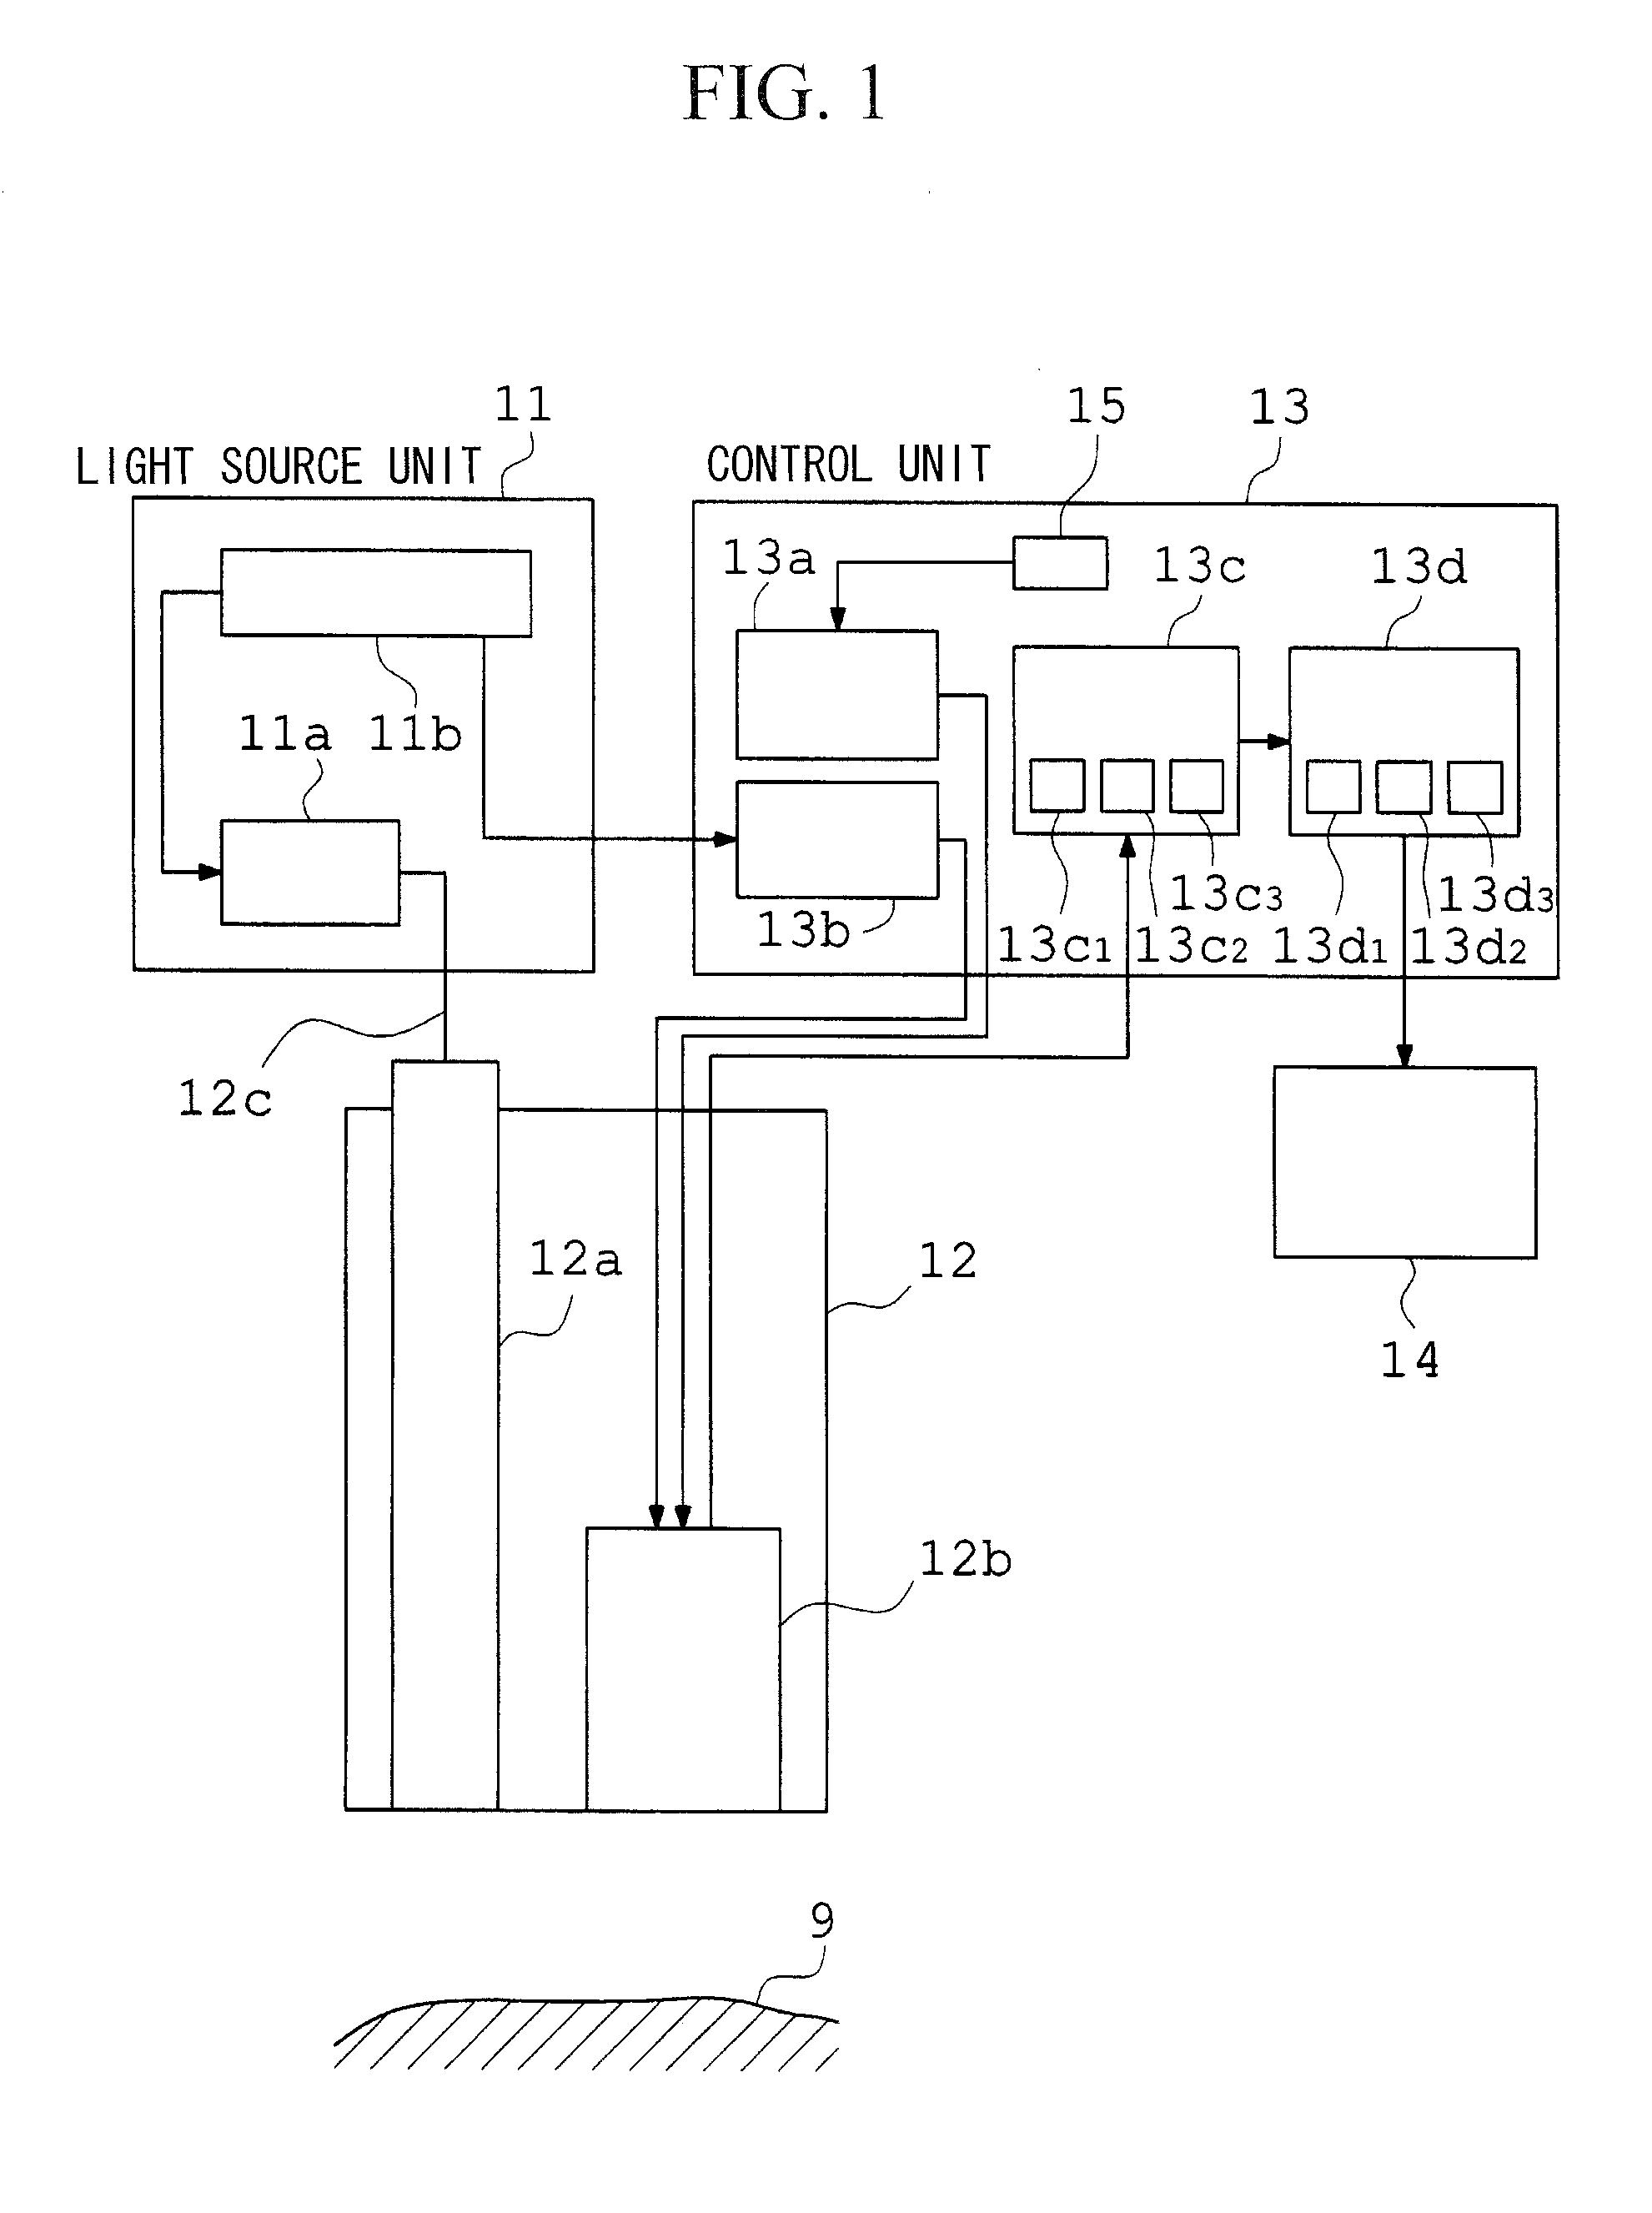
An endoscope apparatus includes an excitation-light radiation unit; a fluorescence-image acquisition unit; a fluorescence-spectrum storage unit; a density computation unit, an image combining portion; and an image display portion; wherein when coefficients at wavelengths of fluorescent components obtained from the fluorescence spectra in the storage unit, and when intensities of fluorescence images at the wavelengths acquired by the acquisition unit, the density computation unit calculates the densities of the fluorescent components from an equation, and when the densities are calculated, in accordance with a change in the value of an exposure condition item during acquisition of the fluorescence image at a wavelength, the density computation unit changes the coefficients at the wavelength using the ratio of the value after the change to the value of the exposure condition items under the reference exposure conditions has been made.

Description

CROSS REFERENCE TO RELATED APPLICATIONS[0001]This is a continuation-in-part of International Application PCT / JP2011 / 080158, with an international filing date of Dec. 27, 2011, which is hereby incorporated by reference herein in its entirety.BACKGROUND OF THE INVENTION[0002]1. Field of the Invention[0003]The present invention relates to a fluorescence-endoscope apparatus that acquires a plurality of types of images of fluorescence generated by biological tissue containing a plurality of types of fluorescent components, whose maximum-fluorescence wavelengths are different and whose fluorescence wavelengths overlap in at least parts of the wavelength ranges, and that separately displays the plurality of types of fluorescent components present in the biological tissue using the acquired fluorescence images.[0004]2. Description of Related Art[0005]In molecular imaging diagnosis using fluorescence-endoscope apparatuses, it is effective to perform fluorescence-extraction processing using a...

Claims


Application Information

Patent Timeline
Patent Type & Authority Applications(United States)
IPC IPC(8): A61B1/04
CPCA61B1/043A61B1/00009A61B1/0005A61B5/0071A61B5/0075A61B5/0084A61B5/7425
Inventor MATSUMOTO, SHINYA
Owner OLYMPUS CORP
Learn More