Biomarkers For Predicting Progressive Joint Damage

a biomarker and joint technology, applied in the field of biomarkers for predicting progressive joint damage, can solve the problems of joint damage, joint function and subject disability loss, complex disease pathogenesis,

Inactive Publication Date: 2014-05-22
CRESCENDO BIOSCI +1
View PDF0 Cites 14 Cited by
  • Summary
  • Abstract
  • Description
  • Claims
  • Application Information

AI Technical Summary

Benefits of technology

[0052]In certain embodiments of the present teachings, the rate of change in joint structural damage is classified as low or high based on the SDI score.
[0053]In some embodiments, the performance of the predictive model used in quantifying rate of change in joint structural damage is characterized by an AUC ranging from 0.60 to 0

Problems solved by technology

This joint damage is largely irreversible, and cumulatively results in joint destruction, loss of joint function and subject disability.
The precise etiology of RA has not been established, but its underlying disease pathogenesis is complex and includes inflammation and immune dysregulation.
Because of the complexity of RA, it has proven difficult to develop a single test that can accurately and consistently assess, quantify, and monitor RA disease activity and/or disease progression in every subject.
It should be noted, however, that different cell signaling pathways and mediators are involved in the two processes, inflammatory disease activity and disease progression (see, e.g., W. van den Berg et al., Arth. Rheum. 2005, 52:995-999), and the two do not always function completely in tandem, but can be uncoupled.
Furthermore, studies of RA subjects indicate limited association between clinical and radiographic responses.
The clinician who applies a simple trial-and-error process to finding the optimum treatment for the RA subject from among the myriad of possible combinations, thus runs the risk of under- or over-treating the subject.
Current laboratory tests routinely used to monitor disease activity in RA subjects, such as CRP and ESR, are relatively non-specific (e.g., are not RA-specific and cannot be used to diagnose RA), do not provide specific information as to the subject's disease progression status or rate of progression (as regards joint tissue destruction), and cannot be used to determine response to treatment or predict future outcomes.
Furthermore, some subjects who do not demonstrate clinical benefits still demonstrate radiographic benefits

Method used


Image

  • Biomarkers For Predicting Progressive Joint Damage
  • Biomarkers For Predicting Progressive Joint Damage
  • Biomarkers For Predicting Progressive Joint Damage

Examples


example 1

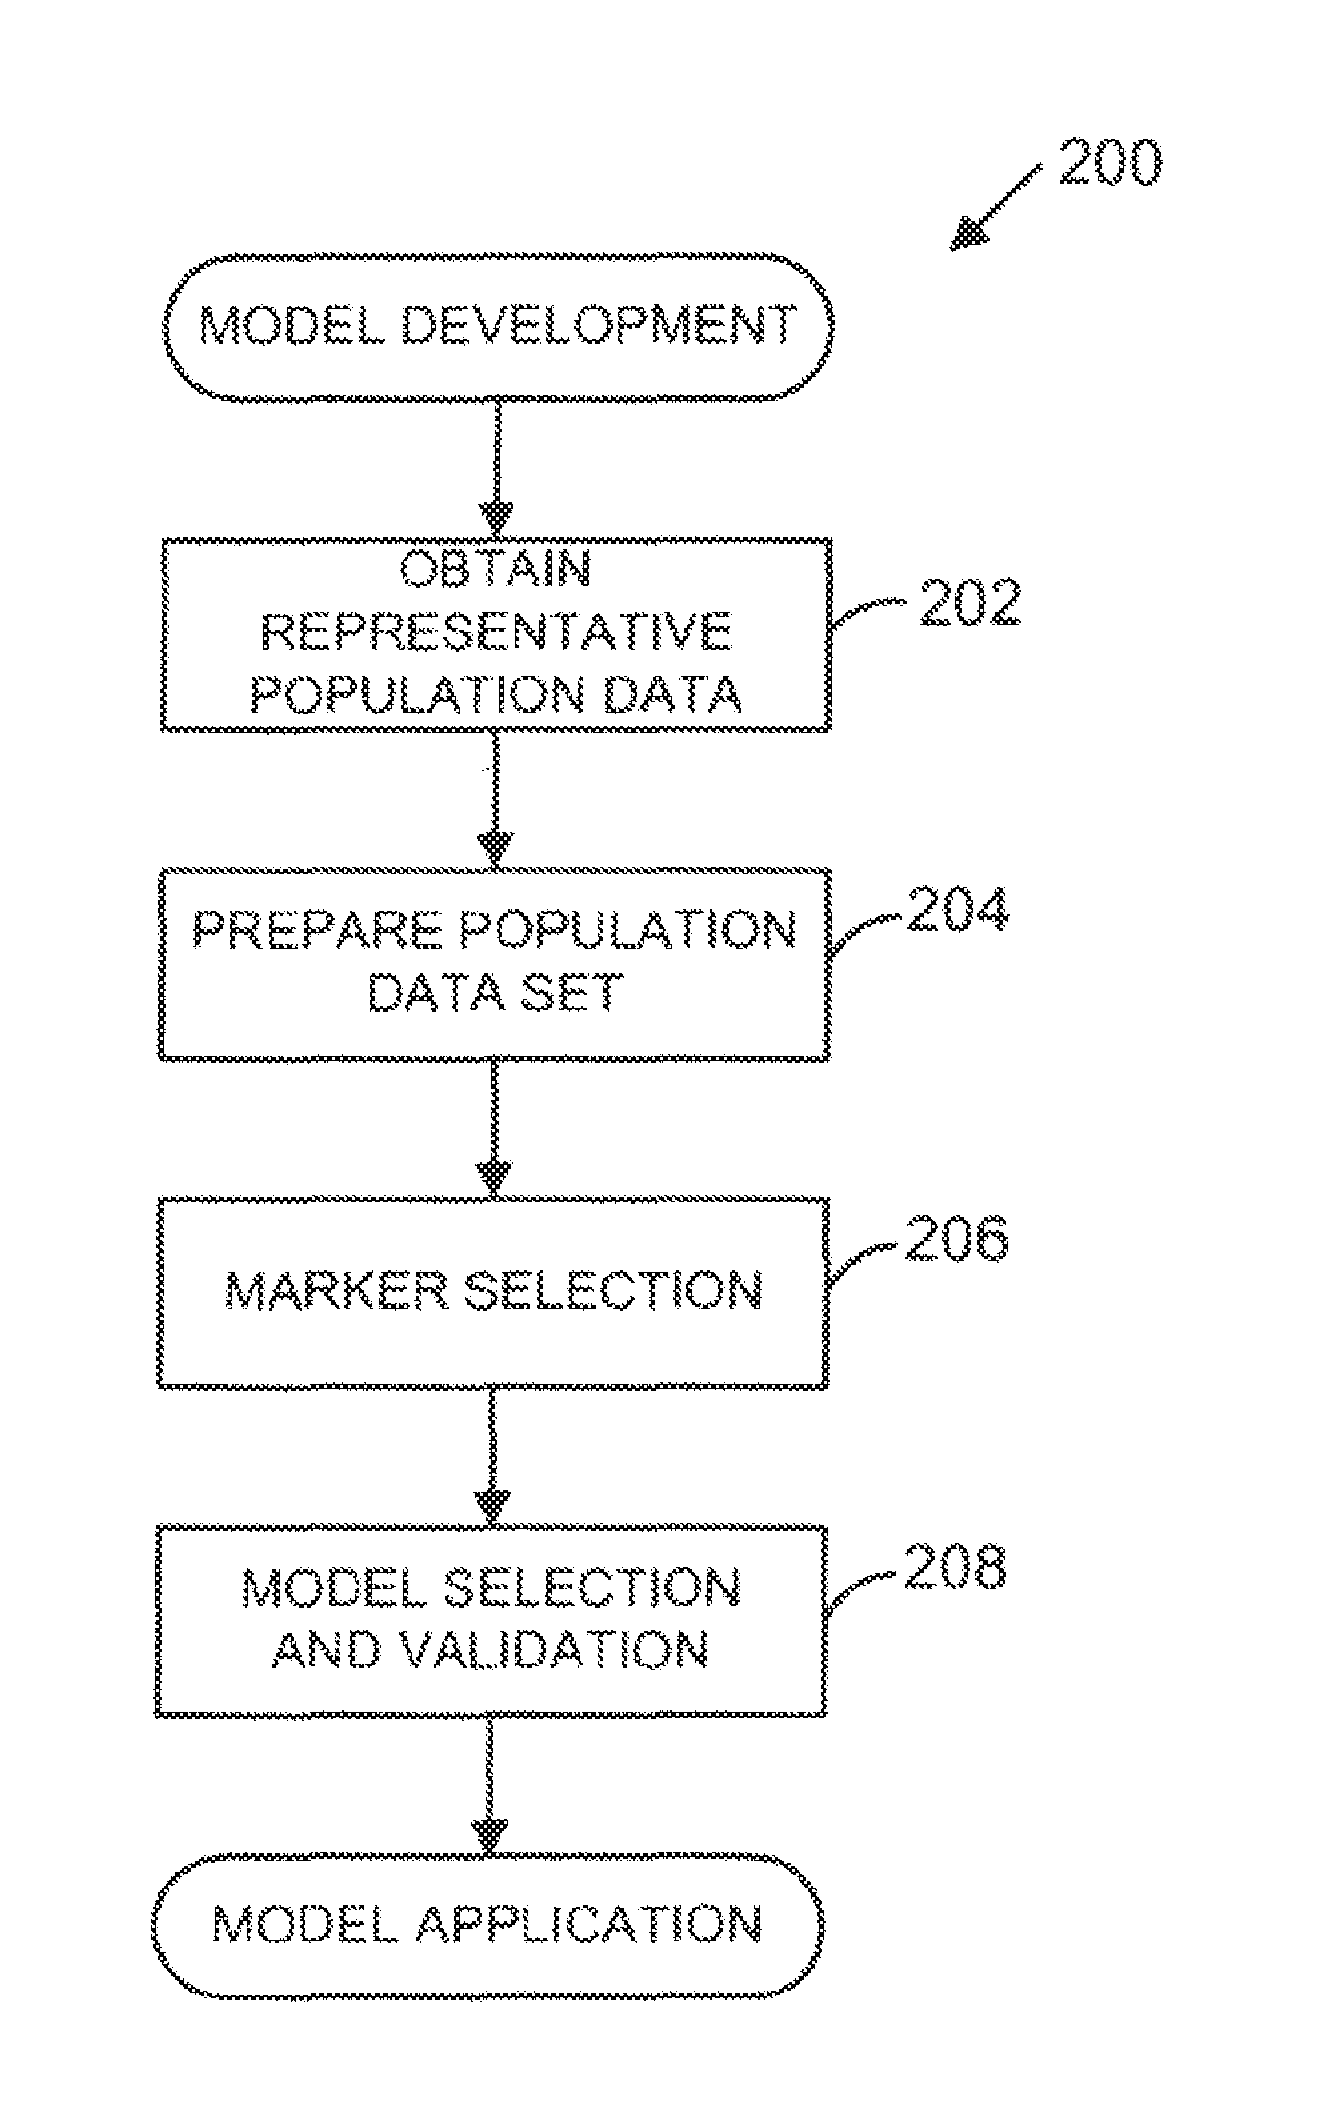
[0227]Example 1 demonstrates the use of multivariate modeling to transform observed serum biomarker levels into an SDI score useful in predicting the rate of change in total Sharp score (TSS, which is synonymous with and may also be referred to throughout as mSS), and thus predicting radiographic progression in the RA subject. Certain embodiments of the present teachings comprise utilizing the SDMRK set of biomarkers to determine an SDI score that can be used to estimate rates of progression of inflammatory disease and, specifically, predict joint damage in the RA subject.

[0228]Biomarkers were analyzed in samples from 24 subjects with early aggressive RA who participated in a two-year blinded study comparing MTX+infliximab treatment with MTX alone. Subjects were evaluated by ultrasound (US) power Doppler at 0, 18, 54 and 110 weeks, and scored for synovial thickening (ST) and vascularity by power Doppler area (PDA). Joint damage was assessed by radiographic examination and determinat...

example 2

[0264]Example 2 demonstrates that biomarkers used according to the methods of the present teachings correlate with MRI measurements of joint inflammation and damage.

[0265]In this Example, samples were analyzed from 36 pairs of patient visits with serial MRI scans, scored using the RAMRIS method by Synarc. Approximately 60 samples were completely processed and analyzed. The serum levels obtained from 118 biomarker assays were analyzed in these samples. Biomarker concentrations were used to predict absolute MRI scores (erosion, synovitis, osteitis, and joint space narrowing) as well as rate of change of erosion and joint space narrowing.

Methods

[0266]Assays were designed, in multiplex or ELISA format, for measuring multiple disease-related protein biomarkers. These assays were identified through a screening and optimization process, prior to assaying the samples. All markers were analyzed by one of three platforms: ELISA, MSD®, or LUMINEX®. The respective assays, vendors, and platforms...

example 3

[0274]Example 3 demonstrates the identification of biomarkers correlated with change in total Sharp score, and the use of the present teachings in differentiating between RA subjects that are and are not experiencing joint erosion (“eroders” and “non-eroders,” respectively).

[0275]For this Example, samples were obtained from 249 RA subjects with X-ray data. The duration of RA for all subjects at time of sampling was from two to ten years. All subjects were on DMARD therapy (not biologics). Subjects were categorized as eroders vs. non-eroders, 125 of each, as identified by standard qualitative radiologist X-ray reads. Candidate biomarkers were analyzed as in Example 2 by implementing SAM. Markers were identified that differed in concentration between eroders and non-eroders, based on cross-sectional X-rays, using SAM (see Example 2). Only samples less than four years old were used, because serum protein concentrations were found to decrease as the amount of time samples were stored at...


PUM

PropertyMeasurementUnit
Currentaaaaaaaaaa
Volumeaaaaaaaaaa
Volumeaaaaaaaaaa

Abstract

A method scores a sample, by receiving a first dataset associated with a first sample obtained from a first subject, wherein said first dataset comprises quantitative data for at least two markers selected from the group consisting of: CCL22; CHI3L1; COMP; CRP; CSF1; CXCL10; EGF; ICAM1; ICAM3; ICTP; IL1B; IL2RA; IL6; IL6R; IL8; LEP; MMP1; MMP3; PYD; RETN; SAA1; THBD; TIMP1; TNFRSF11B; TNFRSF1A; TNFSF11; VCAM1; and VEGFA; and determining a first SDI score from said first dataset using an interpretation function, wherein the first SDI score provides a quantitative measure of the rate of change in joint structural damage in said first subject.

Description

RELATED APPLICATIONS[0001]This application claims the benefit of earlier-field and co-pending U.S. Application No. 61 / 410,883 filed on Nov. 6, 2010 which is hereby incorporated by reference in its entirety for all purposes.INTRODUCTION[0002]The present teachings are generally directed to biomarkers that report on the rate of disease progression in a subject with inflammatory and / or autoimmune disease, for example rheumatoid arthritis (RA), as well as various other embodiments as described herein.[0003]The section headings used herein are for convenience and organizational purposes only, and are not to be construed as limiting the subject matter described in any way. All literature and similar materials cited in this application, including but not limited to scientific publications, articles, books, treatises, published patent applications, issued patents, and internet web pages, regardless the format of such literature and similar materials, are expressly incorporated by reference i...

Claims


Application Information

Patent Timeline
IPC IPC(8): G06F19/18G16B20/20
CPCG01N33/564G01N2800/102C12Q1/6883C12Q2600/118C12Q2600/158G16B20/00G16B20/20
Inventor HAGSTROM, WILLIAM A.CHERNOFF, DAVID N.SHEN, YIJINGCAVET, GUY L.CENTOLA, MICHAEL
Owner CRESCENDO BIOSCI
Why Eureka
Try Eureka