Method and system for monitoring the functionality of electrolysis cells

Inactive Publication Date: 2015-01-22
COVESTRO DEUTSCHLAND AG
0 Cites 15 Cited by

AI-Extracted Technical Summary

Problems solved by technology

These can also be designed dynamically and can even be optimized on the basis of historical data and learning-capable structures, however, they do not permit the qualitative or quantitative determination of errors in individual electrodes.
If the voltage of a cell only increases slowly, however, a defect can be presumed.
The better data base is...

Benefits of technology

[0054]These items of information permit, for example, a targeted alarm...

Abstract

Method and system for monitoring the functionality of electrolysis cells for use in chlor-alkali electrolysis. The method uses the analysis of the current/voltage characteristic of the cells in relation to an AC voltage overlaid on the operating voltage

Application Domain

Technology Topic

Image

  • Method and system for monitoring the functionality of electrolysis cells
  • Method and system for monitoring the functionality of electrolysis cells
  • Method and system for monitoring the functionality of electrolysis cells

Examples

  • Experimental program(1)

Example

[0095]The examples describe the novel method for monitoring industrial electrolysis single cells for two experimentally simulated malfunctions in detail.
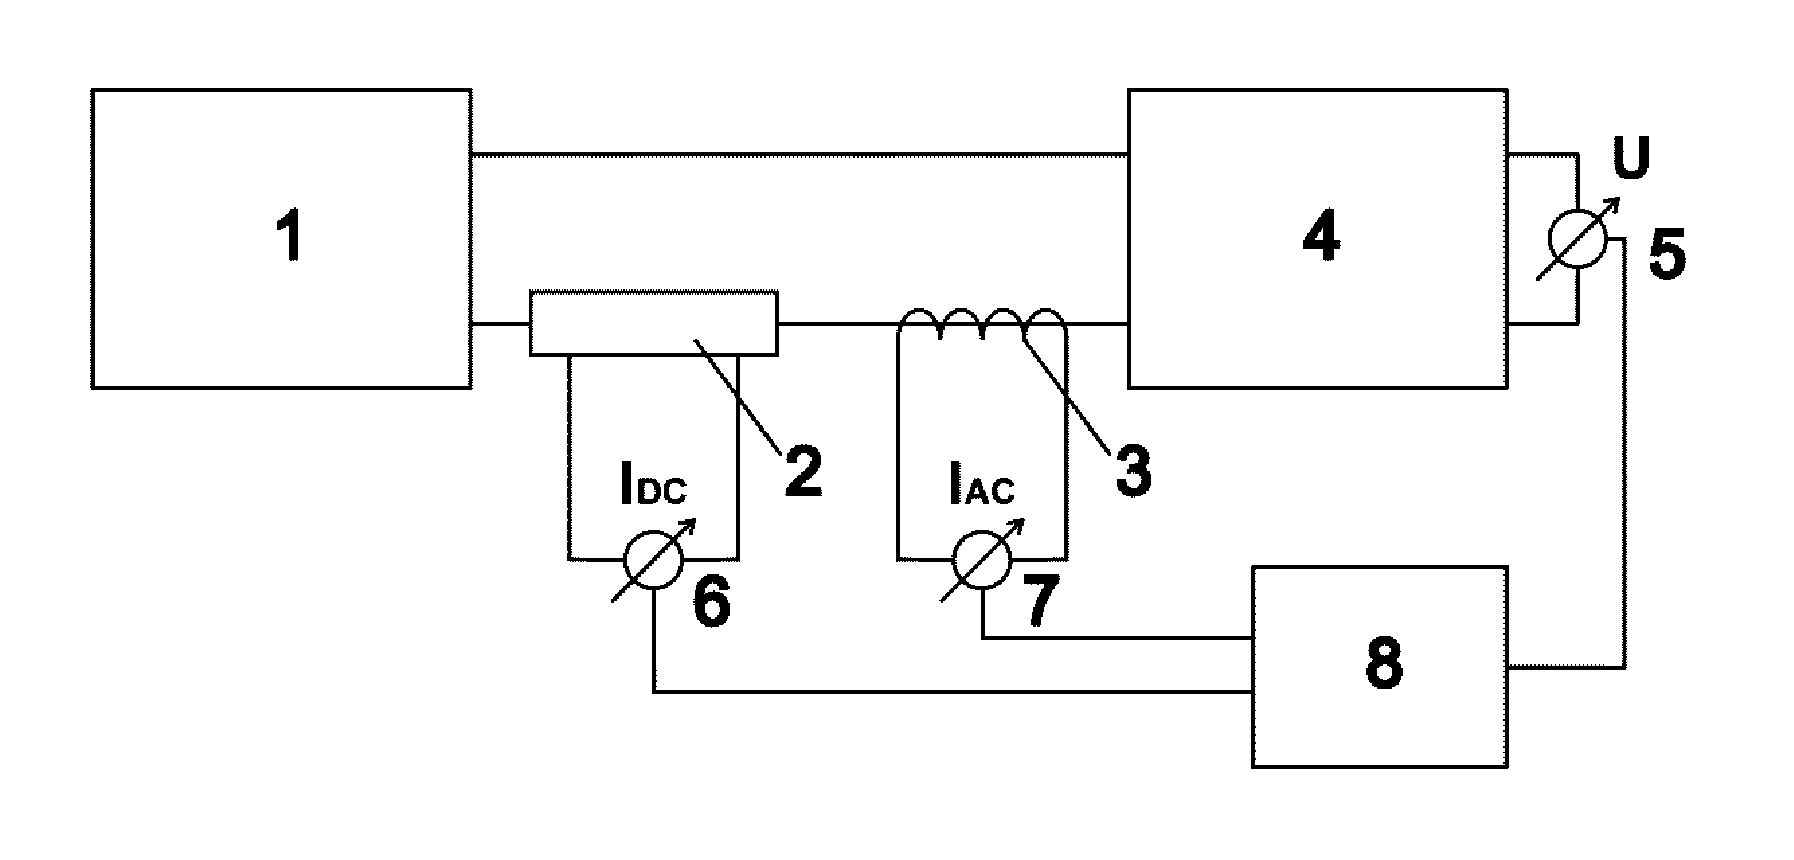
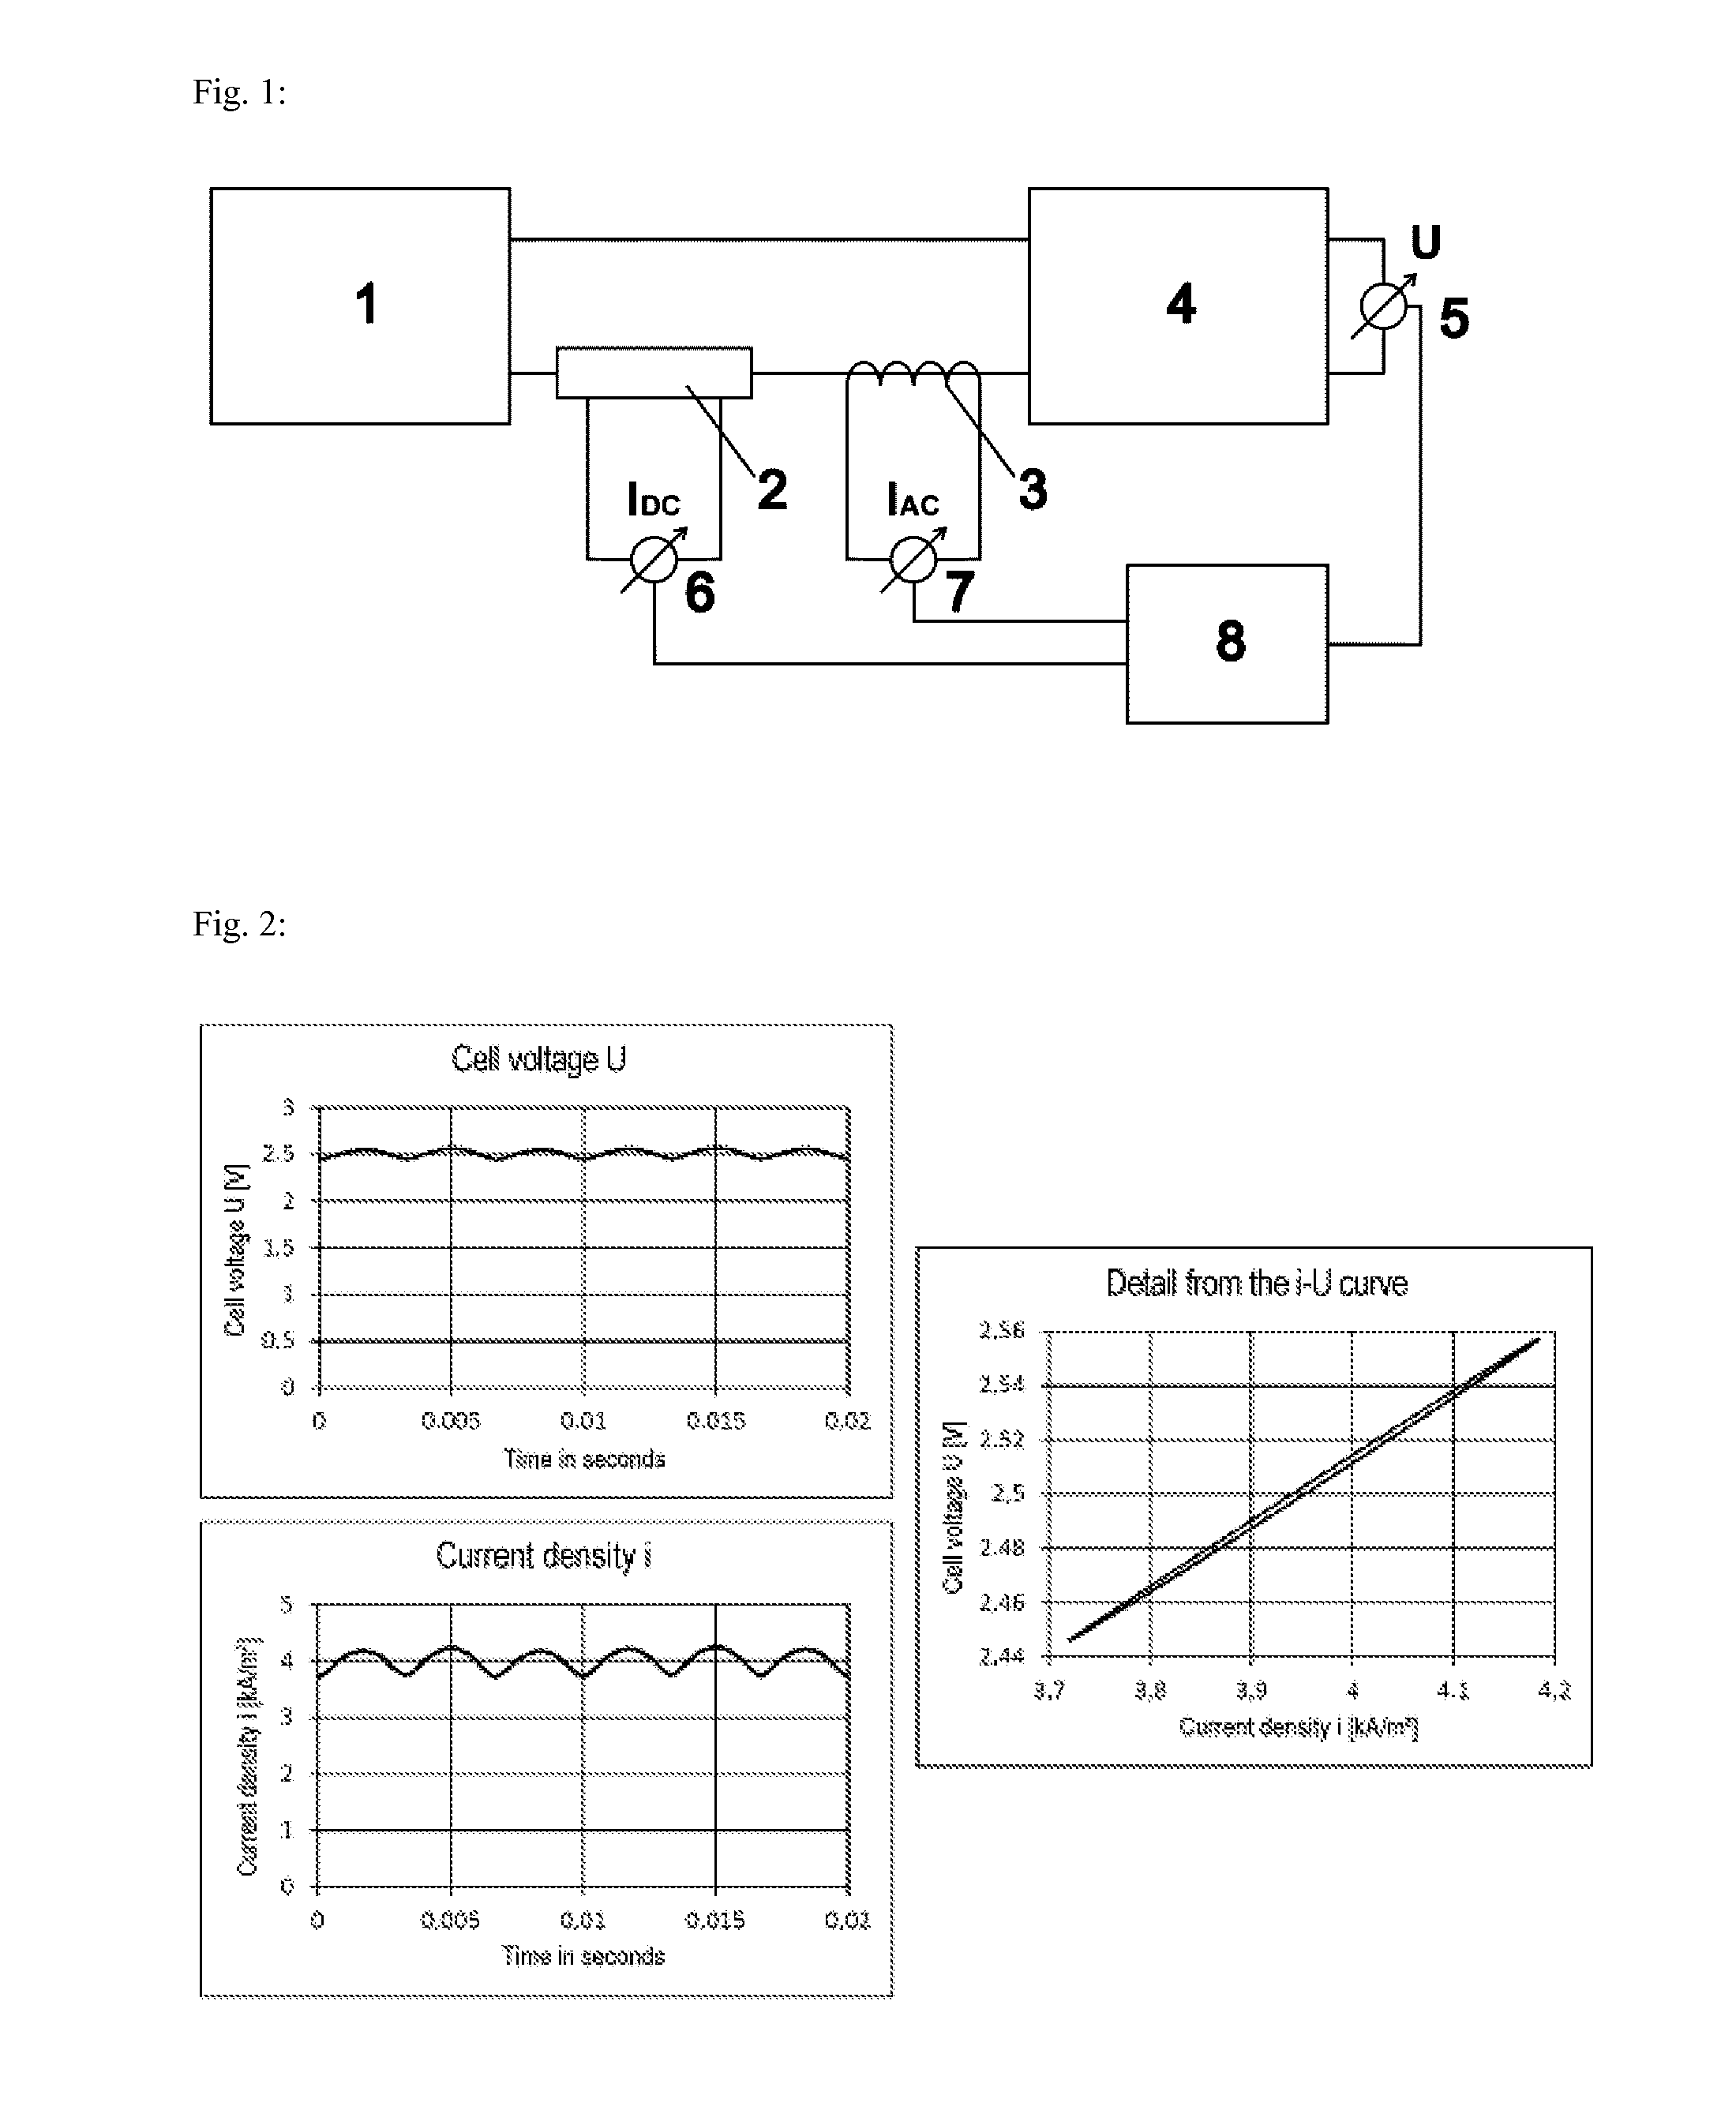
[0096]In this case, the dynamic current-voltage characteristic of the single cells is analyzed for the monitoring. It results from the reaction of the cell 4 to the periodic alternating current signal, which is present as a harmonic wave of the direct current as a result of the ripple of the rectifier 1 in many industrial electrolysis facilities.
[0097]FIG. 1 shows the measurement construction in principle. Due to the ripple, the current I, with which the electrolysis cell 4 is supplied by the rectifier 1, is not constant but rather oscillates periodically by a small amount. This minimal current change also has an effect on the electrolysis cell 4, which reacts with periodic changes of the cell voltage U. The idea of the measurement concept is that the time curve of both the current and also the cell voltage is detected and by comparison of the periodic changes of both dimensions, inferences can be drawn about the status of the cell and its components (see FIG. 2).
[0098]As examples, membrane damage was experimentally simulated: The goal of the experiments was to detect the fault of the functionality of a chlor-alkali electrolysis cell by way of the monitoring method according to the invention after intentional damage of the membrane:
[0099]a) by calcium contamination
[0100]b) by perforation (pinhole).
[0101]By applying this novel system, the various types of damage are not only to be generally recognized, but rather also are to be identified or differentiated from one another.
[0102]For this purpose, a chlor-alkali laboratory cell (anode: expanded metal dimensionally-stable anode (DSA), cathode: oxygen depolarized cathode (ODC), membrane: Flemion F 8020 Sp, finite gap arrangement) having a membrane surface area of 21 cm2 was continuously operated under typical industrial conditions (Tcatholyte=Tanolyte=80° C., WNaCl=19 wt.-%, WNaOH32 wt.-%, slight basic solution overpressure) at a mean current density of 4 kA/m2. A 6 pulse laboratory rectifier, which corresponds to the construction of an industrially used rectifier, was used as the power supply.
[0103]The membrane damage was carried out as follows: [0104] a) membrane contamination:
[0105]after reaching the stationary state, the metering of a calcium-containing brine was performed (WNaCl=19 wt.%, WCa2+=2.5 wt.-%) directly into the anode chamber by means of a syringe pump (delivery rate: 0.5 ml/h) over the entire further experimental time, so that a calcium concentration of WCa2+=240 ppm (weight proportion) resulted in the anode chamber (beginning of the experiment identified in FIG. 4). [0106] b) Membrane perforation (pinhole):
[0107]After reaching the stationary state, the membrane was pierced using a titanium wire and an approximately 0 5 mm hole (pinhole) was generated (beginning of the experiment identified in FIG. 5). The wire had been installed in the rear side of the anode chamber together with a feed-through before the cell was put into operation. For the experiment, it could be moved up to the membrane from the outside without touching the DSA grating.
[0108]During the entire operation, ripple measurements were carried out at intervals of 15 minutes (during the experiment even at significantly shorter intervals of up to 10 seconds), in that the ripple cell voltage U and the ripple cell current I (voltage drop at a shunt) were detected at sampling rates of 500 kHz via a measuring card connected to a computer. By plotting the measured cell voltage U against the cell current density i, the ripple i-U curves according to FIG. 2 were obtained, which were analyzed by means of linear regression. Two ripple i-U curves are shown before and during calcium contamination as examples in FIG. 3 (the measurement times are plotted in FIG. 4). The dashed straight line shows the linear regression of the curve. The circles correspond to the mean values of the ripple cell voltage and of the ripple current density.
[0109]The time curves of the mean cell voltage and of the axis section and of the current-dependent component (slope b multiplied by mean current density, here: 4 kA/m2), ascertained from the linear regression, are shown for the membrane contamination in FIG. 4 and for the membrane perforation in FIG. 5.
[0110]The prior art is heretofore the tracking of the time change of the cell voltage, which does indicate a malfunction, but does not permit further diagnosis. The novel system provides additional items of information for diagnosis in the form of the time change of the axis section and of the current-dependent component of the ripple i-U curves. The analyses result in the following: [0111] a) membrane contamination (FIG. 4):
[0112]Shortly after the beginning of the calcium addition, the cell voltage increases continuously. It is known that calcium forms poorly-soluble deposits in the membrane and therefore obstructs the sodium ion transport, so that the membrane resistance increases. As a result, the current-dependent component increases simultaneously with the mean cell voltage, while the axis section remains constant. [0113] b) membrane perforation (FIG. 5):
[0114]Basic solution passes through the pinhole into the anode chamber, increases the pH value, whereby the anodic oxygen formation is preferred and the chlorine production comes to a stop, i.e., a strong change of the electrochemical reactions occurs. Since the oxygen formation occurs at lower equilibrium potential, the cell voltage decreases abruptly, as does the axis section. The current-dependent component remains nearly unchanged.
[0115]Thus, various types of membrane damage can be identified using the system according to the invention by way of the different behavior of axis section and current-dependent component.

PUM

PropertyMeasurementUnit
Frequency10000.0Hz
Current
Electric potential / voltage
tensileMPa
Particle sizePa
strength10

Description & Claims & Application Information

We can also present the details of the Description, Claims and Application information to help users get a comprehensive understanding of the technical details of the patent, such as background art, summary of invention, brief description of drawings, description of embodiments, and other original content. On the other hand, users can also determine the specific scope of protection of the technology through the list of claims; as well as understand the changes in the life cycle of the technology with the presentation of the patent timeline. Login to view more.

Similar technology patents

Method and apparatus for increasing angiogenic, growth factor in heart muscle

InactiveUS7107997B1Exposure be continuousAvoid damageDiagnosticsSurgical instrument detailsAngiogenesis FactorFactor ii
Owner:MOSES JEFFREY WARREN +3

Classification and recommendation of technical efficacy words

Why Eureka
Try Eureka