
Analysis for quantifying microscopic diffusion anisotropy

a microscopic diffusion anisotropy and analysis technology, applied in the field of methods for quantifying microscopic diffusion anisotropy, can solve the problems of high diffusion weighting, low sensitivity to microscopic anisotropy, and inability to achieve the effect of reproducibility

Active Publication Date: 2015-05-14
RANDOM WALK IMAGING AB
View PDF8 Cites 10 Cited by
  • Summary
  • Abstract
  • Description
  • Claims
  • Application Information

AI Technical Summary

Benefits of technology

The present analysis can be used to quantify microscopic anisotropy in different applications, such as non-clinical and clinical settings. It is sensitive to microscopic anisotropy and can be used with multi-dimensional correlation MR experiments or combined with other NMR or MRI methods. This analysis can provide information on the degree of anisotropy and on multi-exponential signal decays detected in laboratory settings. It can also help to characterize any pathology involving the change in microscopic anisotropy.

Problems solved by technology

Detection of microscopic anisotropy in a globally isotropic material through the characteristic echo attenuation curve in conventional single-PGSE techniques demands high diffusion weighting, often not feasible in clinical applications, and suffers from very low sensitivity to microscopic anisotropy.
The present techniques are not adequately sensitive to microscopic anisotropy and are not best suited for clinical applications.

Method used


Image

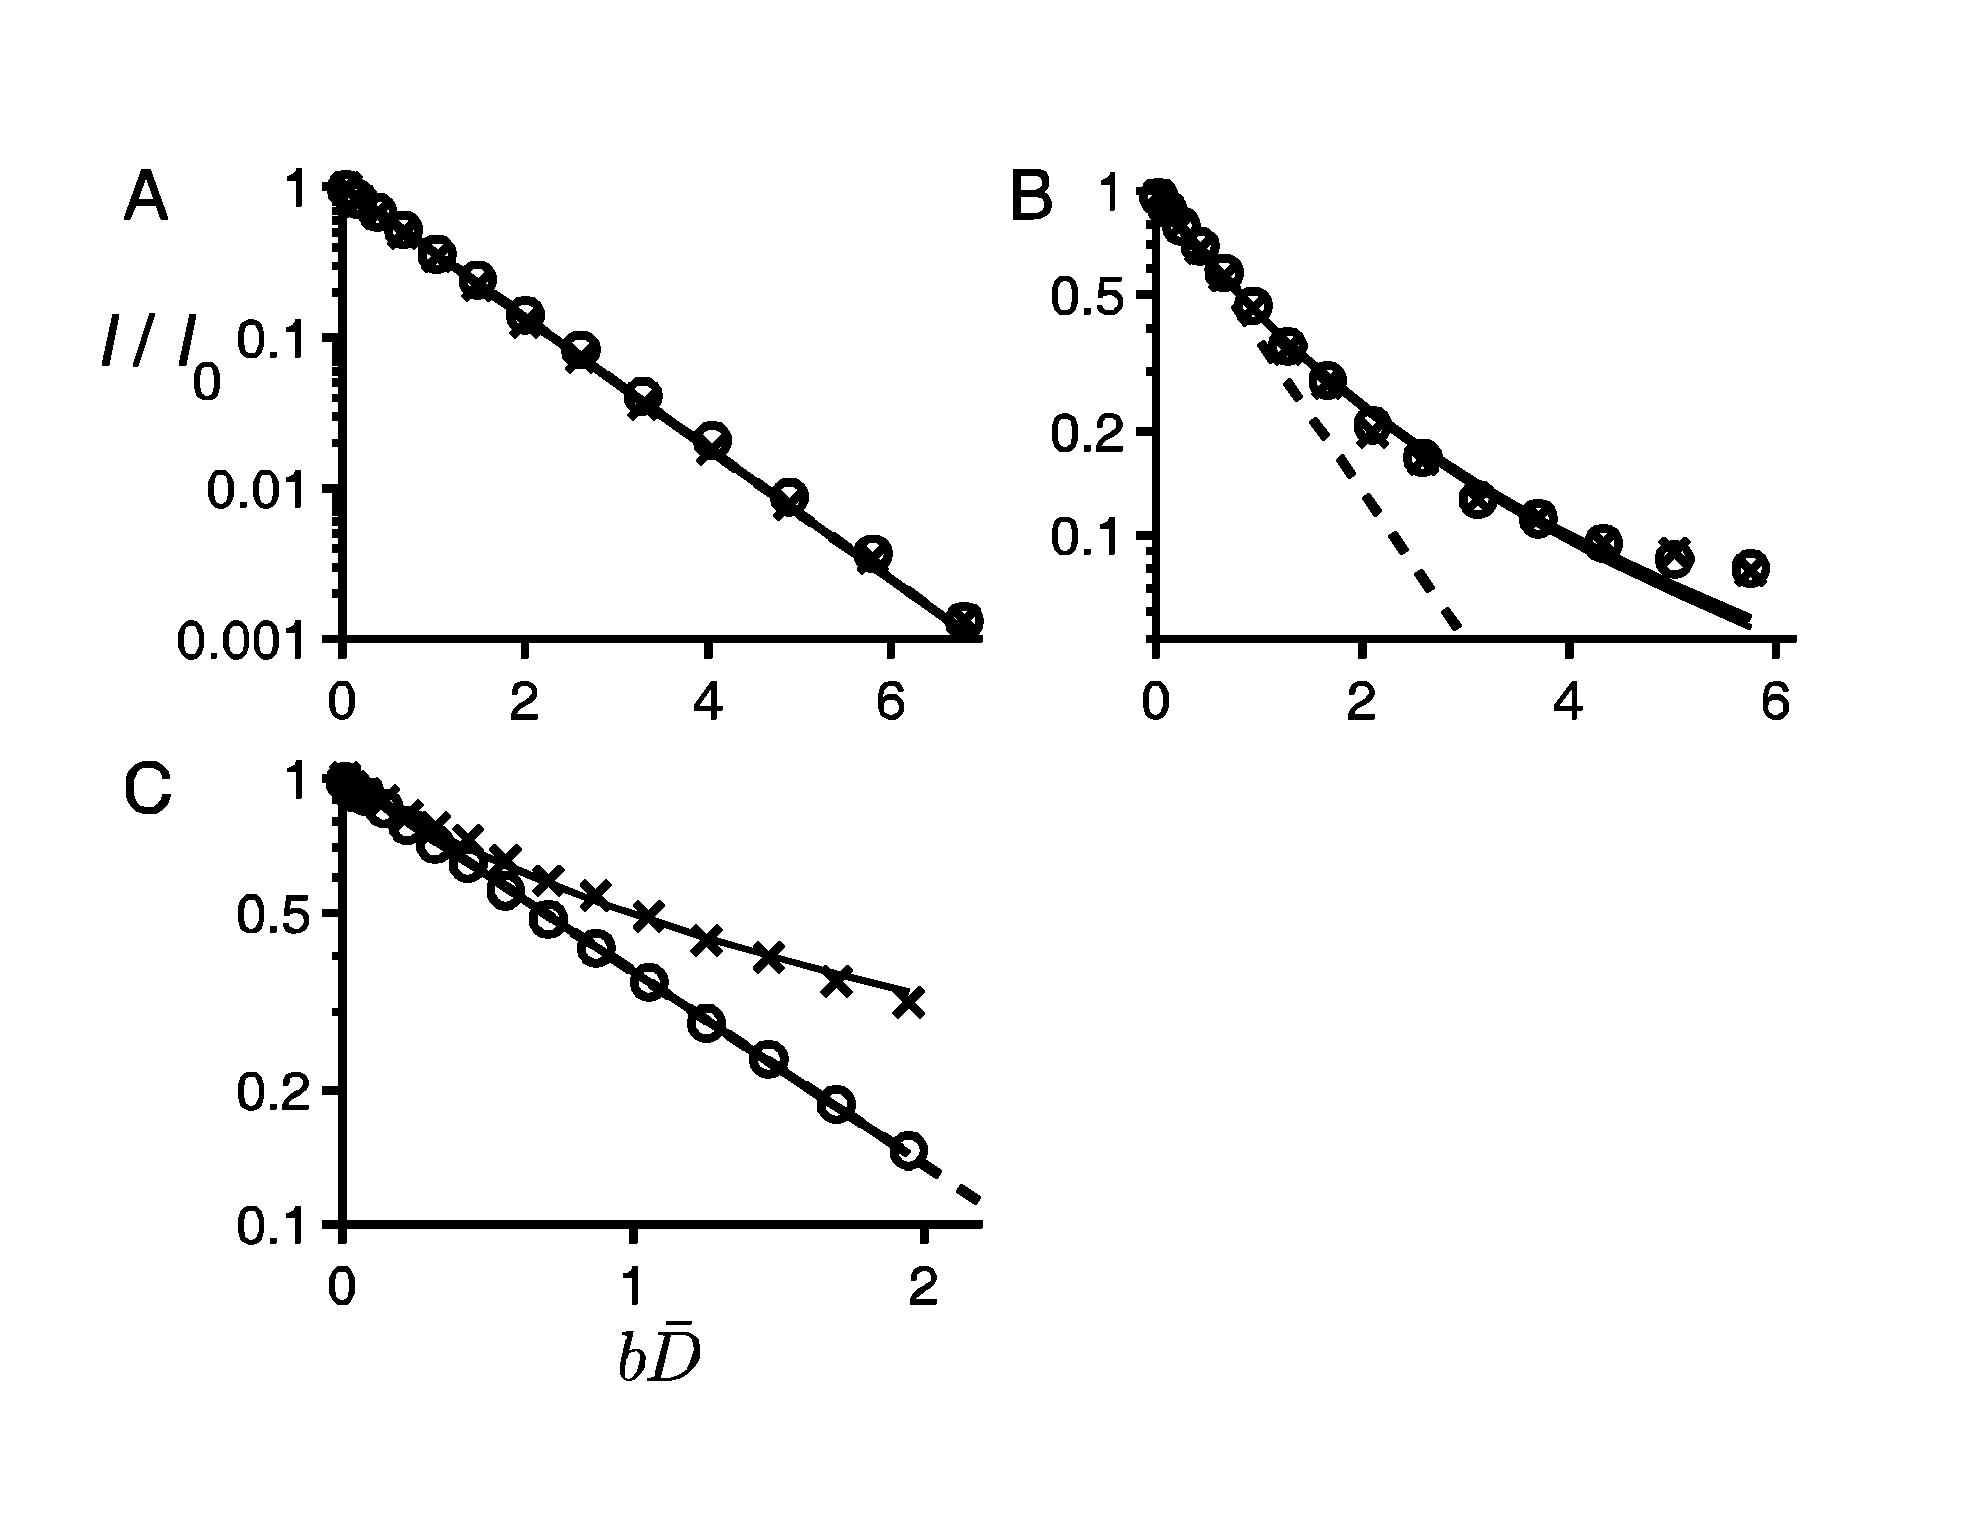
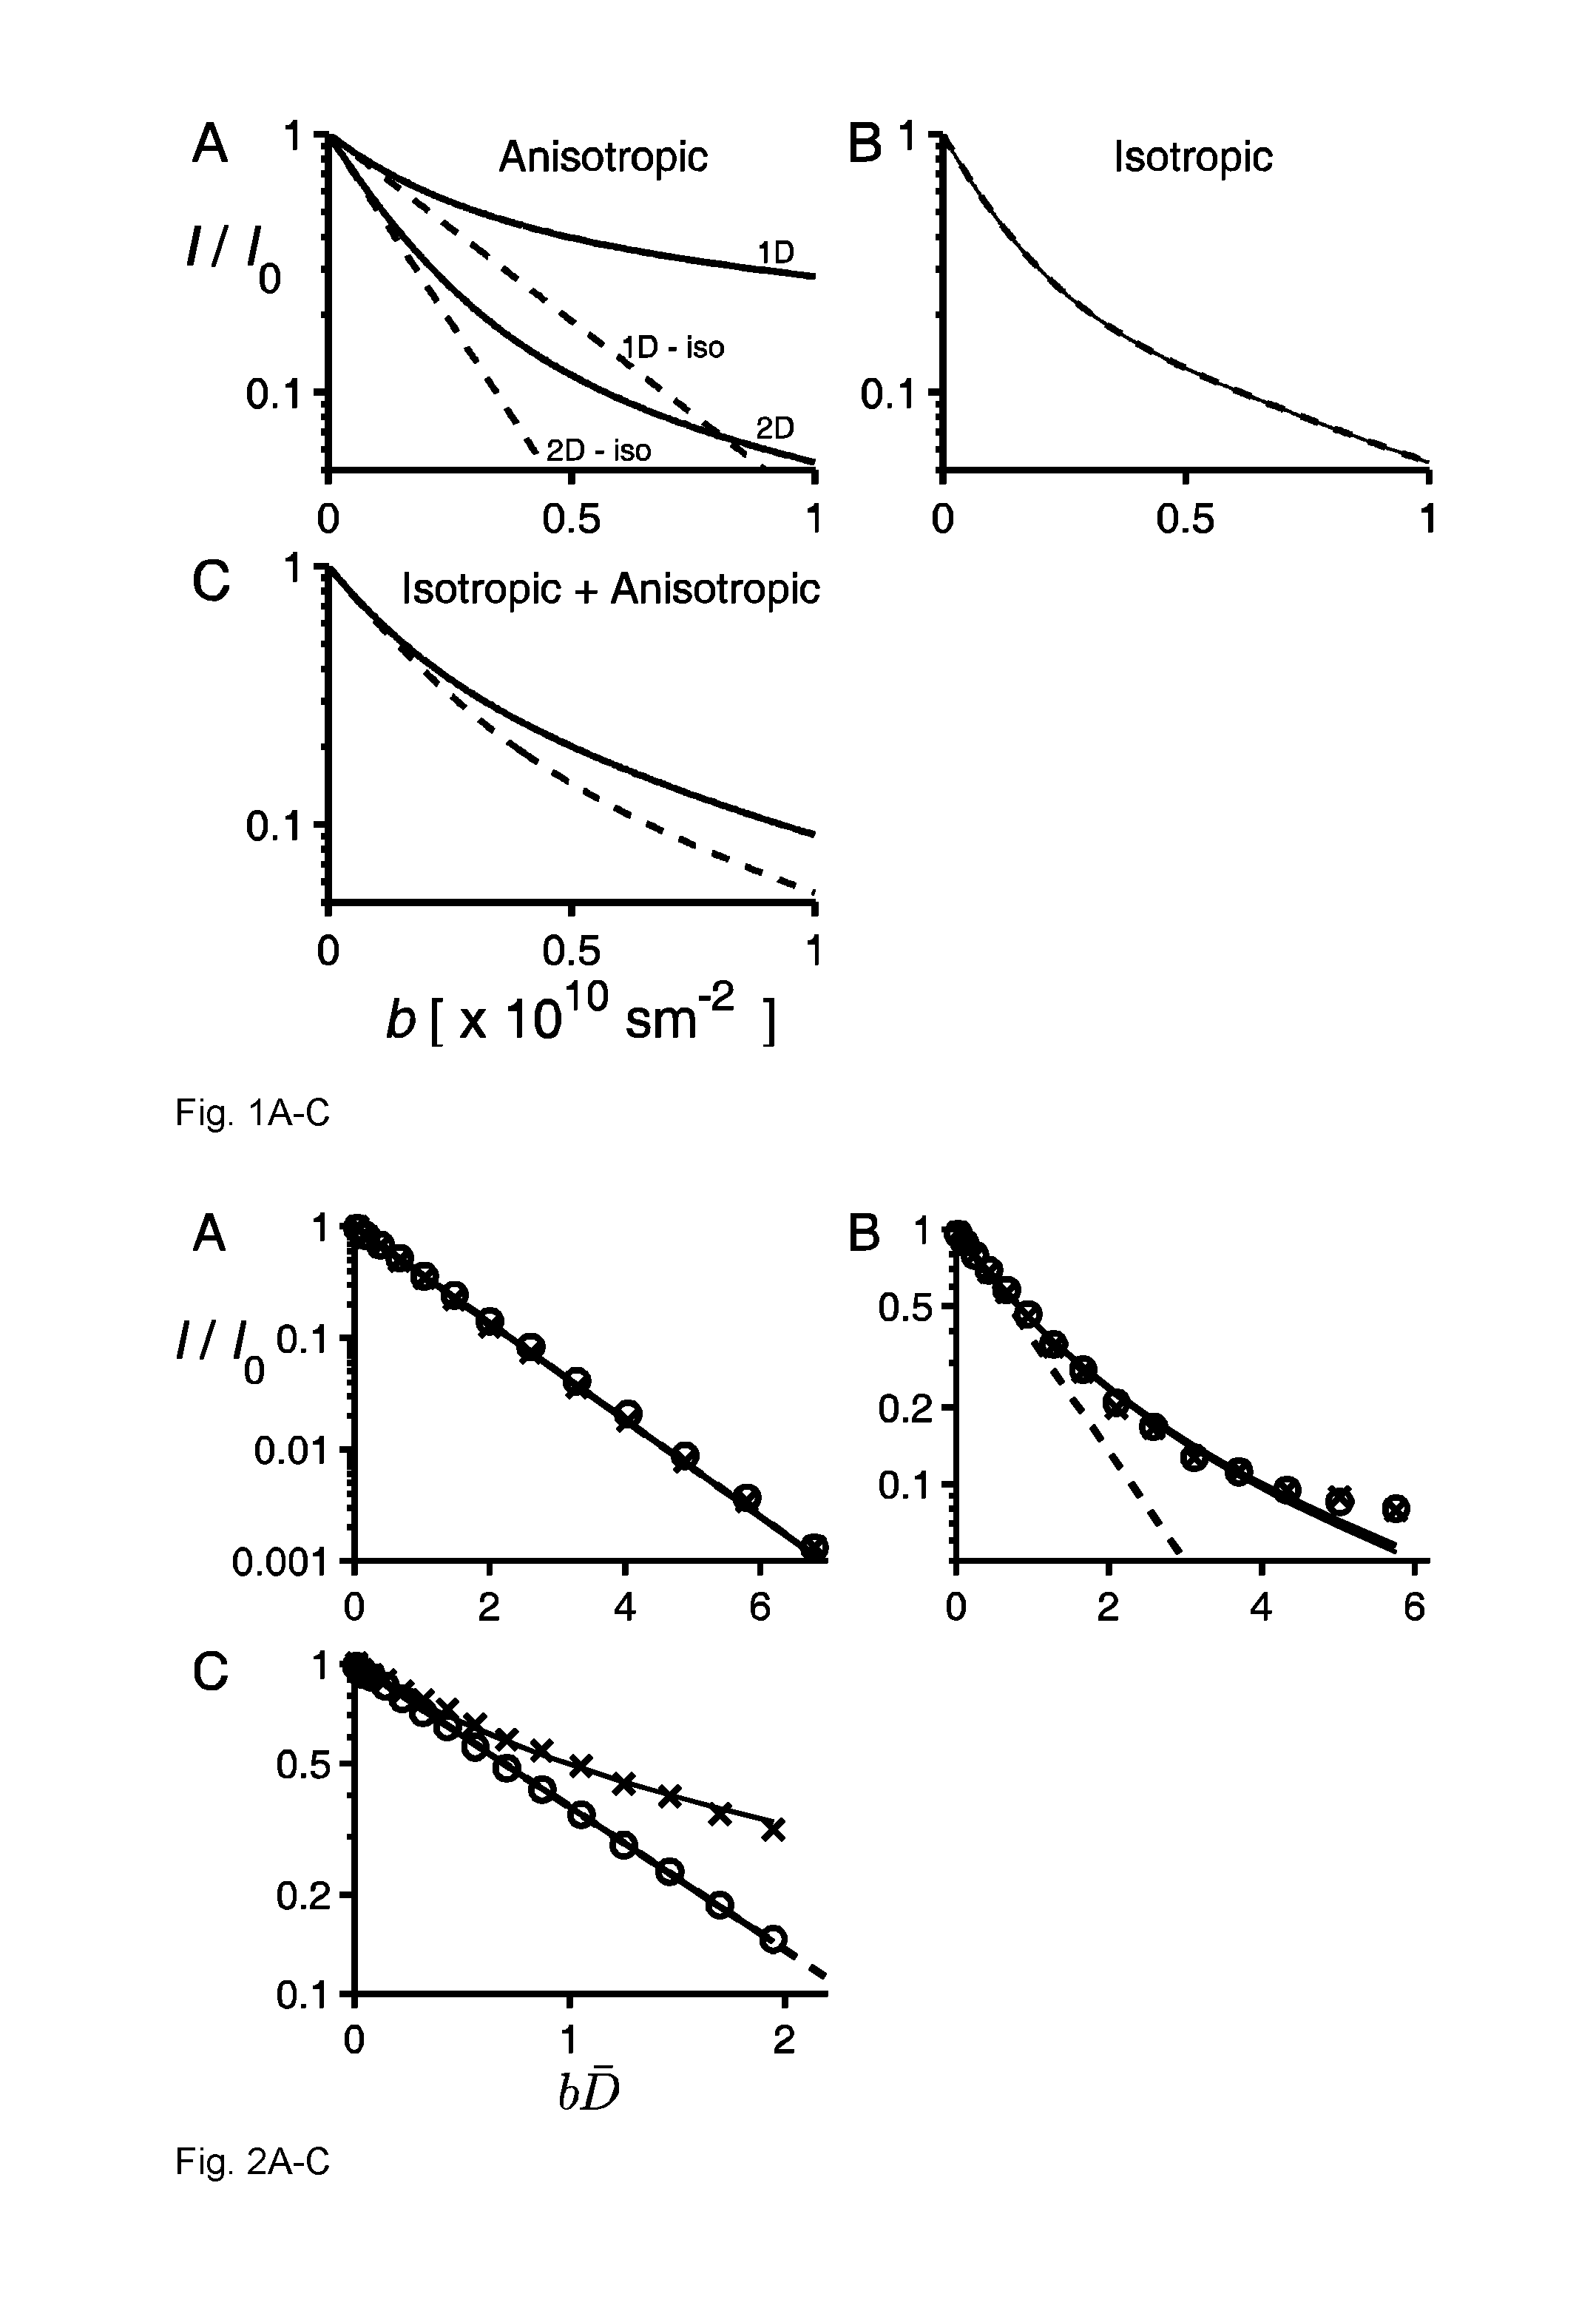
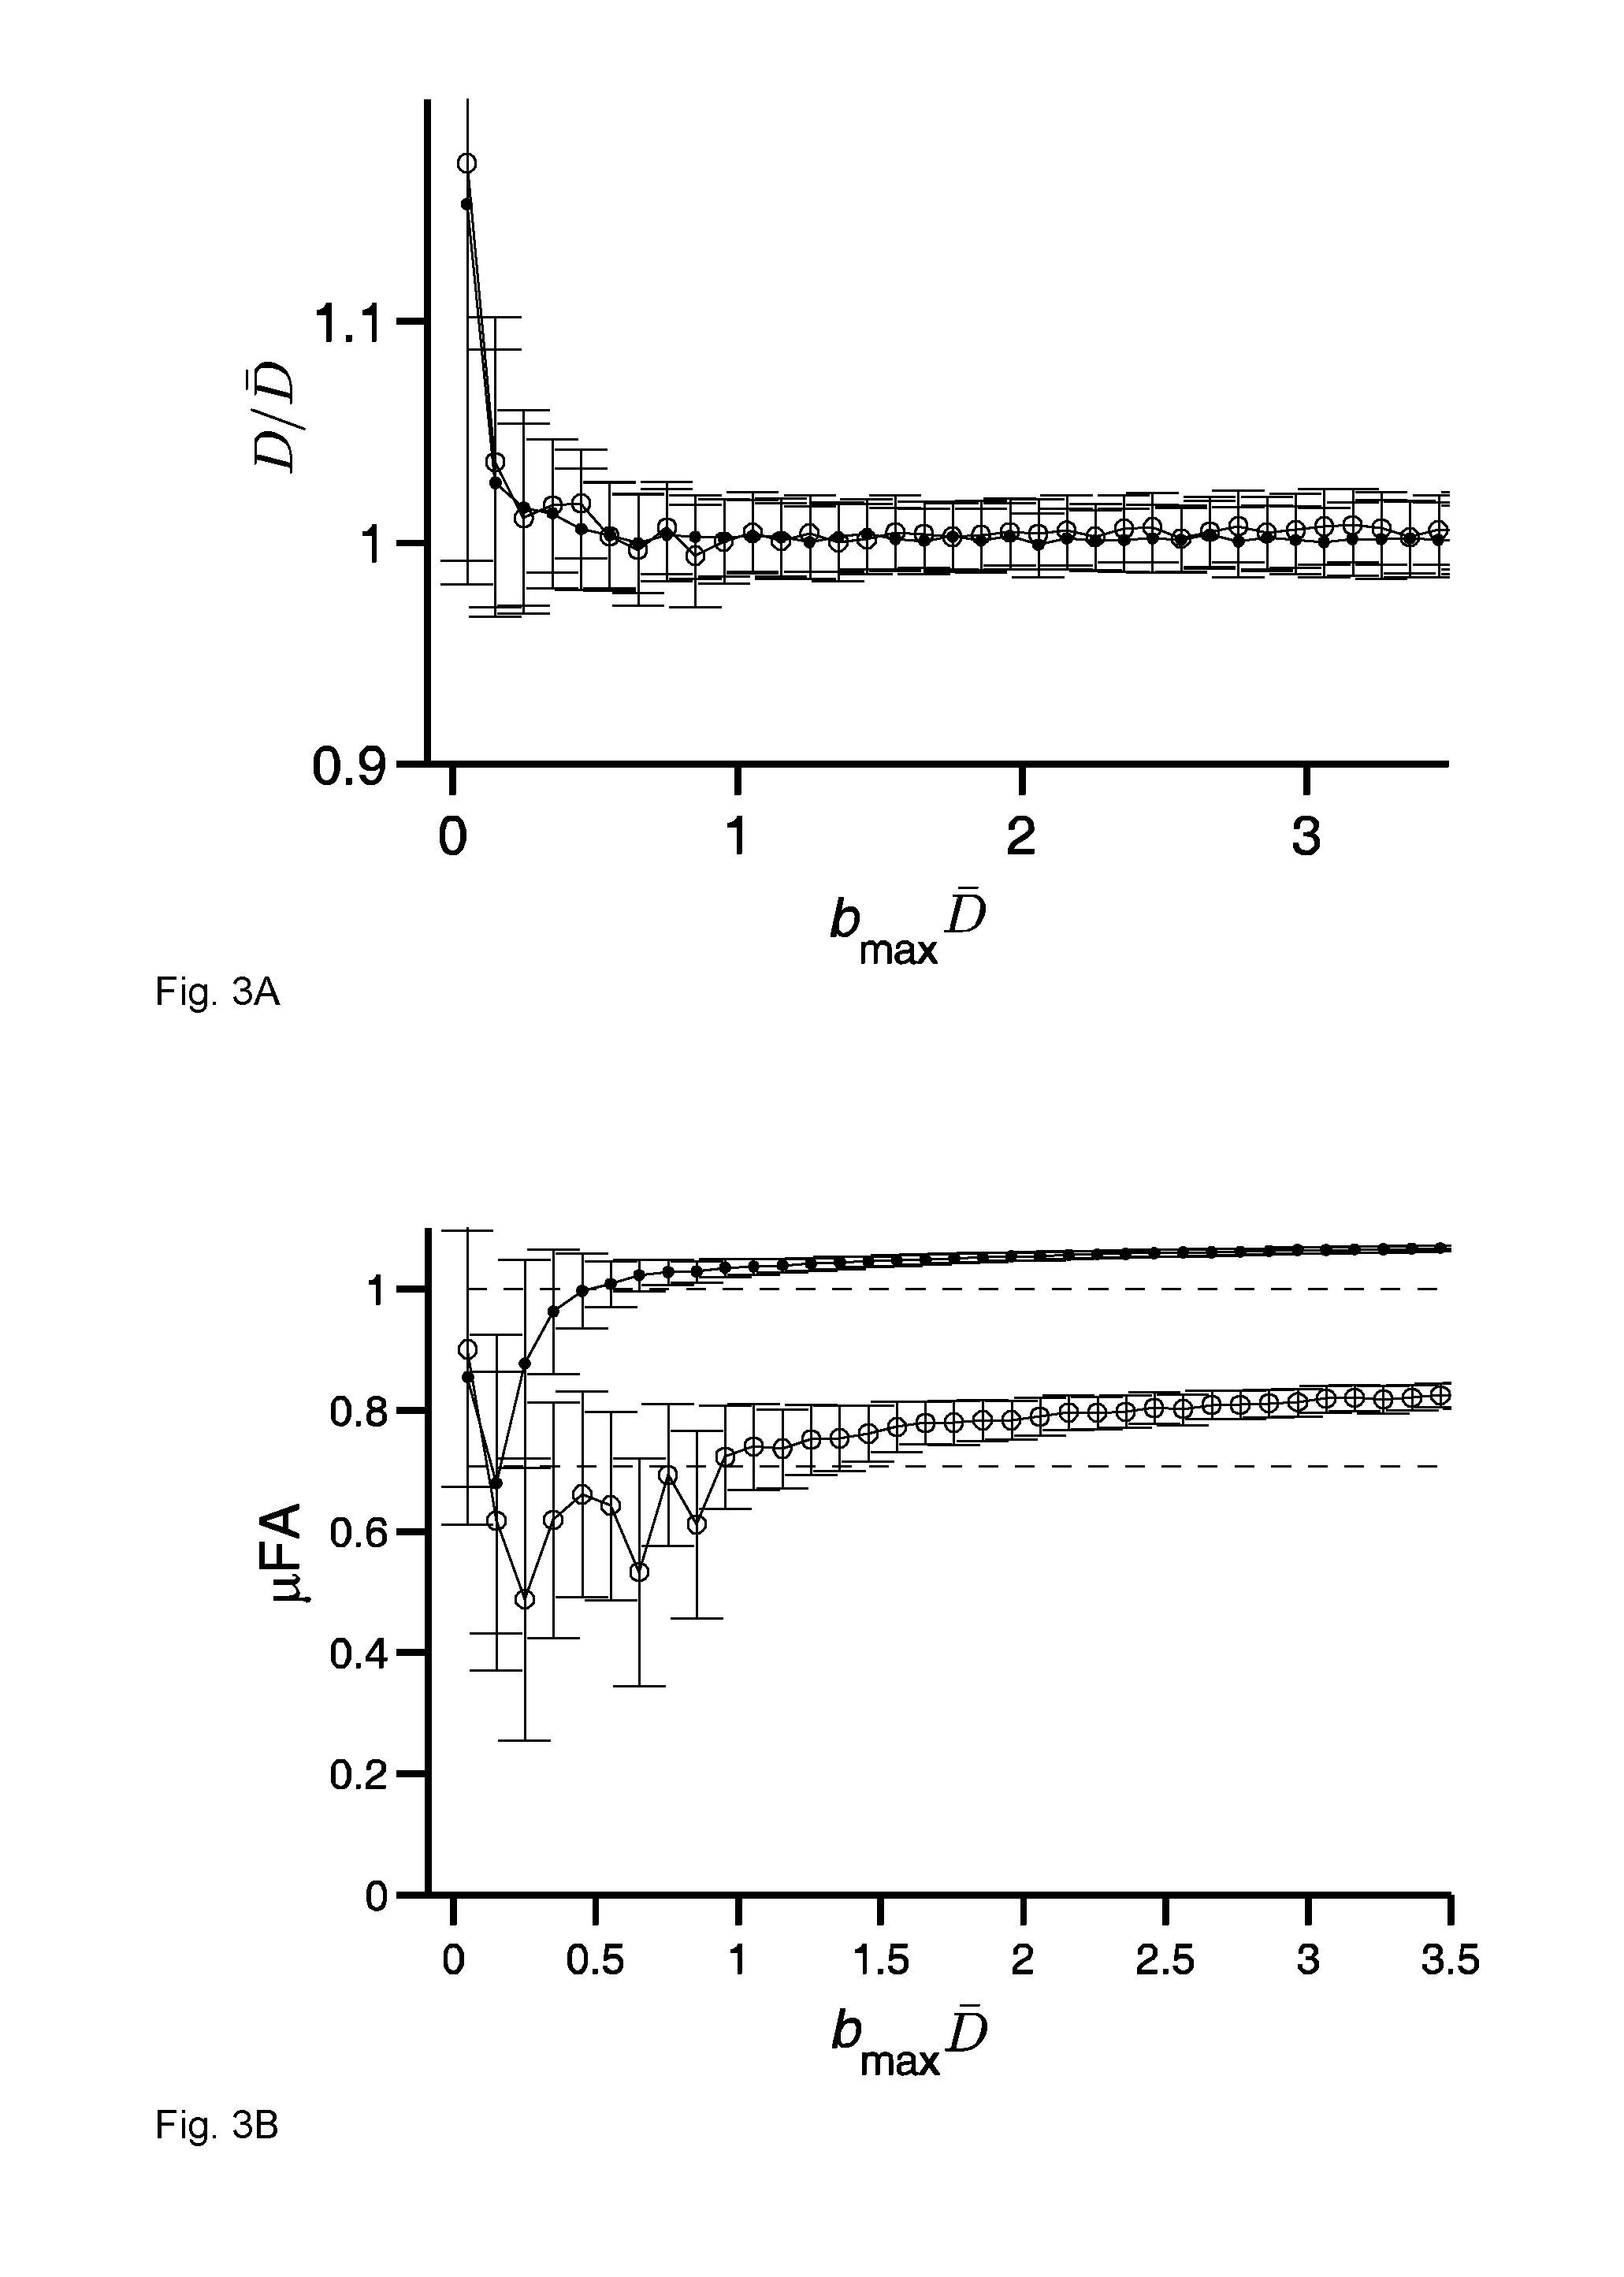
  • Analysis for quantifying microscopic diffusion anisotropy
  • Analysis for quantifying microscopic diffusion anisotropy
  • Analysis for quantifying microscopic diffusion anisotropy

Examples


Embodiment Construction

[0042]Below, specific embodiments of the analysis method according to the present invention will be disclosed. According to one specific embodiment, the method involves approximating the distribution of apparent diffusion coefficients by using a Gamma distribution and the signal attenuation by its inverse Laplace transform. This may increase the speed of the fitting procedure discussed below. The distribution of diffusion coefficients may contain isotropic and / or anisotropic contributions, it may arise due to a distribution of Gaussian diffusion contributions or it may be a consequence of a non-Gaussian nature of diffusion, e.g. restricted diffusion, or it may be due to orientation dispersion of anisotropic diffusion contributions (randomly oriented diffusion tensors) or it may be due to a combination of the above.

[0043]One of the main advantages of the analysis method according to the present invention is that it can quantify degree of microscopic anisotropy with high precision fro...


PUM


Abstract

The present invention describes a method for quantifying microscopic diffusion anisotropy and / or mean diffusivity in a material by analysis of echo attenuation curves acquired with two different gradient modulations schemes, wherein one gradient modulation scheme is based on isotropic diffusion weighting and the other gradient modulation scheme is based on non-isotropic diffusion weighting, and wherein the method comprises analyzing by comparing the signal decays of the two acquired echo attenuation curves.

Description

FIELD OF THE INVENTION[0001]The present invention relates to a method for quantifying microscopic diffusion anisotropy in a material with magnetic resonance imaging or nuclear magnetic resonance spectroscopy.TECHNICAL BACKGROUND[0002]Molecular self-diffusion measured with NMR (nuclear magnetic resonance) (Callaghan, 2011 in “Translational Dynamics & Magnetic Resonance” (Oxford, Oxford University Press); Price, 2009 in “NMR Studies of Translational Motion” (Cambridge, Cambridge University Press)) is used to non-invasively study the morphology of the water-filled pore space of a wide range of materials, e.g., rocks (Hürlimann et al., 1994 “Restricted diffusion in sedimentary rocks. Determination of surface-area-to-volume ratio and surface relaxivity”. J Magn Reson A 111, 169-178), emulsions (Topgaard et al., 2002, “Restricted self-diffusion of water in a highly concentrated W / O emulsion studied using modulated gradient spin-echo NMR”. J Magn Reson 156, 195-201.), and cheese (Mariette ...

Claims


Application Information

Patent Timeline
Patent Type & Authority Applications(United States)
IPC IPC(8): G01R33/56
CPCG01R33/56G01N24/08G01N24/081G01R33/56341A61B5/055G01N24/00G01R33/563G01R33/56308
Inventor TOPGAARD, DANIELLASIC, SAMONILSSON, MARKUS
Owner RANDOM WALK IMAGING AB
Learn More