
System and method to visualize and analyze data from image-based cellular assays or high content screening

a high-content, image-based technology, applied in image analysis, image data processing, instruments, etc., can solve the problems of large amount of data generated by high-content screening (hcs) technologies, complex known solutions, and inability to extract the full potential of high-content single cell response data, etc., to achieve easy re-grouping and simple navigation inside the results.

Inactive Publication Date: 2015-05-14
FLUOFARMA
View PDF8 Cites 8 Cited by
  • Summary
  • Abstract
  • Description
  • Claims
  • Application Information

AI Technical Summary

Benefits of technology

The invention is a software platform that allows for the efficient analysis of high content screening data and image-based cellular assays. It allows for the identification and separation of different cell populations, as well as the quantification of data and the removal of unwanted cells. The software platform is easy to use without requiring specific technical skills and supports the display and synchronization of multiple windows for visual inspection of cellular information. The invention also allows for the differentiation and discrimination of individual cells within a given well.

Problems solved by technology

High-Content Screening (HCS) technologies generate a massive amount of data.
Today's major challenge in HCS is the analysis of those data and thus the development of effective data mining and exploration tools.
Finally, today's data analyses for biological response only provide results from a black box global analysis, overall results from each well, and do not extract the full potential from the High-Content single cell response data.
The known solutions are very complicated and demand trained people to perform accurate analysis.

Method used


Image

  • System and method to visualize and analyze data from image-based cellular assays or high content screening
  • System and method to visualize and analyze data from image-based cellular assays or high content screening
  • System and method to visualize and analyze data from image-based cellular assays or high content screening

Examples


example

[0148]A cell cycle study related example is now described.

[0149]The dataset used for the case study is a 96 well plate with Hoechst (nuclei staining) and EdU-GFP (DNA synthesis). The dataset is acquired using the BD Pathway™ 855.

1. Open Attovision™ statistical file (click on open Attovision™ statistical file).

2. Load a plate layout (click on Load plate layout) and paste biological condition from excel (press copy from clipboard button, see FIG. 8). The plate layout contains a dose response of camptothecin in quadruplicates and several control wells.

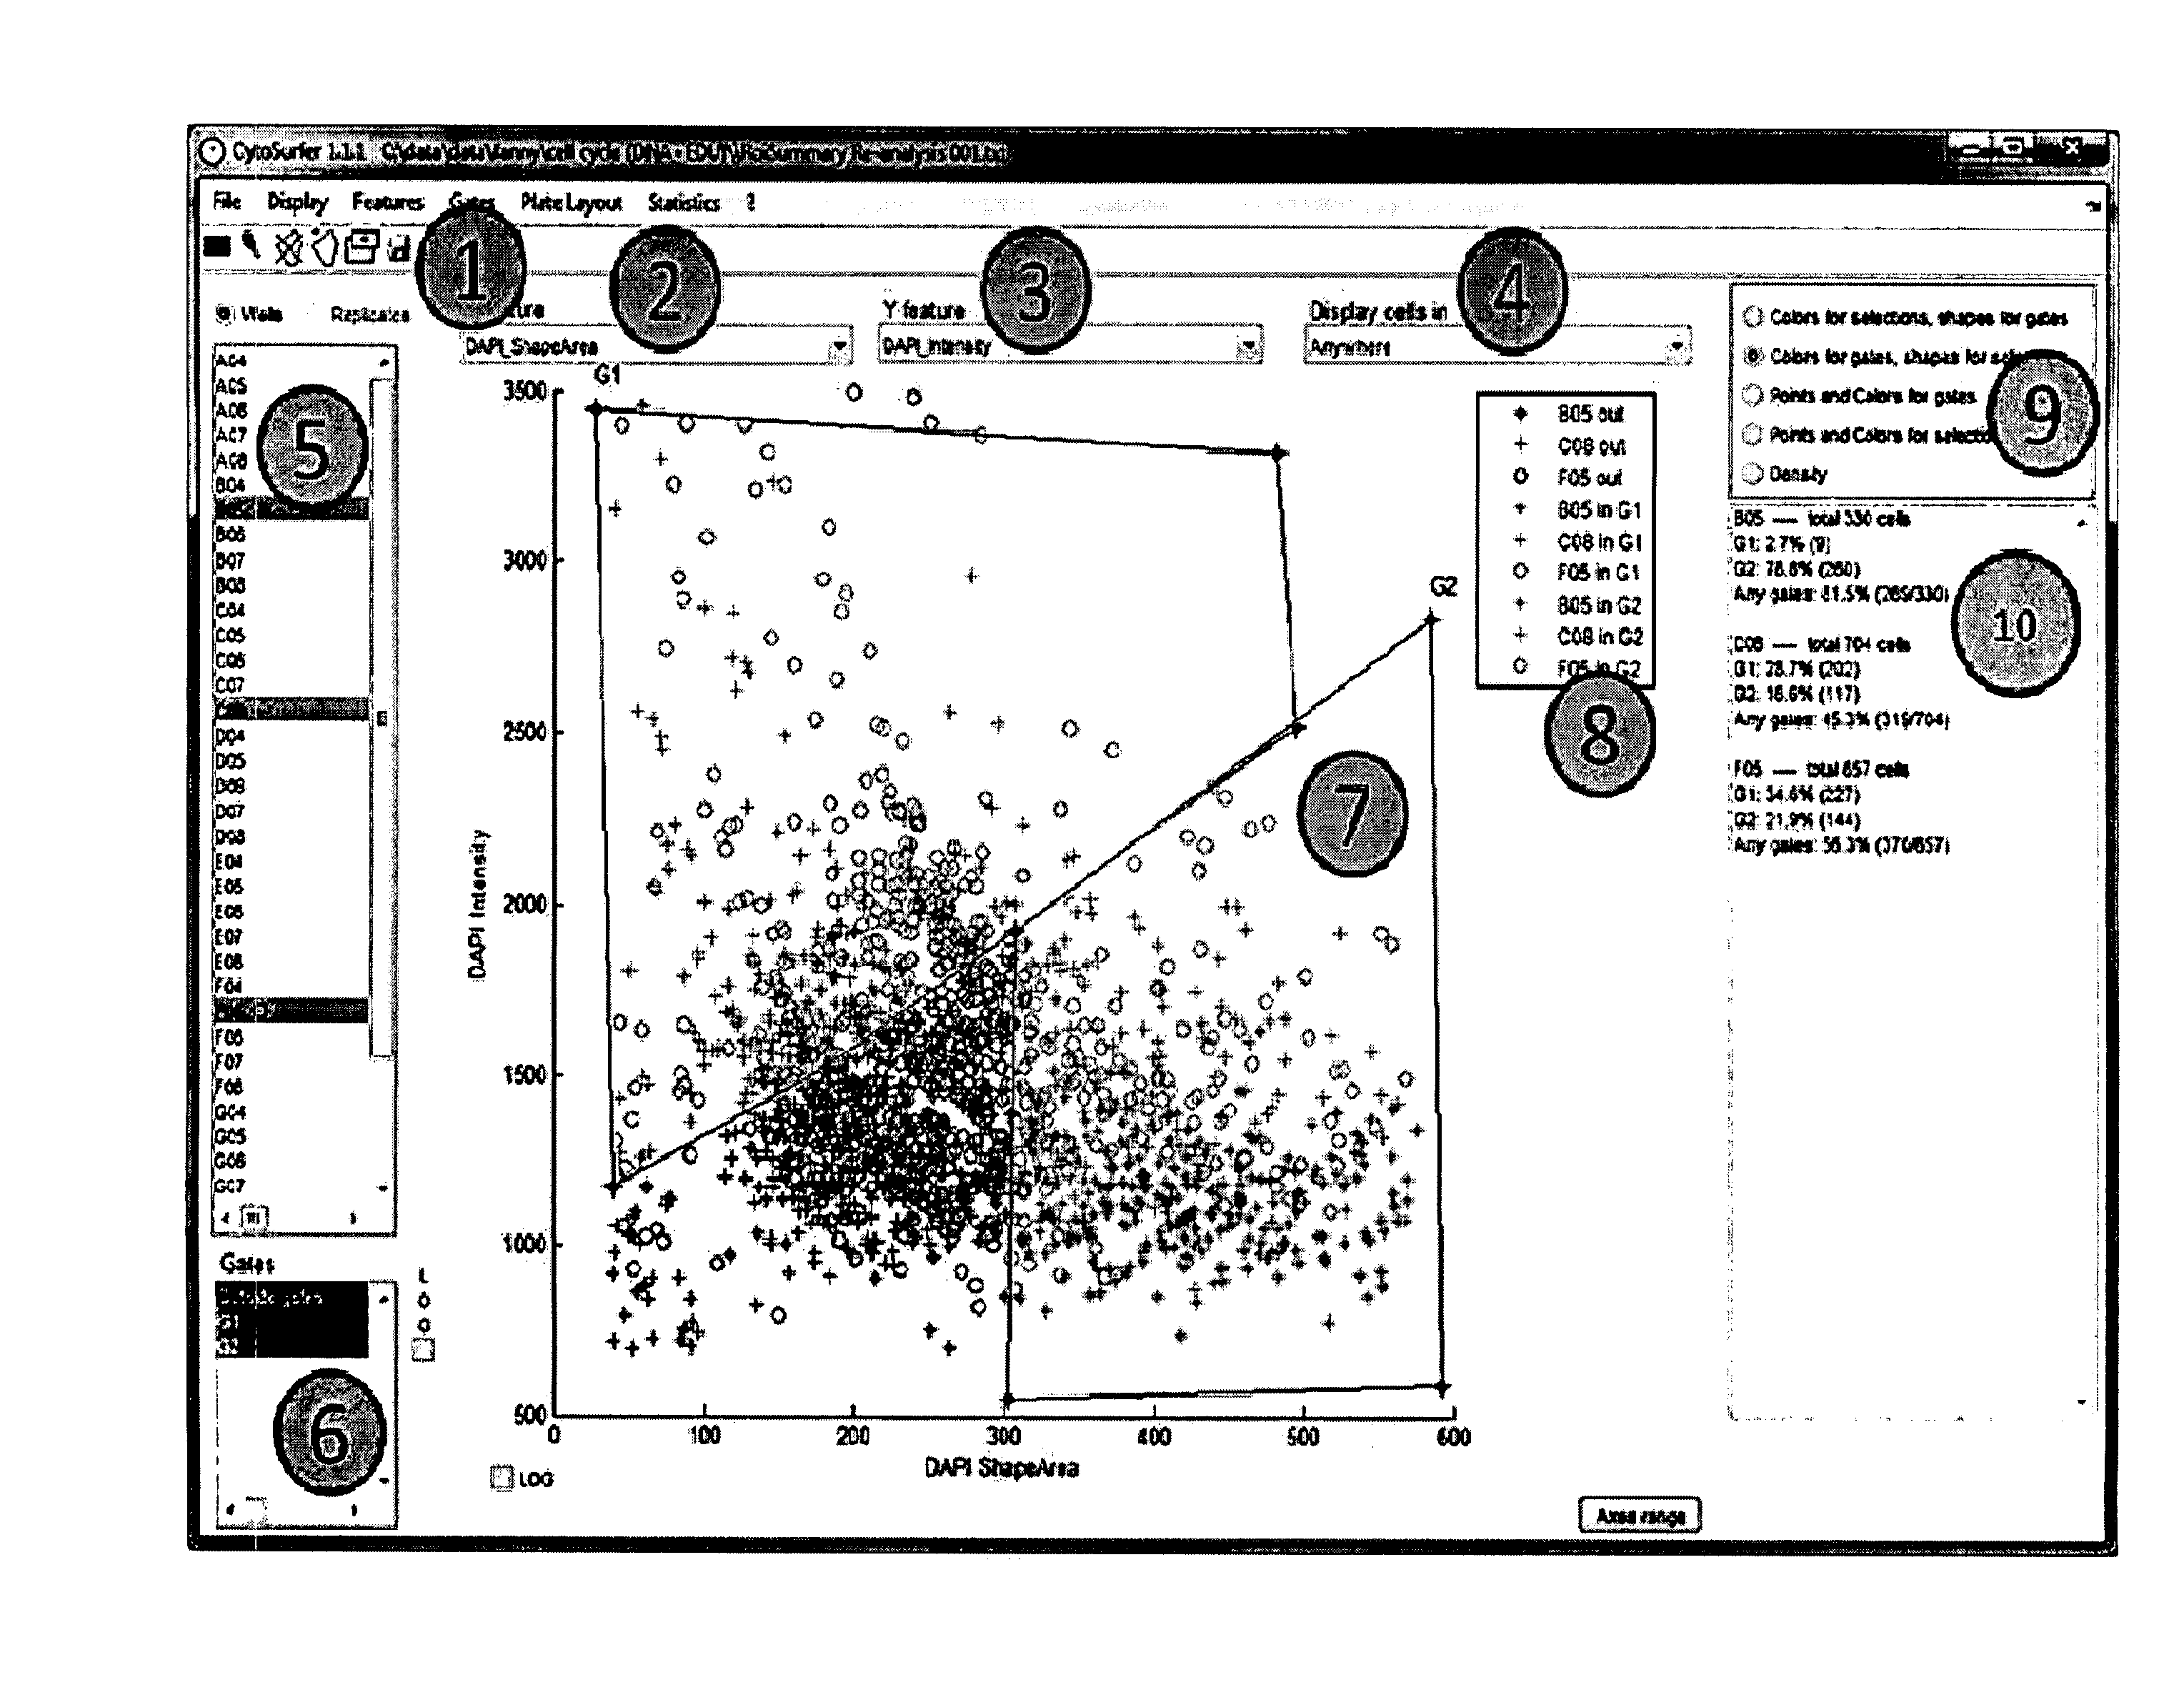
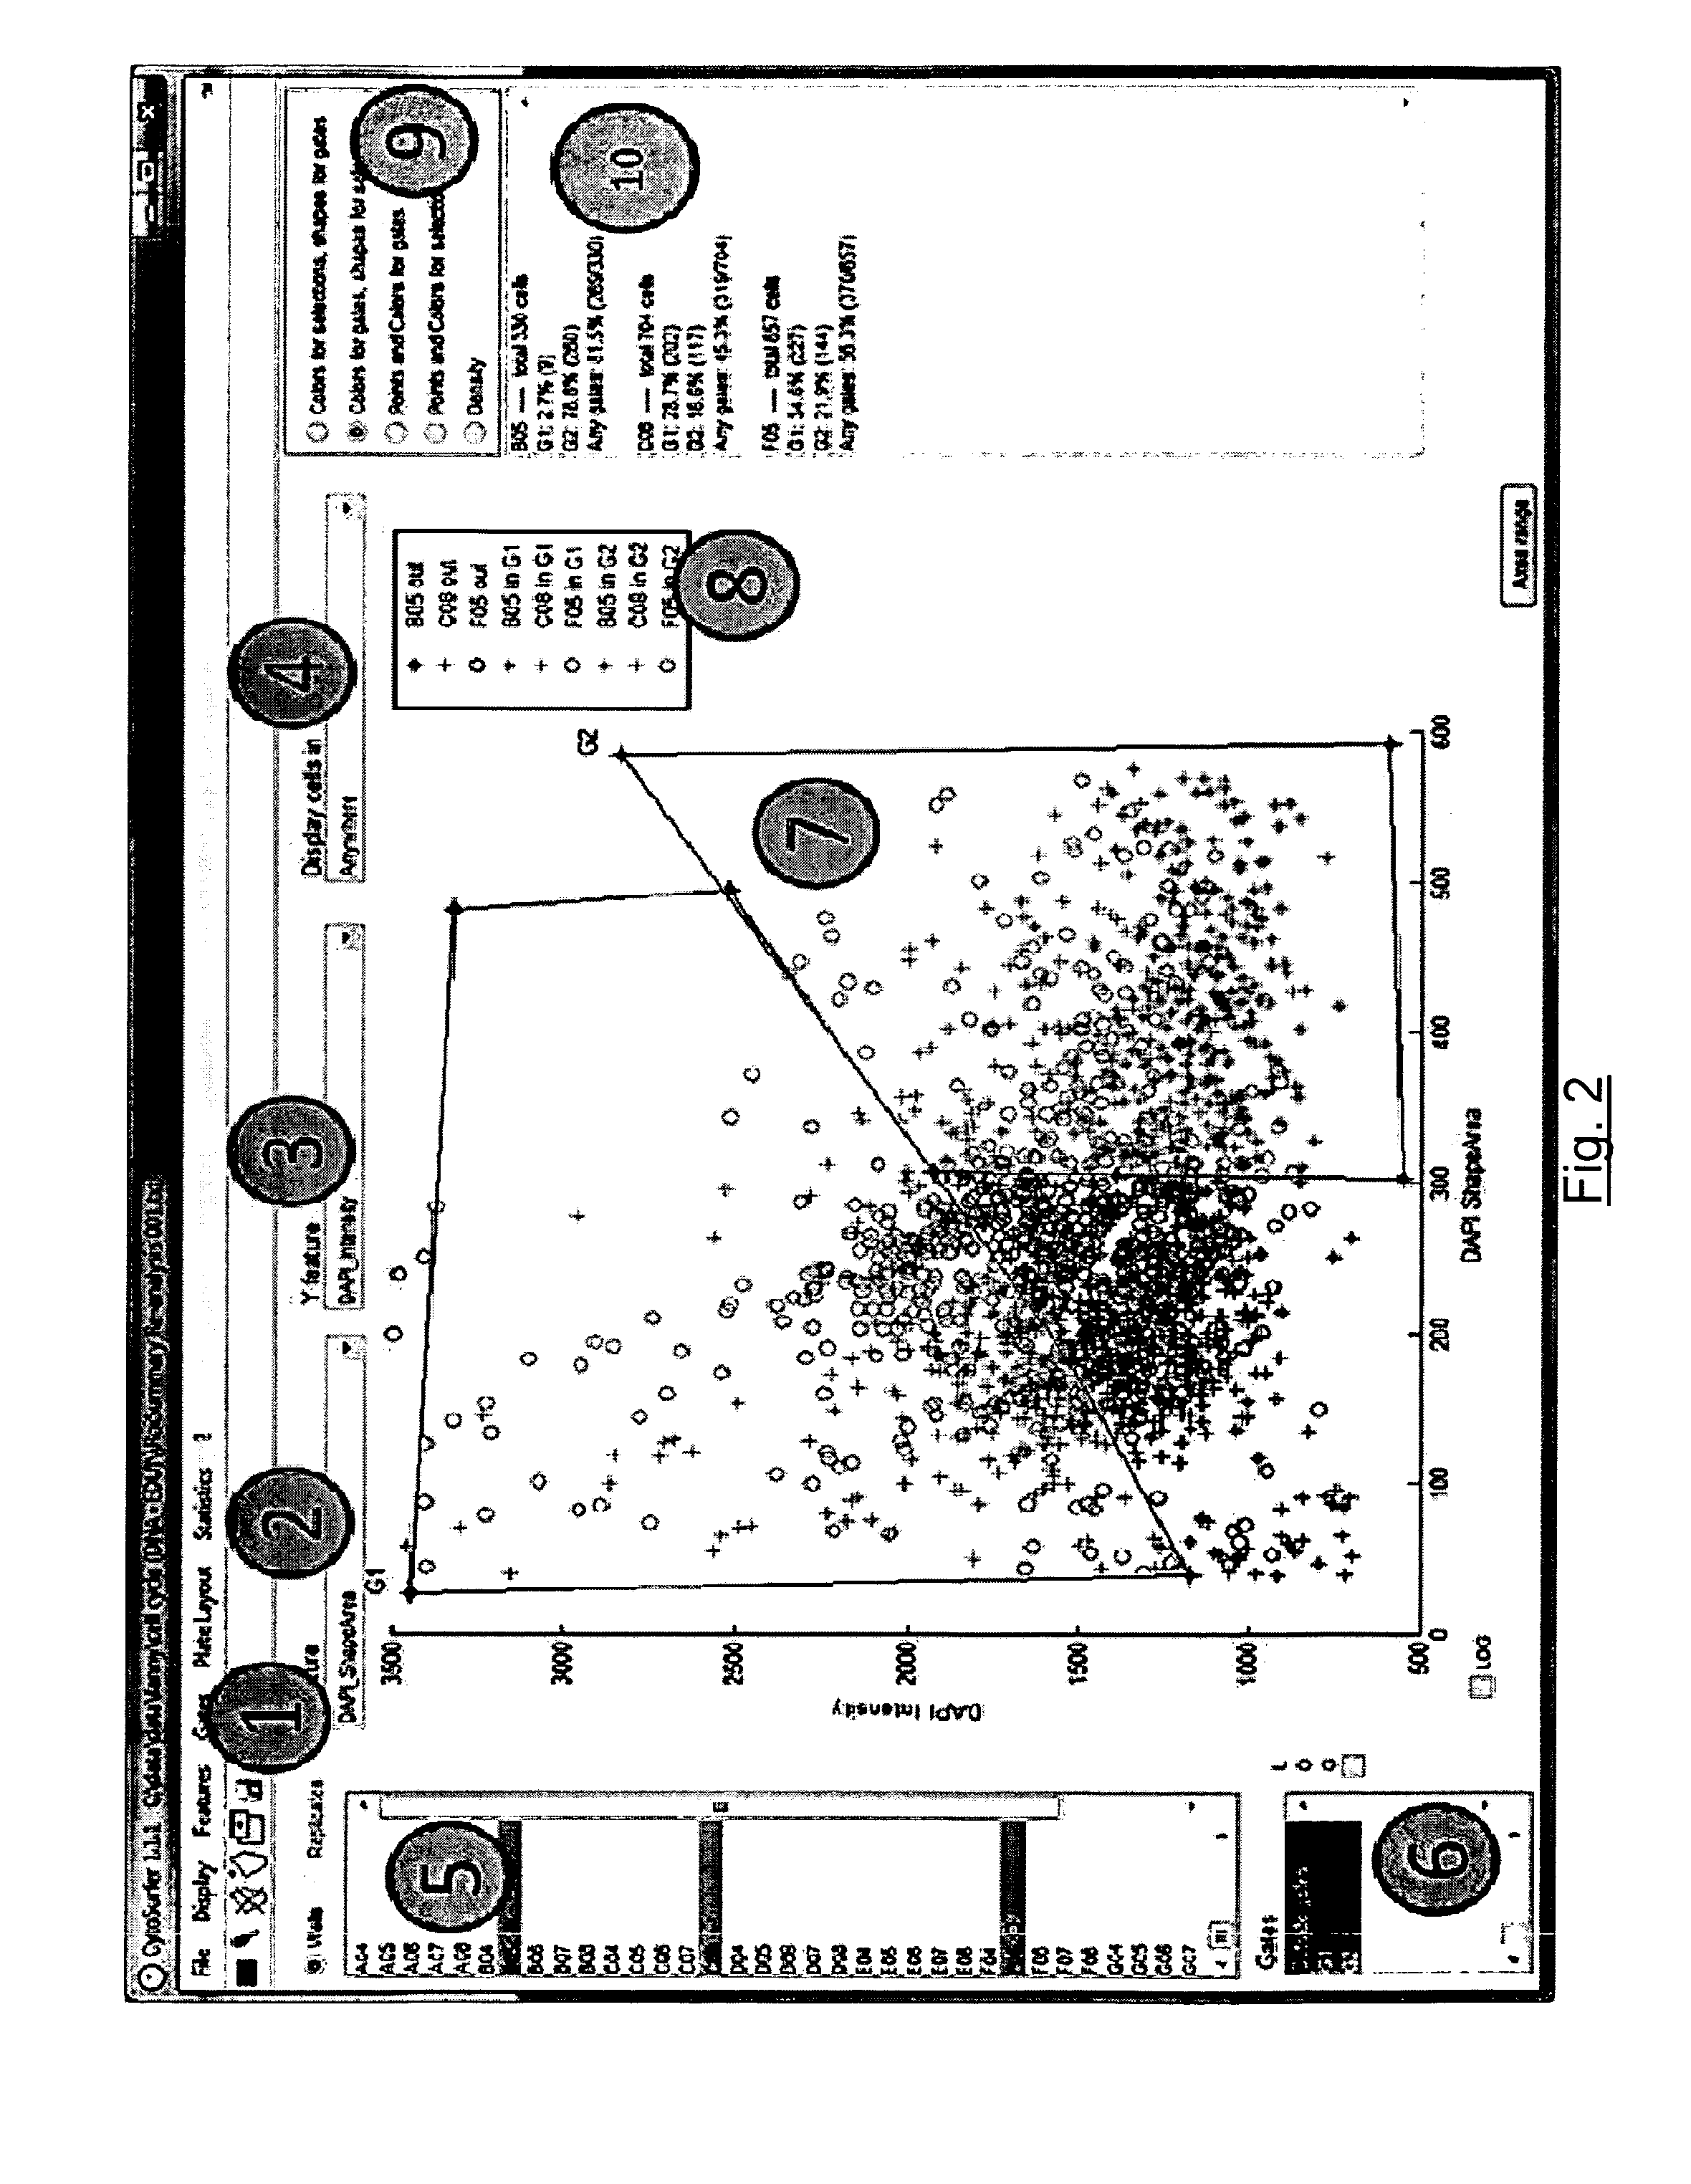
3. Remove unwanted cell (like cell fragments and cell doublets):[0150]a. Select in the biological condition list view (FIG. 6) the control condition.[0151]b. Draw a scattergram: select as the first feature DNA content (total intensity in Hoechst channel, see FIG. 2 selected feature 2) and as the second nucleus perimeter (see FIG. 2, selected feature 3)[0152]c. Draw a gate to select cell doublets: DNA content is high and perimeter is high ...


PUM


Abstract

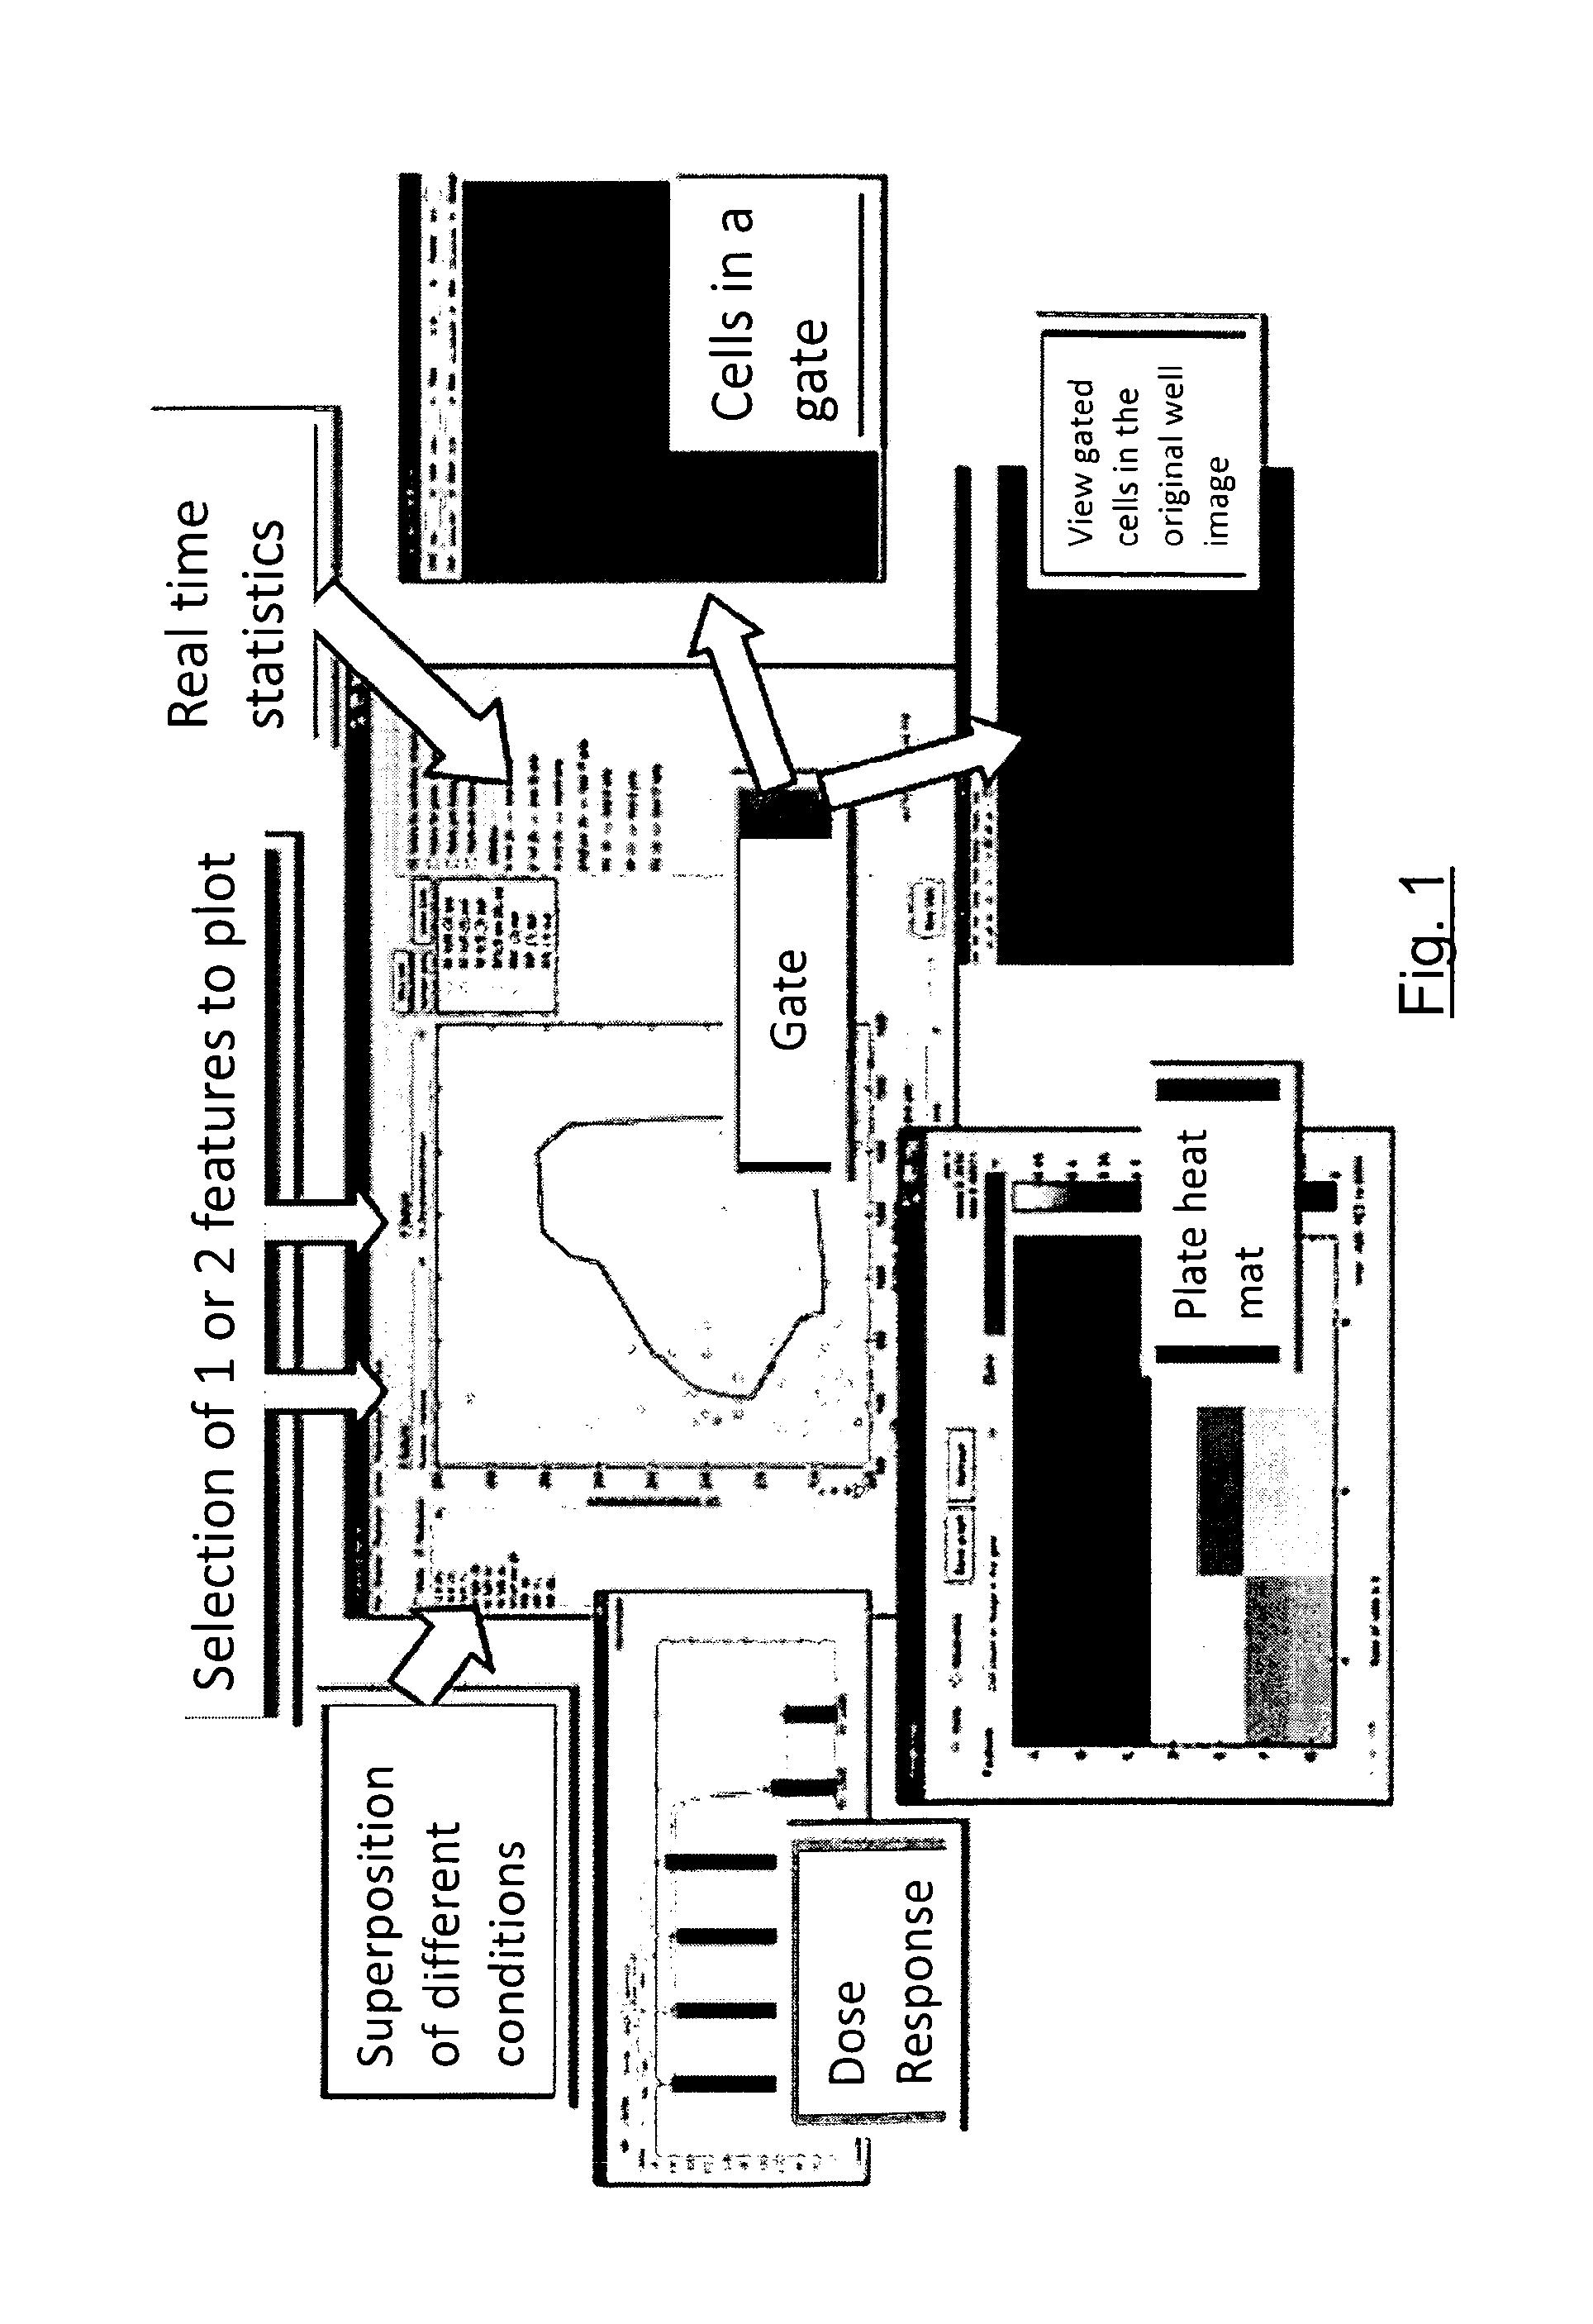
Data processing system for generating representations and analyses of cytometric information for:—loading one set of data including:—one image of two wells on a plate each having one cell in a predetermined biological condition, each image being acquired with a microscope;—features of each cell from each image;—processing loaded data for obtaining representations and analyses of the data, from:—Histogram in one dimension;—Scattergram in two-dimensions;—Density in two-dimensions;—Plate layout management;—Cell montage;—Field;—Plate heatmap;—Dose response with regrouping of replicates;—Statistics information percentage of cell in different gates;—zFactor calculation with regrouping of replicates;—List of well for selection and list of biological condition for selection;—Statistics export capability;—Ready to print layout capability on the selected well or biological condition or all wells and biological conditions.

Description

FIELD OF THE INVENTION[0001]The invention relates to cell biology imaging and / or High-Content Screening and / or high throughput screening (HTS).BACKGROUND OF THE INVENTION[0002]High-Content Screening (HCS) technologies generate a massive amount of data. Today's major challenge in HCS is the analysis of those data and thus the development of effective data mining and exploration tools. Indeed images acquisition, segmentation and features extraction are now well conducted with the latest technologies such as BD Pathway™ and BD Attovision™ system. Finally, today's data analyses for biological response only provide results from a black box global analysis, overall results from each well, and do not extract the full potential from the High-Content single cell response data.[0003]The known solutions are very complicated and demand trained people to perform accurate analysis. Several concepts of computer sciences are required (token) to achieve complete analysis.SUMMARY OF THE INVENTION[000...

Claims


Application Information

Patent Timeline
Patent Type & Authority Applications(United States)
IPC IPC(8): G06T7/20G06K9/62G06F17/30G06K9/46G16B45/00
CPCG06K9/6267G06F17/30247G06K9/46G06K9/4647G06T7/20G16B45/00G06F16/583G06F18/24
Inventor RACINE, VICTORBERARD, FANNYICHAS, FRANCOISDE GIORGI, FRANCESCA
Owner FLUOFARMA
Learn More