Resource control by probability tree convolution production cost valuation by iterative equivalent demand duration curve expansion (aka. tree convolution)

a resource control and probability tree technology, applied in the direction of electric programme control, program control, instruments, etc., can solve the problems of high probability of being unable to meet the demands of all firm-demand customers, wasting financial resources in building and maintaining capacity that is rarely used, and determining the optimum level of ancillary services

Active Publication Date: 2016-03-17
SHEBLE GERALD BERNARD
View PDF16 Cites 59 Cited by
  • Summary
  • Abstract
  • Description
  • Claims
  • Application Information

AI Technical Summary

Benefits of technology

[0048]Each approximation iteration may further include performing, by the smart grid control system, a deterministic optimization technique for the selected at least one new path to simulate or value the selected at least one new path. Revising, by the smart grid control system, the probability tree based at least in part on an analysis of a most recently updated version of the estimated demand duration curve may include determining, by the smart grid control system, a sensitivity factor for each resource included in the probability tree and revising, by the smart grid control system, a portion of the probability tree that corresponds to the resource with the smallest sensitivity factor that is still greater than a threshold value.
[0049]The method may further include generating a plurality of expected demand duration curves respectively for a plurality of different time periods; and performing, by the smart grid control system, the plurality of approximation iterations for each of the plurality of different time periods, the plurality of approximation iterations performed for each respective time period including iterative updates to an estimated demand duration curve for such time period based at least in part on the respective expected demand duration curve generated for such time period. Building, by the smart grid control system, a probability tree may include building, by the smart grid control system, the probability tree including the plurality of leaves, at least some of the plurality of leaves respectively representative of energy transmission and transportation resources or energy generation fuel resources. Controlling, by the smart grid control system, the smart energy grid to activate or deactivate one or more resources of the smart energy grid based at least in part on the most recently revised probability tree may include causing, by the smart grid control system, one or more of the plurality of resources to come online or offline based at least in part on the most recently revised probability tree.
[0050]A smart energy grid control system to control a smart energy grid may be summarized as including at least one processor; and at least one non-transitory processor-readable medium storing at least one of data and instructions that, when executed by the at least one processor, cause the smart energy grid control system to: receive input data that describes one or more operational parameters of each of a plurality of resources of the smart energy grid, the plurality of resources comprising at least a plurality of energy generation resources; build a probability tree based at least in part on the received input data, the probability tree comprising a plurality of leaves, each leaf of the plurality of leaves representative of one of the plurality of resources of the smart energy grid; select at least one initial path through the probability tree; determine an estimated demand duration curve based on the at least one initial path through the probability tree; determine whether the estimated demand duration curve for the at least one initial path satisfies one or more accuracy requirements; responsive to a determination that the estimated demand duration curve does not satisfy the one or more accuracy requirements, perform one or more approximation iterations in which the smart energy grid control system iteratively revises the probability tree based at least in part on an analysis of the estimated demand duration curve, iteratively selects at least one revised path through the revised probability tree, and iteratively updates the estimated demand duration curve; and responsive to a determination that the estimated demand duration curve satisfies the one or more accuracy requirements, control the smart energy grid to respectively activate for at least a first period of time at least one of the particular resources of the smart energy grid that respectively correspond to the leaves of the probability tree included in a most recently selected path

Problems solved by technology

In planning for energy supply adequacy, determining the optimum level of ancillary services, such as energy reserves is difficult.
If an operator maintains too low of a margin of ancillary services, such as reserve margin, there is a high likelihood of being unable to serve the demands of all firm-demand customers.
If an operator maintai

Method used


Image

  • Resource control by probability tree convolution production cost valuation by iterative equivalent demand duration curve expansion (aka. tree convolution)
  • Resource control by probability tree convolution production cost valuation by iterative equivalent demand duration curve expansion (aka. tree convolution)
  • Resource control by probability tree convolution production cost valuation by iterative equivalent demand duration curve expansion (aka. tree convolution)

Examples


Embodiment Construction

[0135]The following description of the invention is provided as an enabling teaching of the invention and its best, currently known embodiment. Those skilled in the art will recognize that many changes can be made to the embodiments described while still obtaining the beneficial results of the present invention. It will also be apparent that some of the desired benefits of the present invention can be obtained by selecting some of the features of the present invention without utilizing other features. Accordingly, those who work in the art will recognize that many modifications and adaptations of the invention are possible and may even be desirable in certain circumstances and are part of the present invention. Thus, the following description is provided as illustrative of the principles of the invention and not in limitation thereof since the scope of the present invention is defined by the claims.

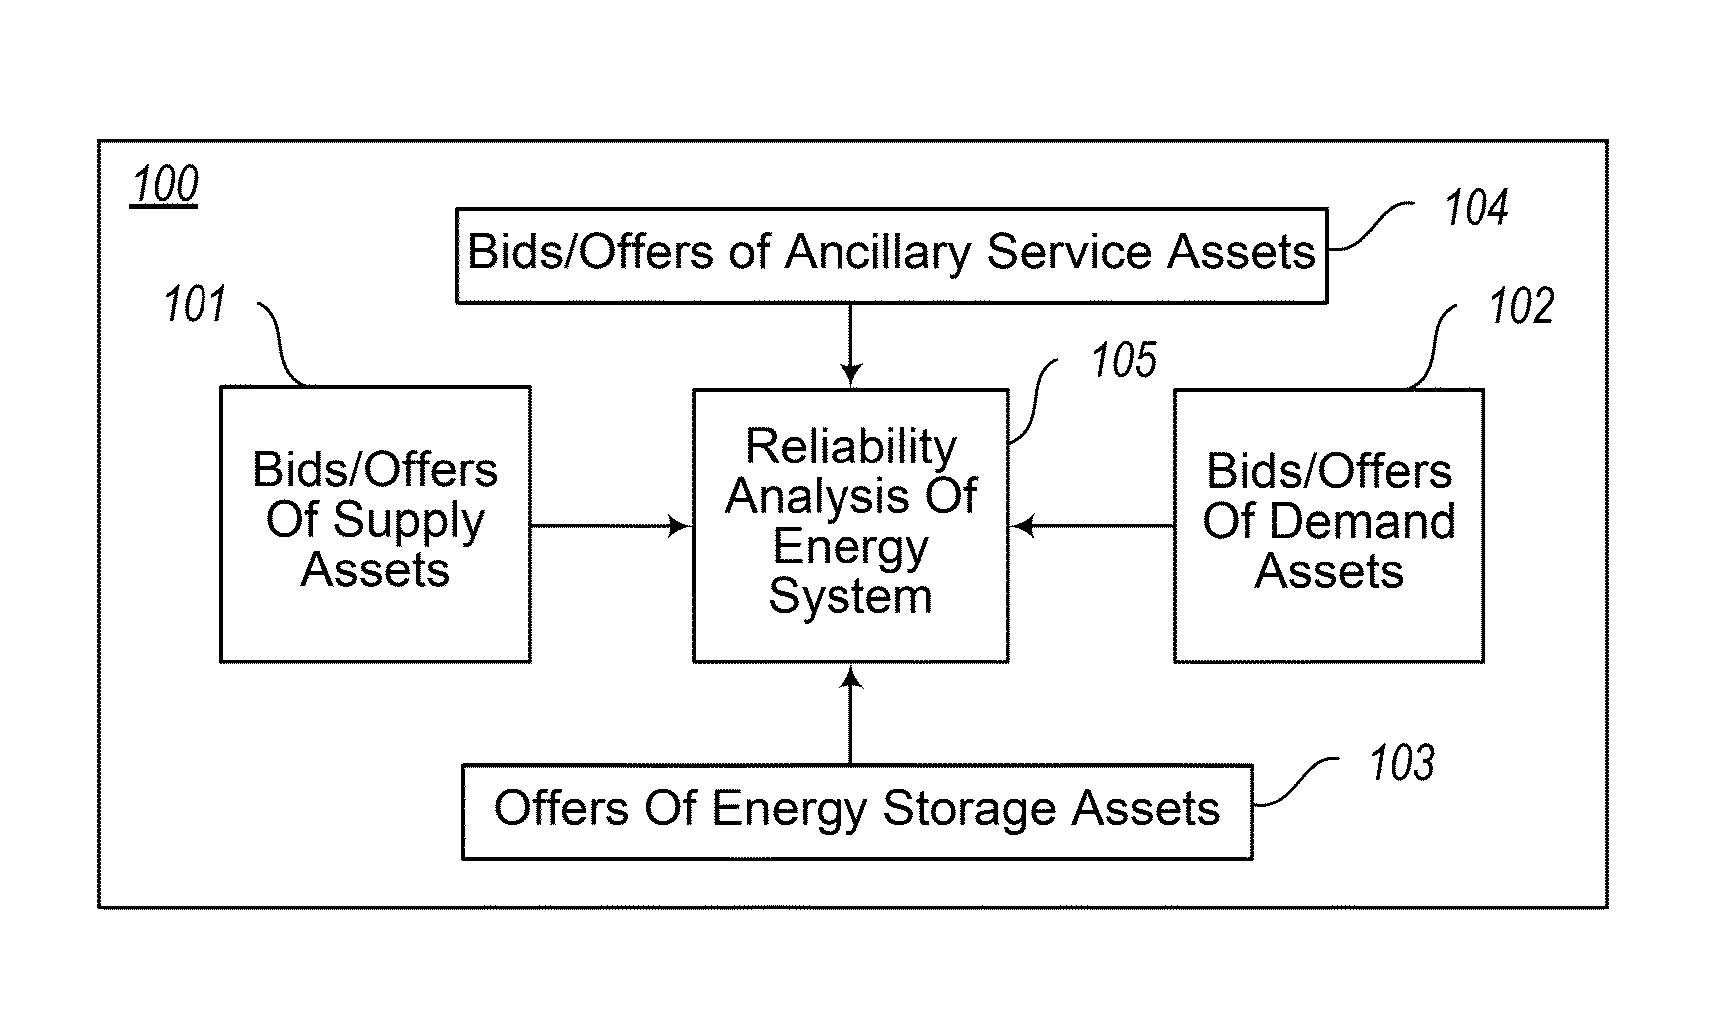
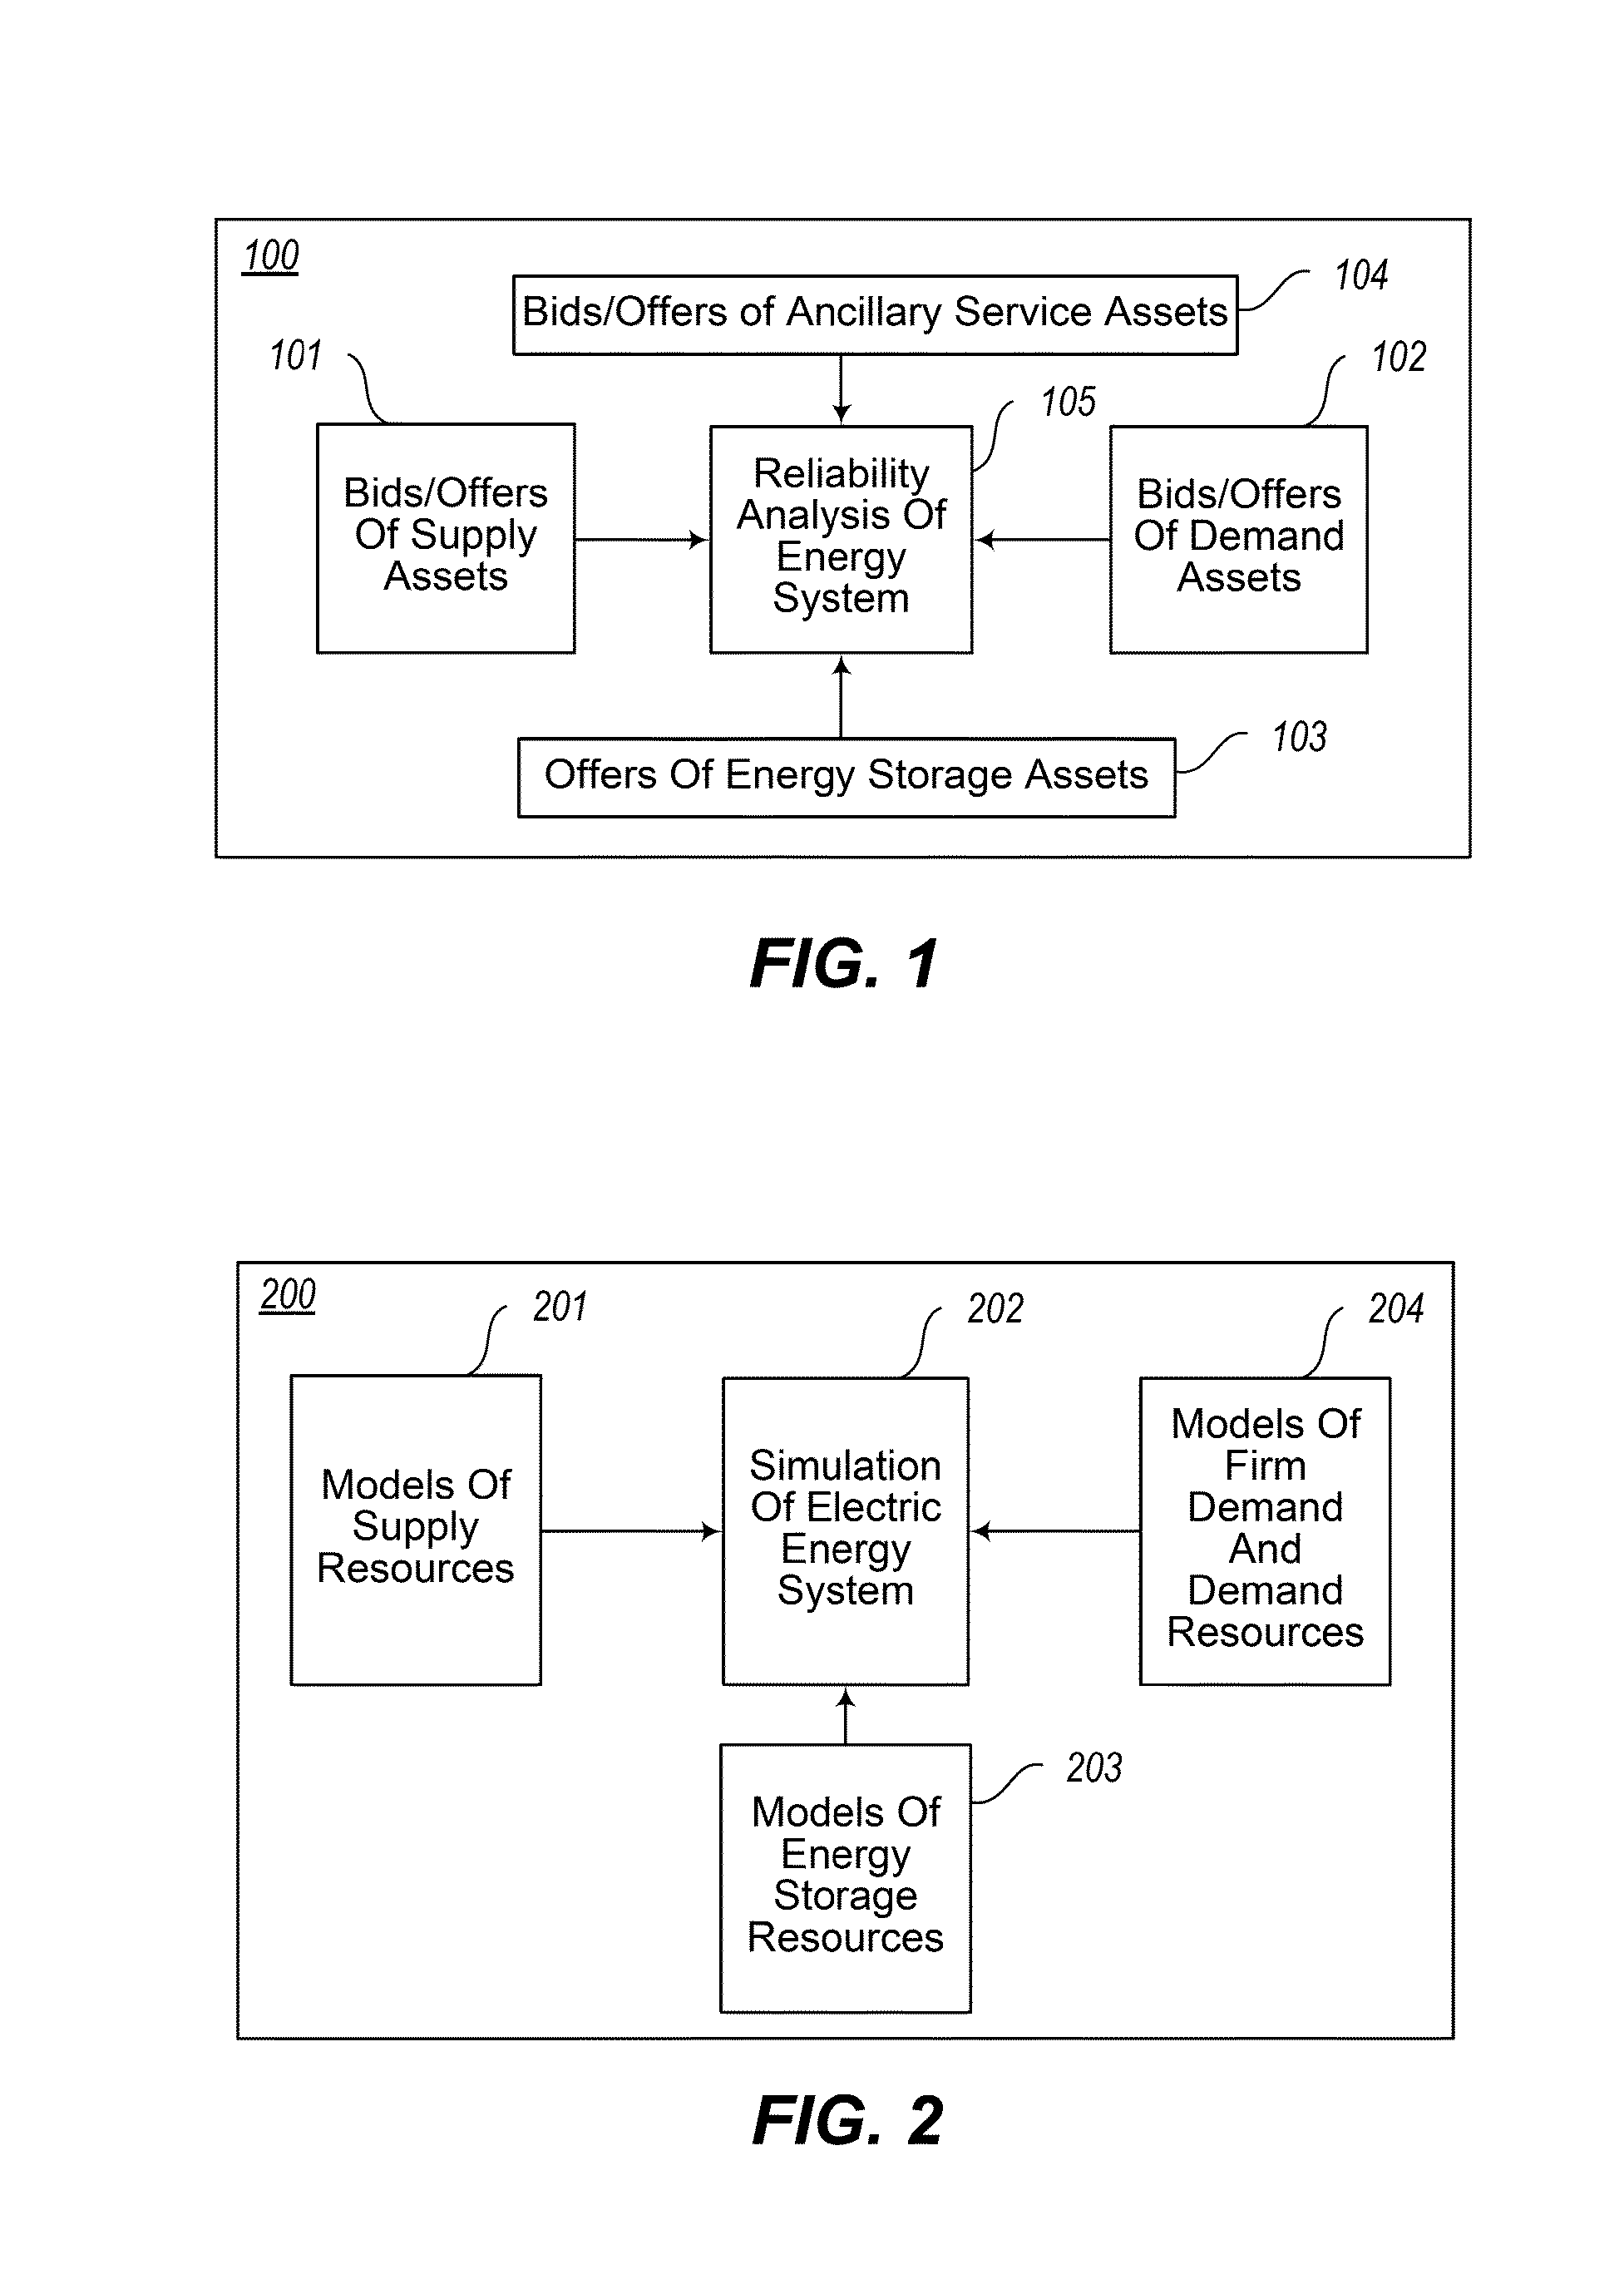
[0136]In an embodiment of the invention, the capabilities of an energy system during ...


PUM


Abstract

A method, system and program product for quantifying risk of unserved energy in an energy system using a digital simulation. An energy demand forecast is generated based at least in part on a weather model for near term future periods. A plurality of energy supply resources are committed to meet the plurality of energy demand assisted by a plurality of storage devices and associated ancillary services. A probable operating status is specified for each committed energy supply resource in the energy system. Renewable energy resources such as wind, solar cells, and biofuels are also included in the models for energy supply sources. A determination is made as to whether or not the committed supply resources and storage devices are sufficient to meet the energy demand as well as determine the cost of production above a prespecified LODP and EUE.

Description

BACKGROUND[0001]1. Technical Field[0002]The present invention relates generally to energy resource planning systems and, more particularly, to methods and systems for determining expected unserved energy in order to quantify reliability risks for electric energy systems. The same reliability analysis applies to other energy networks (e.g., gas and oil) when the physical network description is implemented for those networks.[0003]2. Description of the Related Art[0004]In planning for energy supply adequacy, determining the optimum level of ancillary services, such as energy reserves is difficult. If an operator maintains too low of a margin of ancillary services, such as reserve margin, there is a high likelihood of being unable to serve the demands of all firm-demand customers. If an operator maintains too high of a reserve margin, financial resources are wasted in building and maintaining capacity that is rarely used. A new digital simulation model is needed that can quantify the r...

Claims


Application Information

Patent Timeline
IPC IPC(8): G05B19/042
CPCG05B2219/2639G05B19/042G06Q50/06G06Q10/06H02J3/00Y02B70/3225Y04S20/222H02J2310/64H02J2203/20H02J3/14Y02P90/80Y04S50/10
Inventor SHEBLE, GERALD, BERNARD
Owner SHEBLE GERALD BERNARD
Why Eureka
Try Eureka