Method and system for recognizing physiological sound
- Summary
- Abstract
- Description
- Claims
- Application Information
AI Technical Summary
Benefits of technology
Problems solved by technology
Method used
Image


Examples
example 1
Experimental Corpus and Experimental Steps for Heart Sounds
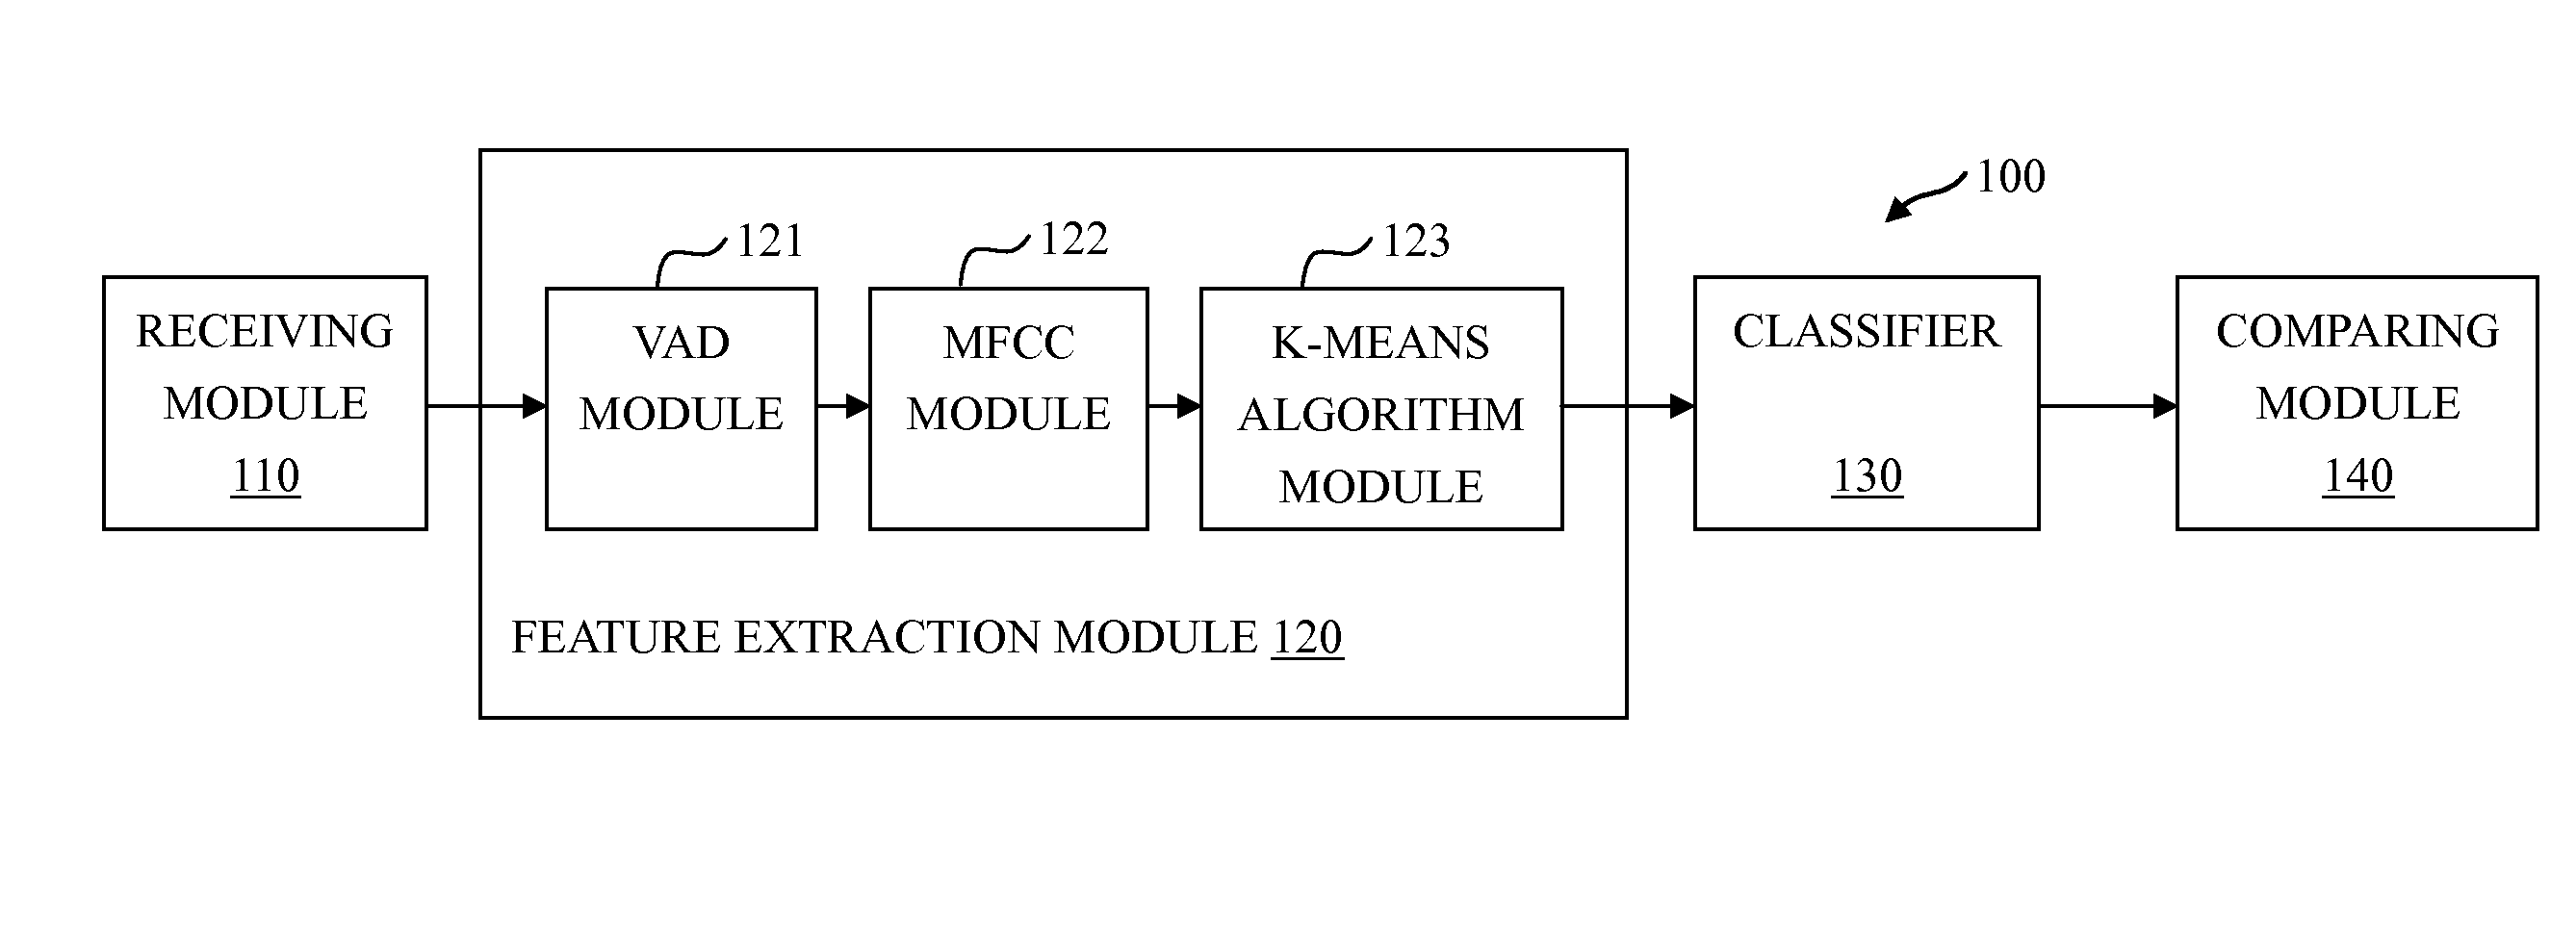
[0088]The flow chart of the method for recognizing physiological sound is shown in FIGS. 1, 2 and 4. Step 201 is receiving a physiological sound by the receiving module 110. The place for receiving audios centralized on pulmonary valve auscultation area and second aortic valve auscultation area. The receiving module 110 is an electronic stethoscope, and the data used in this experiment is the actual voice data collected by the electronic stethoscope. The aim is to utilize heart sounds to find out the S1 and S2 audio clips. First of all, an analog microphone is used to record heart sounds and converted the recorded heart sounds into digital signals. Decoded by an audio codec, the digital audio signals are separated by two paths. One is to convert the filtered sounds into analog signals and deliver the analog signals through stethoscope ear tube. The other path is to store the non-processed digital sounds in the built-in memor...
example 2
The Accuracy Result of Heart Sounds by Different Classifiers
[0094]In MFCC feature extraction of training data, the S1 and S2 spectrum and wave pattern map were observed and shown in FIG. 5. First, the frequency of heart sounds mainly concentrated in low frequency parts, which is highly different from voices concentrating below 8 k Hz. Therefore, sampling was adjusted to 5 k Hz. The baseband of heart sound is about 15 ms, so the frame size was set as 15 ms, with 10 ms overlapped. After adjusting the parameters of the VAD module 121 as the α and β shown in Formula (2), audio files cut manually served as goal to match the testing data processed by the VAD module 121 with training data.
[0095]In classifier part, the KNN module 131, the GMM module 132, the SVM module 133 and the DNN module 134 were used. However, the idea for using the KNN module 131 was relatively simpler, which merely used features to serve as the judgment standard for distances. The GMM module 132 was generation model....
example 3
Identifying Regular Heart Sounds and Irregular Heart Sound
[0097]To evaluate the difference between regular and irregular heart sounds, as shown in FIG. 7, three pairs of regular heart sounds S1 and three pairs of regular heart sounds S2 were recorded. Using five thousand (5K) sampling rate as the record factor, and 5K sampling rate was 0.2 milliseconds per sample. Each sample of S1 were respectively 1466, 6266, 10941, 15889, and 20564, and each sample of S2 were respectively 2995, 7796, 12608, 17421, and 22242. First heart rate of S1 was 60 / [(|6266−1466|)×0.2×0.001]=62.5 beats per minute (BPM), and second heart rate of S1 was 64.2 BPM. The modulus difference between first and second heart rates was 1.7 (64.2 BPM−62.5 BPM) which was smaller than 5% of the first heart rate 3.125 (62.5 BPM×5%).
[0098]On the contrary, as shown in FIG. 8, three pairs of irregular heart sounds S1 and three pairs of irregular heart sounds S2 were recorded. Each sample of S1 were respectively 1162, 8269, 117...
PUM
 Abstract
Description
Claims
Application Information