

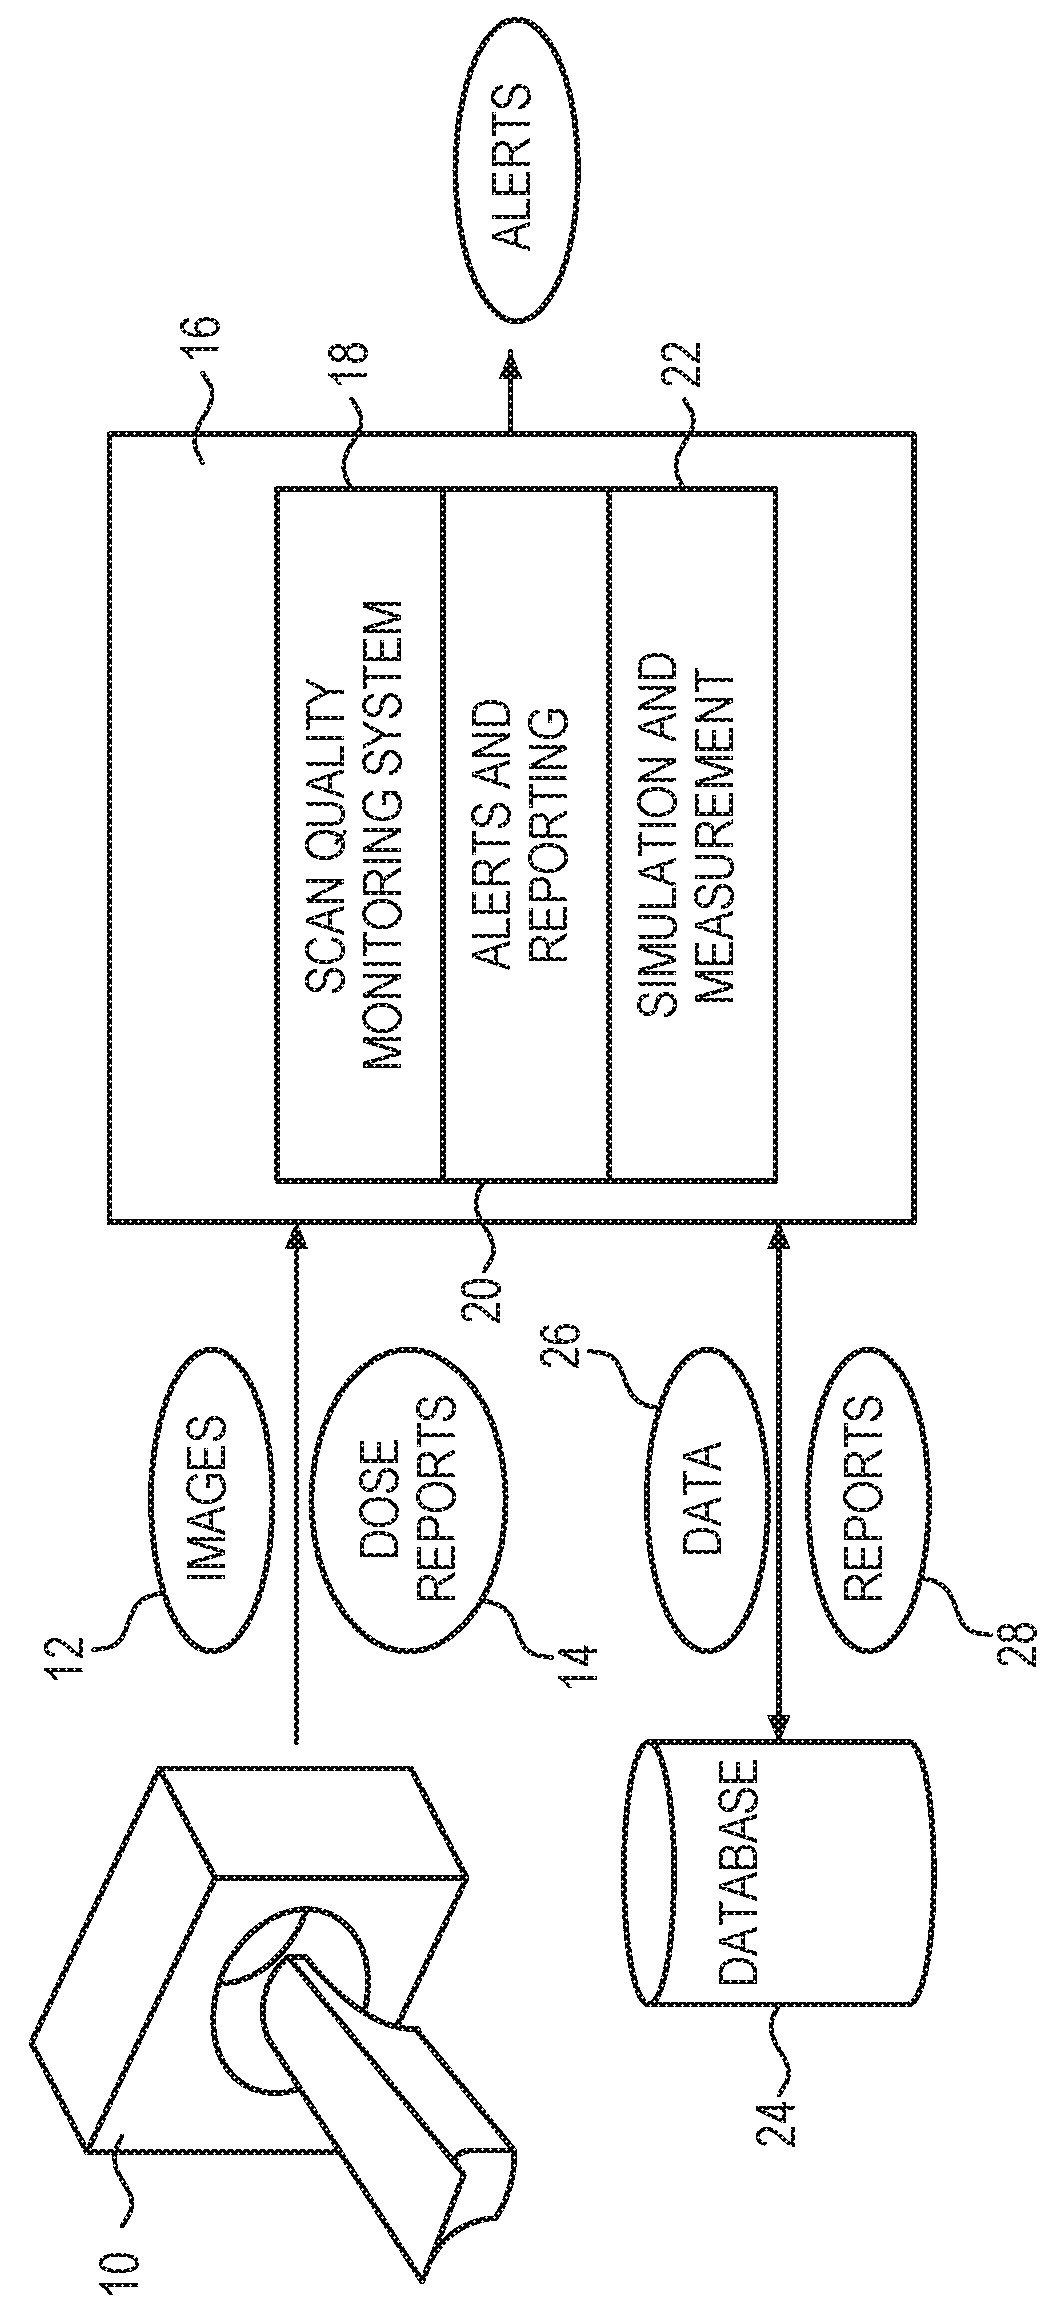
Automated scan quality monitoring system
a scanning quality and monitoring system technology, applied in the field of automatic assessment of the quality of scanner acquired images, can solve the problems of high variability in image quality assessment, reviewer subjective assessment lacks the analytical precision needed to ensure, and the type of image quality assessment can catch many subtle issues, etc., to achieve the effect of increasing radiation dos
- Summary
- Abstract
- Description
- Claims
- Application Information
AI Technical Summary
Benefits of technology
Problems solved by technology
Method used
Image

Examples
examples
[0056]An assessment of scanner image quality was performed Using a 3D CT DICOM Series Found to Contain 3 Rolls of 3M ¾ Inch×1000 Inch Scotch Magic Tape® 810. The scanner and protocol settings were as in Table I below.
TABLE I
[0057]Scanner and Protocol
[0058]Manufacturer: GE MEDICAL SYSTEMS Tube kVp: 120.00
[0059]Scanner Model: LightSpeed VCT Tube mAs: 25.00
[0060]Scanner Station: GEVCT2 Slice Thickness: 1.25
[0061]Study Date: 20160331 Slice Spacing: 1.250
[0062]Recon Kernel: LUNG Pitch: 0.98
[0063]Iterative Settings Radiation Dose:
[0064]Sampling Rate: 0.941×0.941×1.250 mm
[0065]Volume Size: 512×512×67 mm
[0066]Study Description:
[0067]Series Description: 1.25 lung
[0068]Series Instance UID: 1.2.3.4
[0069]Directory Name: s1
Image Quality Analysis Status
[0070]Slice thickness and spacing were found to be within acceptable limits for this analysis (2.5 mm).
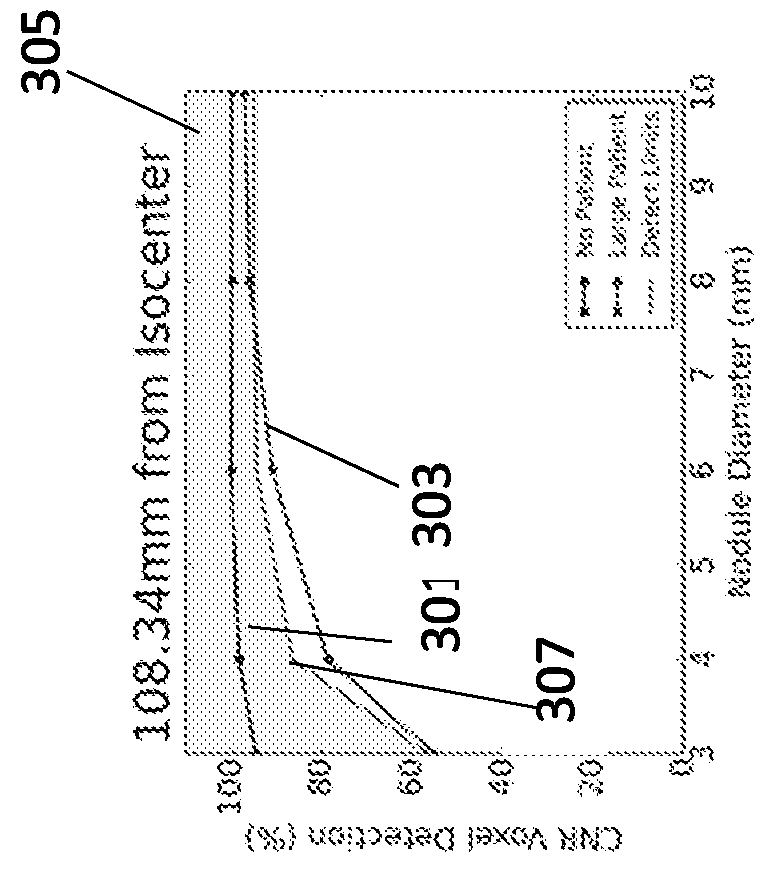
[0071]Referring now to FIG. 3A-FIG. 3C, estimated solid lung nodule detection performance of the scanner / protocol combination at different distan...
PUM
 Abstract
Description
Claims
Application Information