
Method For Calibrating A Data Set Of A Target Analyte

Pending Publication Date: 2018-11-22
SEEGENE INC
View PDF0 Cites 1 Cited by
  • Summary
  • Abstract
  • Description
  • Claims
  • Application Information

AI Technical Summary

Benefits of technology

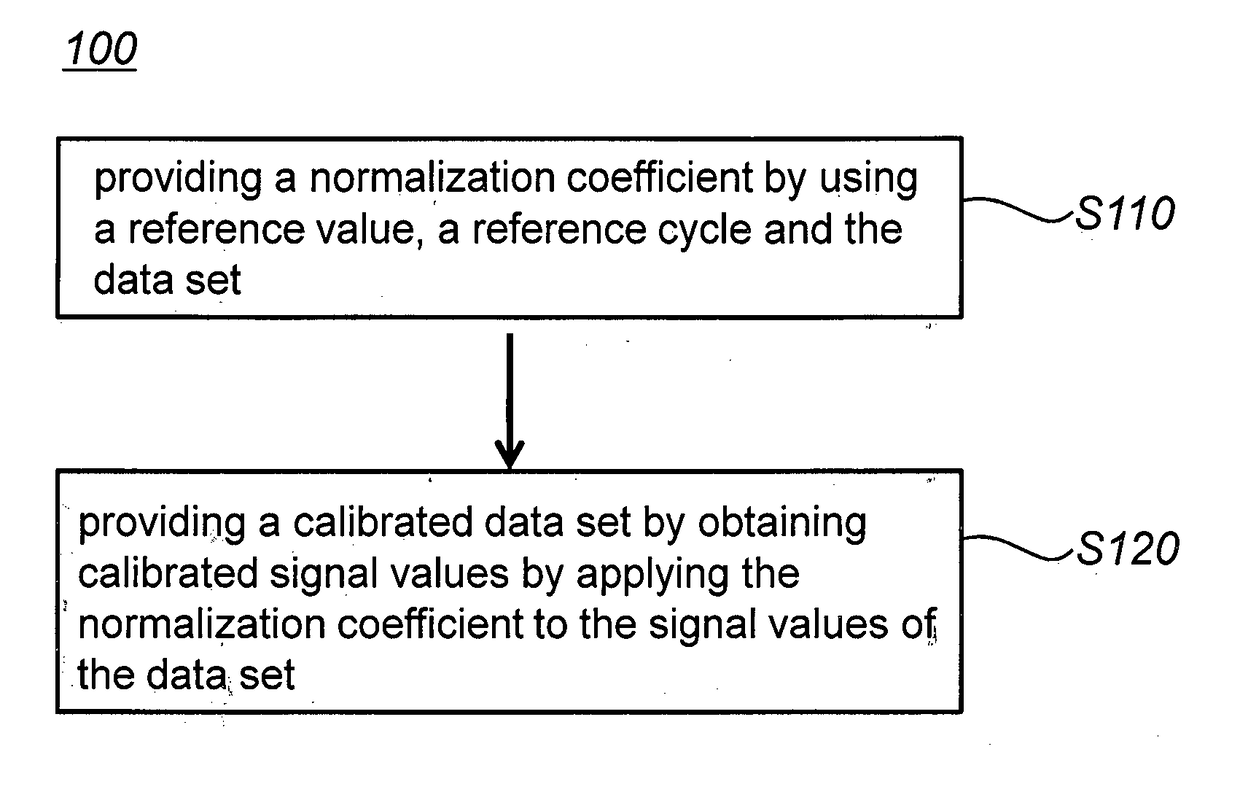
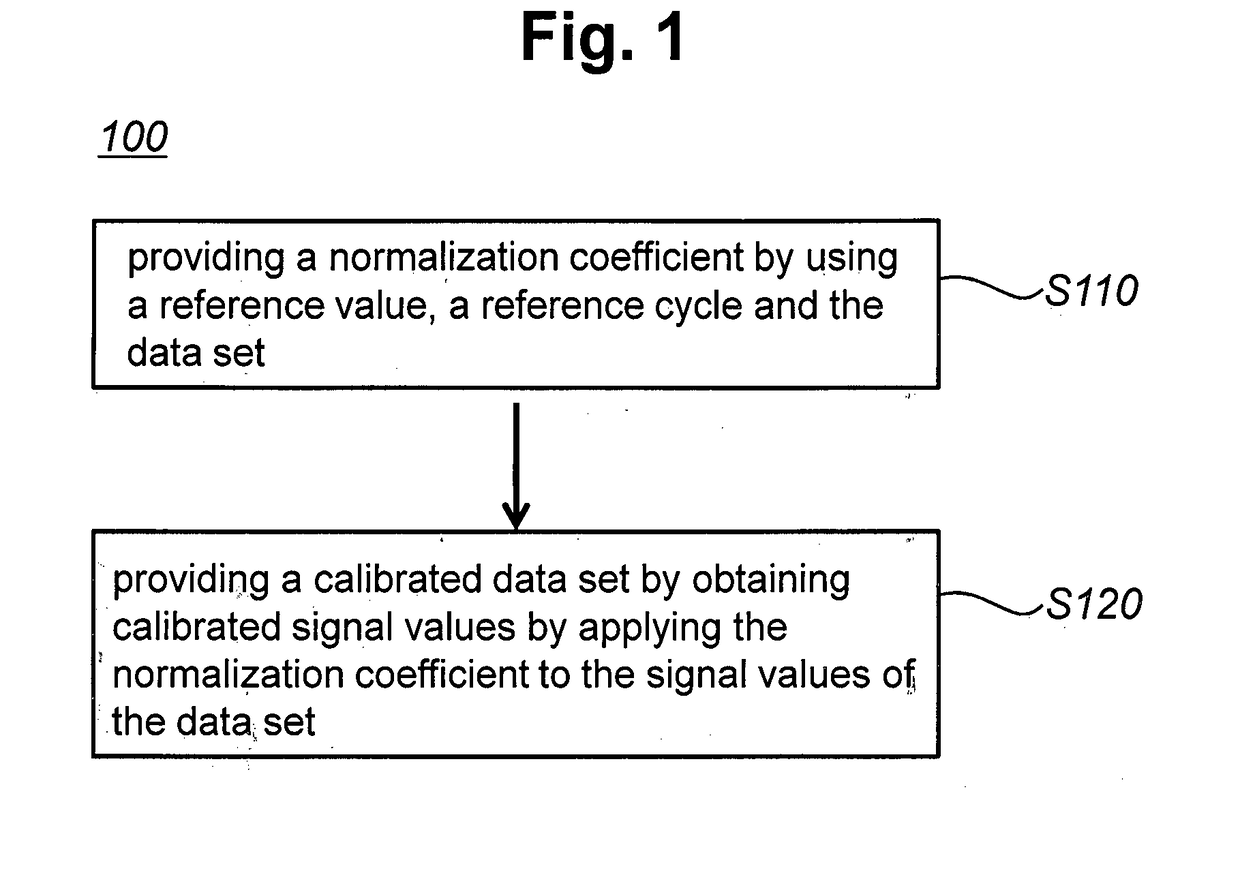
The patent text discusses how to obtain a calibrated data set with high accuracy and reliability using a normalization coefficient determined based on an arbitrarily determined reference value, a reference cycle, and the data set. The calibrated data set can also be obtained by removing the instrument blank signal value from the data set before providing the normalization coefficient. Additionally, the reference value can be determined based on inter-instrument variation to improve the accuracy and reliability of the calibrated data set.

Problems solved by technology

However, such an electrical noise signal also creates a signal variation and is referred to as an instrument blank signal.
However, these prior art may have some limitations or shortcomings.
The hardware adjustment method shows limited accuracy in calibration and an additional calibration is needed to remove a variation occurred by deterioration of the analytical instrument.
Furthermore, the hardware adjustment method can reduce only the inter-instrument variation but cannot reduce the intra-instrument variation.
The signal calibration using the reference dye increases the cost per reaction and the quantitative and qualitative variations in the reference dyes used in each reaction may cause another error.
Furthermore, the use of the reference dye may increase the possibility of interference phenomenon between the reference dye and other dyes used for determining the presence of target analyte in the reaction mixture.
The interference phenomenon is a very important problem, particularly in the multiplex PCR where multiple dyes are used and their fluorescence have to be detected.
Besides, assigning one dye and one detection channel for the signal calibration causes a considerable disadvantage in view of the product competitiveness because it results in one less targets simultaneously detectable.

Method used


Image

  • Method For Calibrating A Data Set Of A Target Analyte
  • Method For Calibrating A Data Set Of A Target Analyte
  • Method For Calibrating A Data Set Of A Target Analyte

Examples


example 1

on of Data Set by Using Specific Background Signal-Based Normalization (SBN) and Analysis of Calibrated Data Set

[0217]The method of controlling the input or output signal intensity in hardware-wise is widely used for minimizing the intra-instrument signal variations in a real-time PCR. For example, the output intensity of the light source (e.g., LED and Halogen lamp) is adjusted or the input intensity of the signal is controlled in the filter of a detector for calibration of signals.

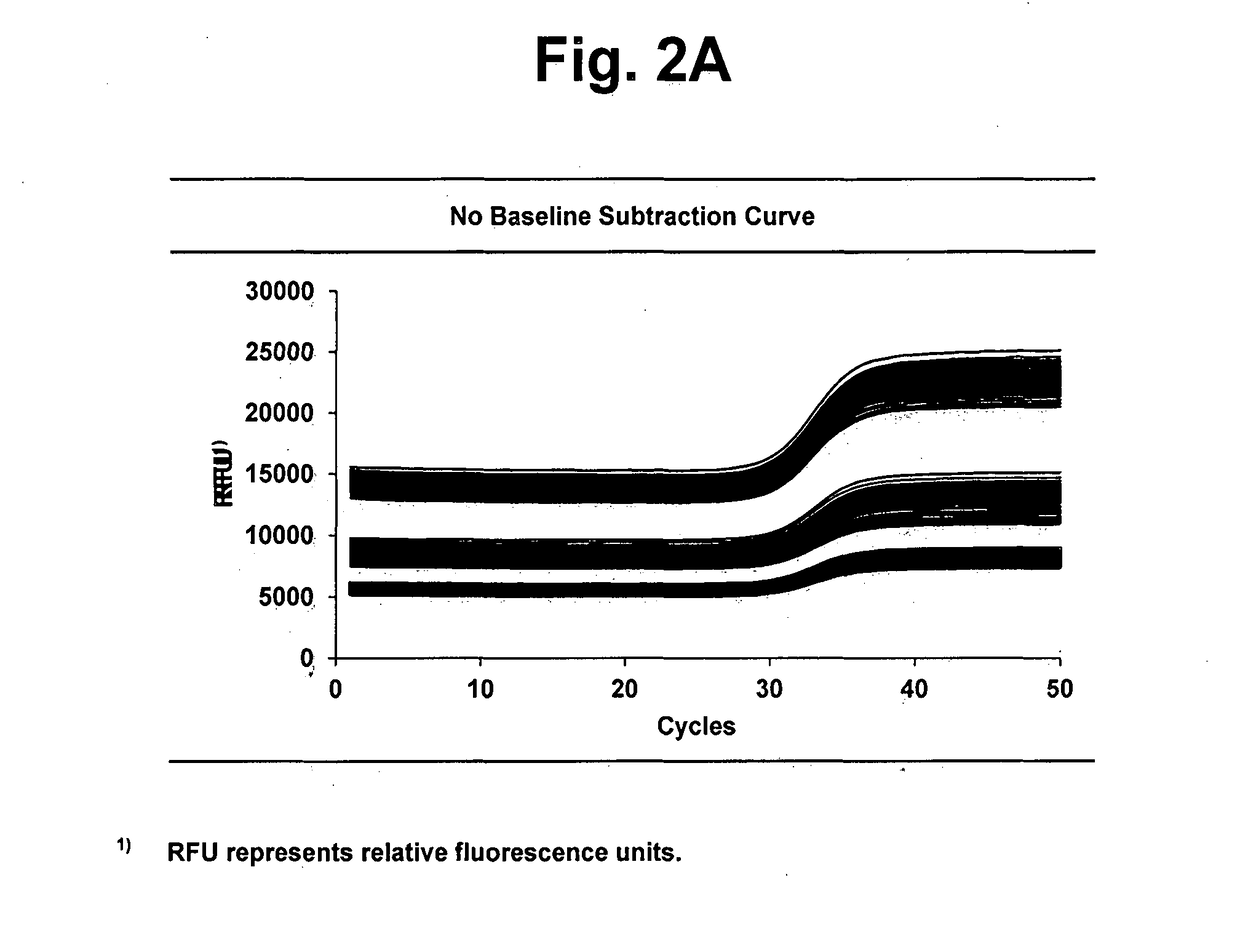
[0218]In Examples, the Specific Background signal-based Normalization (SBN) method of the present invention was used for calibrating variations in the amplified signals of data sets.

[0219]The signal variations in the following three groups of data sets were compared and analyzed: (i) a group of data sets obtained from an instrument without a hardware adjustment; (ii) a group of data sets obtained from an instrument with a hardware adjustment; and (iii) a group of data sets software-wise calibrated by the...

example 2

on and Analysis of the Data Set by Using Instrument Blank Signal Subtraction and Specific Background Signal Based Normalization (IBS-SBN)

[0304]The calibration of the data sets using the SBN will be more accurate if a signal value corresponding to an Instrument blank signal is subtracted from the data sets. In this Example, the method of Instrument Blank signal Subtraction and Specific Background signal-based Normalization (IBS-SBN) was used for the calibration of the amplified signal variations.

[0305]The amplification signal variations in the following three groups of data sets were compared and analyzed: (i) a group of data sets obtained from an instrument without a hardware adjustment of Example ; (ii) a group of data sets obtained from an instrument with a hardware adjustment of Example ; and (iii) a group of data sets obtained by calibrating the data sets of Example software-wise by the IBS-SBN.

[0306] Measurement of Instrument Blank Signal

[0307]Raw data sets generally include b...

example 3

on and Analysis of the Melting Data Set by Using Instrument Blank Signal Subtraction and Specific Background Signal Based Normalization (IBS-SBN)

[0371]In the above Examples 1 and 2, the nucleic add amplification data sets were calibrated using the SBN or IBS-SBN. In Example 3, it is investigated whether the melting data sets can be calibrated software-wise by the present method.

[0372]The melting signal variations in the following three groups of data sets were compared and analyzed: (i) a group of melting data sets obtained from an instrument without a hardware adjustment; (ii) a group of melting data sets obtained from an instrument with a hardware adjustment; and (ii) a group of calibrated melting data sets obtained by calibrating the melting data sets software-wise using the IBS-SBN.

[0373] Preparation of Melting Data Sets

[0374]A melting analysis for a target nucleic add molecule was performed using a PTOCE assay as a signal-generating means with 50 cycles of an amplification in t...


PUM

PropertyMeasurementUnit
Fractionaaaaaaaaaa
Fractionaaaaaaaaaa
Fractionaaaaaaaaaa

Abstract

The present invention relates to a method for calibrating a data set of a target analyte in a sample, wherein a normalization coefficient for calibrating the data set is provided by using a reference value, a reference cycle and the data set, and the calibrated data set is obtained by applying the normalization coefficient to the signal values of the data set. The present method is very effective in removing the inter- and intra-instrument signal variations of data sets. Furthermore, since the present method can be configured in software, the instant method is capable of being applied universally to various analytical instruments (e.g., a real-time PCR instrument) regardless of manufacturer. Accordingly, the method by the present invention would be very useful in diagnostic data analysis.

Description

FIELD OF THE INVENTION[0001]The present invention relates to a method for calibrating a data set of a target analyte in a sample.BACKGROUND OF THE INVENTION[0002]A polymerase chain reaction (hereinafter referred to as “PCR”) which is most widely used for the nucleic acid amplification includes repeated cycles of denaturation of double-stranded DNA, followed by oligonucleotide primer annealing to the DNA template, and primer extention by a DNA polymerase (Mullis et al., U.S. Pat. Nos. 4,683,195, 4,683,202 and 4,800,159; Saiki et al., (1985) Science 230, 1350-1354) A real-time polymerase chain reaction is one of PCR-based technologies for detecting a target nucleic add molecule in a sample in a real-time manner. For detecting a specific target analyte, the real-time PCR uses a signal-generating means for generating a fluorescence signal being detectable in a proportional manner with the amount of the target molecule. The generation of fluorescence signals may be accomplished by using ...

Claims


Application Information

Patent Timeline
IPC IPC(8): G06F19/28G16B40/10G16B50/00G16B45/00
CPCG06F19/28C12Q1/686G16B40/00G16B50/00G16B40/10C12Q2537/165C12Q2545/101G16B15/00C12Q2561/113G16B99/00G16B45/00
Inventor CHUN, JONG YOONLEE, YOUNG JOLEE, HAN BIT
Owner SEEGENE INC
Learn More