Profiling of Pathology Images for Clinical Applications

a pathology image and clinical application technology, applied in image analysis, image enhancement, instruments, etc., can solve the problems of mislead computerized diagnosis algorithms, difficulty in realizing similar successes, and high computational cost of processing this large amount of information

Active Publication Date: 2018-12-27
THE BOARD OF TRUSTEES OF THE LELAND STANFORD JUNIOR UNIV
View PDF0 Cites 29 Cited by
  • Summary
  • Abstract
  • Description
  • Claims
  • Application Information

AI Technical Summary

Benefits of technology

[0008]One group has specifically applied this tactic to the problem of distinguishing lower grade gliomas (LGG) from glioblastoma multiforme (GBM; Mousavi et al., 2015). In their method, a pathologist selects multiple regions of interest from each histopathological slide. Classification identifies regions of interest containing two hallmarks of GBM: microvascular proliferation and pseudopalisading necrosis. It may be difficult to generalize the method to other problems as the method requires a specific tissue type to identify that defines each class. Additionally, for a problem like distinguishing GBM from LGG, the process of identifying a region for analysis (ie. pseudopalisading necrosis) is the same process pathologists use to diagnose the disease, making the computational analysis less helpful in terms of the efficiency of the pathologist workflow.
[0013]An alternative approach to reduce computational load while still examining the entire WSI is to reduce the image resolution. For their stromal classification in neuroblastoma, Sertel et al., 2009 used a multi-resolution approach to classify their slides, starting with low resolution and continuing to a higher one in the case of a weak classifier decision.
[0020]It is believed that computer aided diagnosis applied to digital pathology images can help make the histopathological designation of glioma subtypes clearer by providing reproducible and exhaustive image analysis (Hamilton et al., 2014). In addition, adoption of such computerized methods may improve the pathologists' workflow, and reduce inter-reader variability.

Problems solved by technology

While computer aided diagnosis has become common in radiology (Doi, 2007), there have been challenges in realizing similar successes in pathology.
Even if digital images were more widely available, there are two key challenges to computerized analysis of whole-slide pathology images (WSI).
First, pathology images are large with each image consisting of around 1010 pixels, and processing this large amount of information can be computationally expensive.
Second, large portions of pathology images contain non-tumor tissue, which is not necessarily relevant to the diagnosis.
Signals arising from substantial tissue regions not directly relevant to the diagnosis may mislead computerized diagnosis algorithms.
Thus, there are two key challenges thwarting computerized analysis of digital pathology images: first, whole slide pathology images are massive, making computerized analysis inefficient, and second, diverse tissue regions in whole slide images that are not directly relevant to the disease may mislead computerized diagnosis algorithms.
It may be difficult to generalize the method to other problems as the method requires a specific tissue type to identify that defines each class.
Additionally, for a problem like distinguishing GBM from LGG, the process of identifying a region for analysis (ie. pseudopalisading necrosis) is the same process pathologists use to diagnose the disease, making the computational analysis less helpful in terms of the efficiency of the pathologist workflow.
In other applications where the task is not so rigidly defined, determining a target for segmentation may be a limiting factor in the method's applicability.
All of these approaches to subsetting WSI share a common limitation; a human must decide what data is valuable for analysis.
This limits the analysis' ability to discover signal in previously unappreciated regions of the slide.
However this increase in data means an increase in computation complexity.
However, these approaches are unsuitable for diseases where a local feature determines the diagnosis for the slide or where the disease they are classifying is heterogeneous, such as in the LGG vs GBM classification.
Additionally, many of them do not perform well with images containing a large amount of extraneous tissue, as this tissue can bias their classification.
However, these features are not always clear, and they can be difficult to find and recognize in whole slide images, likely accounting for the high inter-reader variability observed between pathologists (Coons et al., 1997).
While astrocytic features are easily identified in some tumors, they are difficult to distinguish in others due to extreme anaplasia.
The remarkable regional heterogeneity of the tumors makes them challenging to diagnose if these distinguishing features are not present in regions of the pathology image analyzed.

Method used


Image

  • Profiling of Pathology Images for Clinical Applications
  • Profiling of Pathology Images for Clinical Applications
  • Profiling of Pathology Images for Clinical Applications

Examples


example 1

nd Preprocessing

Dataset Description

[0078]Whole slide, diagnostic images were obtained from The Cancer Genome Atlas (TCGA). All slides were stained with hematoxylin and eosin. TCGA data derives from multiple institutions and collected over many years, so results found in these data are expected to hold for other studies. Each slide had been scanned at multiple resolutions ranging from 2.5-40×, with all images containing a maximum resolution scan of at least 20×. For slides where the maximum resolution was 40×, bicubic interpolation (Hou and Andrews, 1978) resized the images to 20×. The ground truth is that designated by The Cancer Genome Atlas based on patient records.

[0079]Two datasets each evaluated different aspects of the method. The first dataset comprised 45 images from 2014 MICCAI digital pathology classification grand challenge. This dataset allowed for direct comparison of the method to existing methods that were evaluated in that challenge. These 45 images included two type...

example 2

d Local Image Characterization

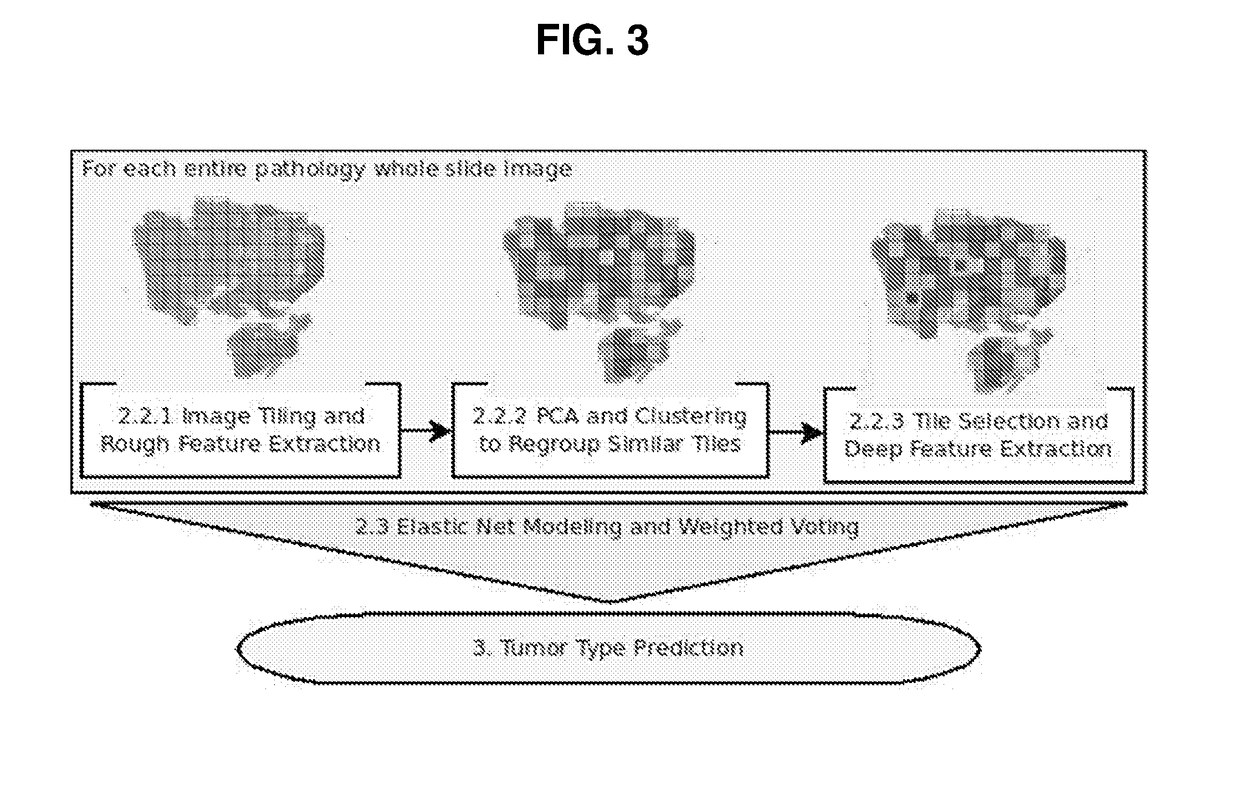
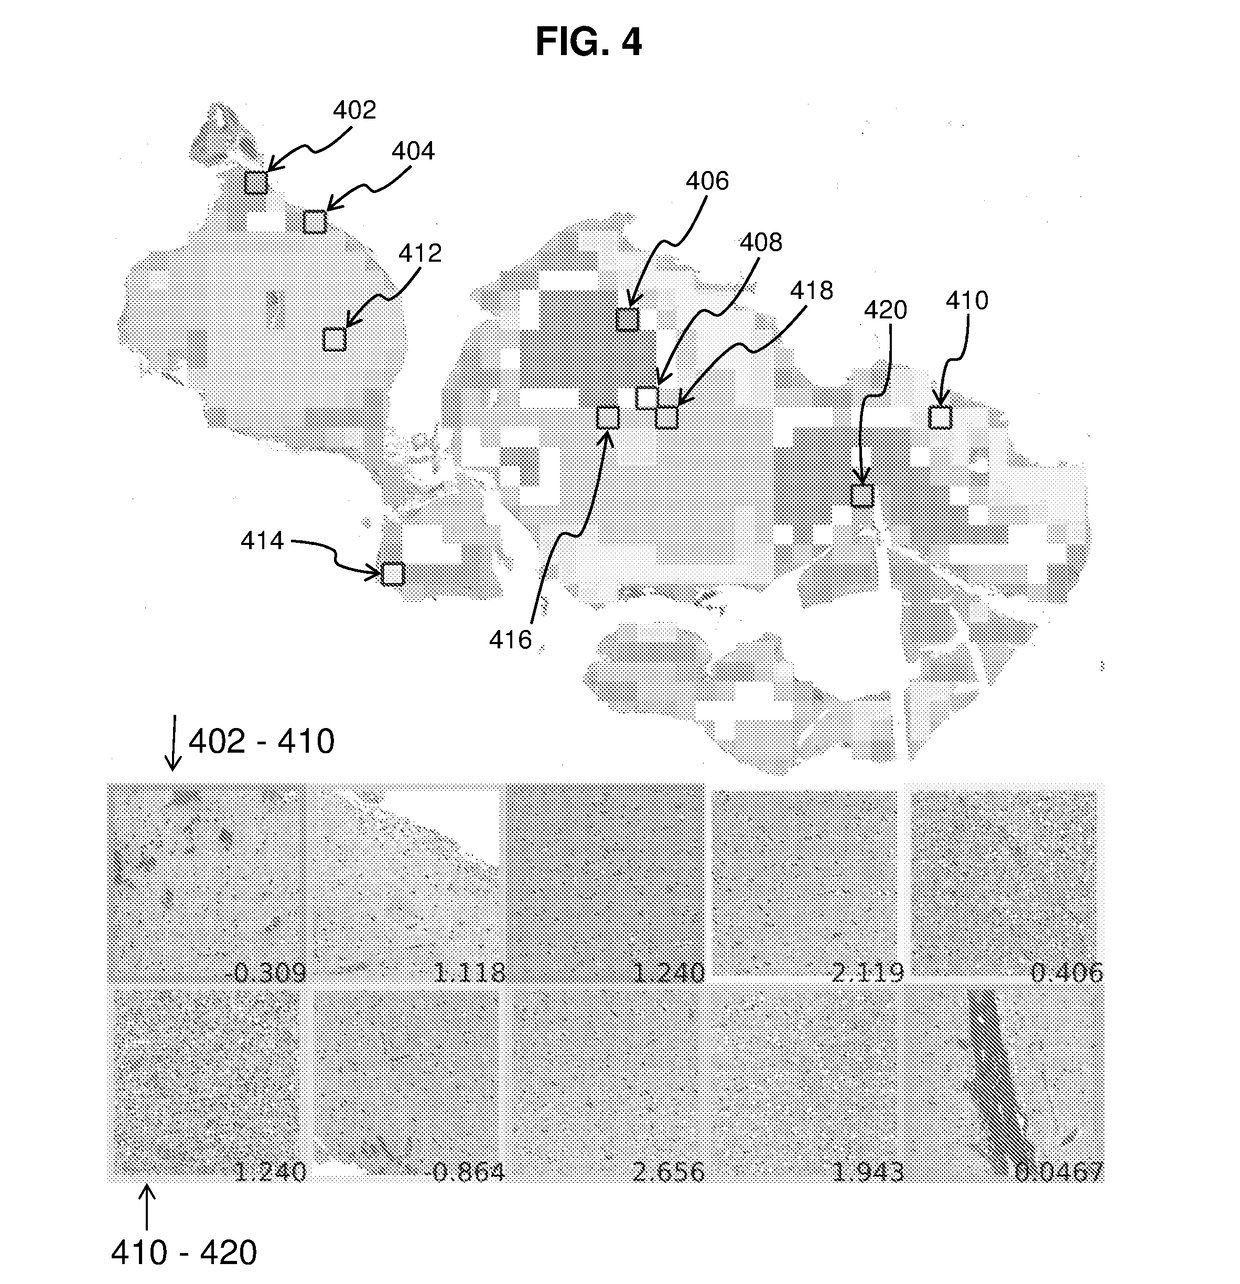
[0089]In order to profile the entire tumor and to sample image diversity, the whole slide image is coarsely profiled, and similar regions are clustered together. The tile deemed most representative of each cluster receives a more through characterization for tissue modeling. Using this strategy ensures that the many varied regions of the tumor are represented in the model. Since both GMB and LGG have heterogeneous phenotypes, sampling the image in this way can aid in classification. FIG. 4 shows a sample image with clusters as well as the representative tiles and decision values from the model. Black boxes labeled with reference numerals 402-420 represent tiles chosen for “fine” profiling. Images at the bottom show the tiles selected from each cluster, with the upper five images corresponding to tiles 402, 404, 406, 408 and 410 from left to right, and the lower five images corresponding to tiles 412, 414, 416, 418 and 420 from left to right. Numbers at ...

example 3

de Classification Using Elastic Net Classification and Weighted Voting

[0098]The Elastic Net linear regression model (Zou and Hastie, 2005) is used to generate the predicted diagnosis from our data. Elastic Net combines the L1 and L2 penalties from the LASSO and ridge regression model. More specifically, elastic net seeks to minimize,

argmin(β0,β)∈Rp+1[12N∑i=1N(yi-β0-xiTβ)2+λPa(β)]where,Pα(β)=(1-α)12βl22+αβl2and0≤α≤1.

[0099]β0 is the intercept for the linear regression model, β represents the feature weights, xi is the feature vector for image i, yi is the outcome for image i, and N the number of training examples. As in other regression models, λ, is penalizing the feature coefficients β. Additionally, Elastic Net includes the parameter α, which balances between the 11 and 12 penalties.

[0100]All of the features from the tiles selected in the section on “fine” feature extraction in Example 2 are normalized, and each tile becomes an independent instance. The glmnet implementation (Fried...


PUM


Abstract

Provided are automated (computerized) methods and systems for analyzing digitized pathology images in a variety of tissues potentially containing diseased or neoplastic cells. The method utilizes a coarse-to-fine analysis, in which an entire image is tiled and shape, color, and texture features are extracted in each tile, as primary features. A representative subset of tiles is determined within a cluster of similar tiles. A statistical analysis (e.g. principal component analysis) reduces the substantial number of “coarse” features, decreasing computational complexity of the classification algorithm. Afterwards, a fine stage provides a detailed analysis of a single representative tile from each group. A second statistical step uses a regression algorithm (e.g. elastic net classifier) to produce a diagnostic decision value for each representative tile. A weighted voting scheme aggregates the decision values from these tiles to obtain a diagnosis at the whole slide level.

Description

CROSS-REFERENCE TO RELATED APPLICATIONS[0001]This application claims the benefit of U.S. Provisional Patent Application Ser. No. 62 / 256,550, filed Nov. 17, 2015, the disclosure of which is herein incorporated by reference in its entirety.STATEMENT OF GOVERNMENTAL SUPPORT[0002]This invention was made with Government support under contracts CA141457 and CA142555 awarded by the National Institutes of Health. The Government has certain rights in the invention.INTRODUCTION[0003]Presented below is background information on certain aspects of the present invention as they may relate to technical features referred to in the detailed description, but not necessarily described in detail. That is, individual compositions or methods used in the present invention may be described in greater detail in the publications and patents discussed below, which may provide further guidance to those skilled in the art for making or using certain aspects of the present invention as claimed. The discussion b...

Claims


Application Information

Patent Timeline
Patent Type & Authority Applications(United States)
IPC IPC(8): G06T7/00G06T7/13G06T7/90G06V10/56
CPCG06T7/0012G06T7/13G06T7/90G06T2207/10024G06T2207/20021G06T2207/30016G06T2207/30096G06T2207/30061G06T2207/30028G06T2207/10056G06T2207/20016G06T2207/20064G06T2207/20076G06T2207/30024G06T7/12G06V20/695G06V20/698G06V10/56G06V2201/03G06F18/2135
Inventor BARKER, JOCELYN E.RUBIN, DANIEL L.
Owner THE BOARD OF TRUSTEES OF THE LELAND STANFORD JUNIOR UNIV
Why Eureka
Try Eureka