Profiling of pathology images for clinical applications
a pathology image and clinical application technology, applied in image analysis, image enhancement, instruments, etc., can solve the problems of mislead computerized diagnosis algorithms, difficulty in realizing similar successes, and high computational cost of processing this large amount of information
- Summary
- Abstract
- Description
- Claims
- Application Information
AI Technical Summary
Benefits of technology
Problems solved by technology
Method used
Image
Examples
example 1
nd Preprocessing
Dataset Description
[0078]Whole slide, diagnostic images were obtained from The Cancer Genome Atlas (TCGA). All slides were stained with hematoxylin and eosin. TCGA data derives from multiple institutions and collected over many years, so results found in these data are expected to hold for other studies. Each slide had been scanned at multiple resolutions ranging from 2.5-40×, with all images containing a maximum resolution scan of at least 20×. For slides where the maximum resolution was 40×, bicubic interpolation (Hou and Andrews, 1978) resized the images to 20×. The ground truth is that designated by The Cancer Genome Atlas based on patient records.
[0079]Two datasets each evaluated different aspects of the method. The first dataset comprised 45 images from 2014 MICCAI digital pathology classification grand challenge. This dataset allowed for direct comparison of the method to existing methods that were evaluated in that challenge. These 45 images included two type...
example 2
d Local Image Characterization
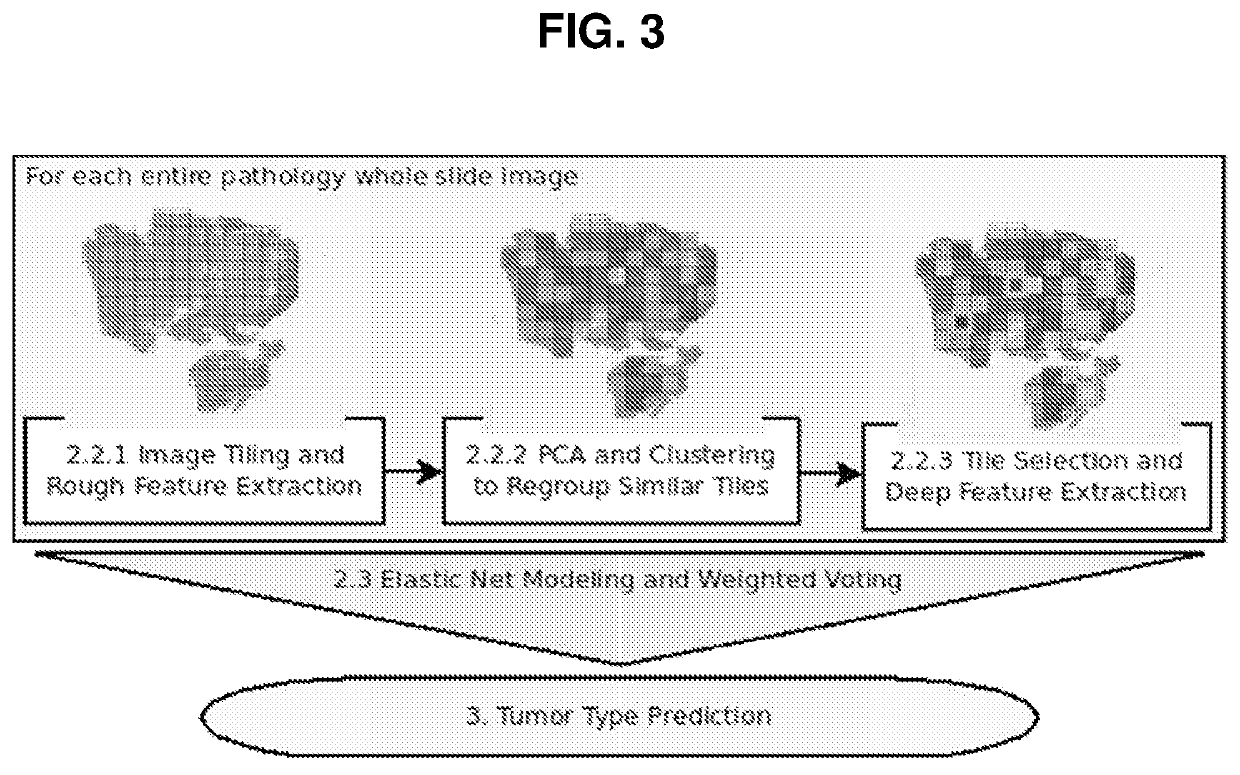
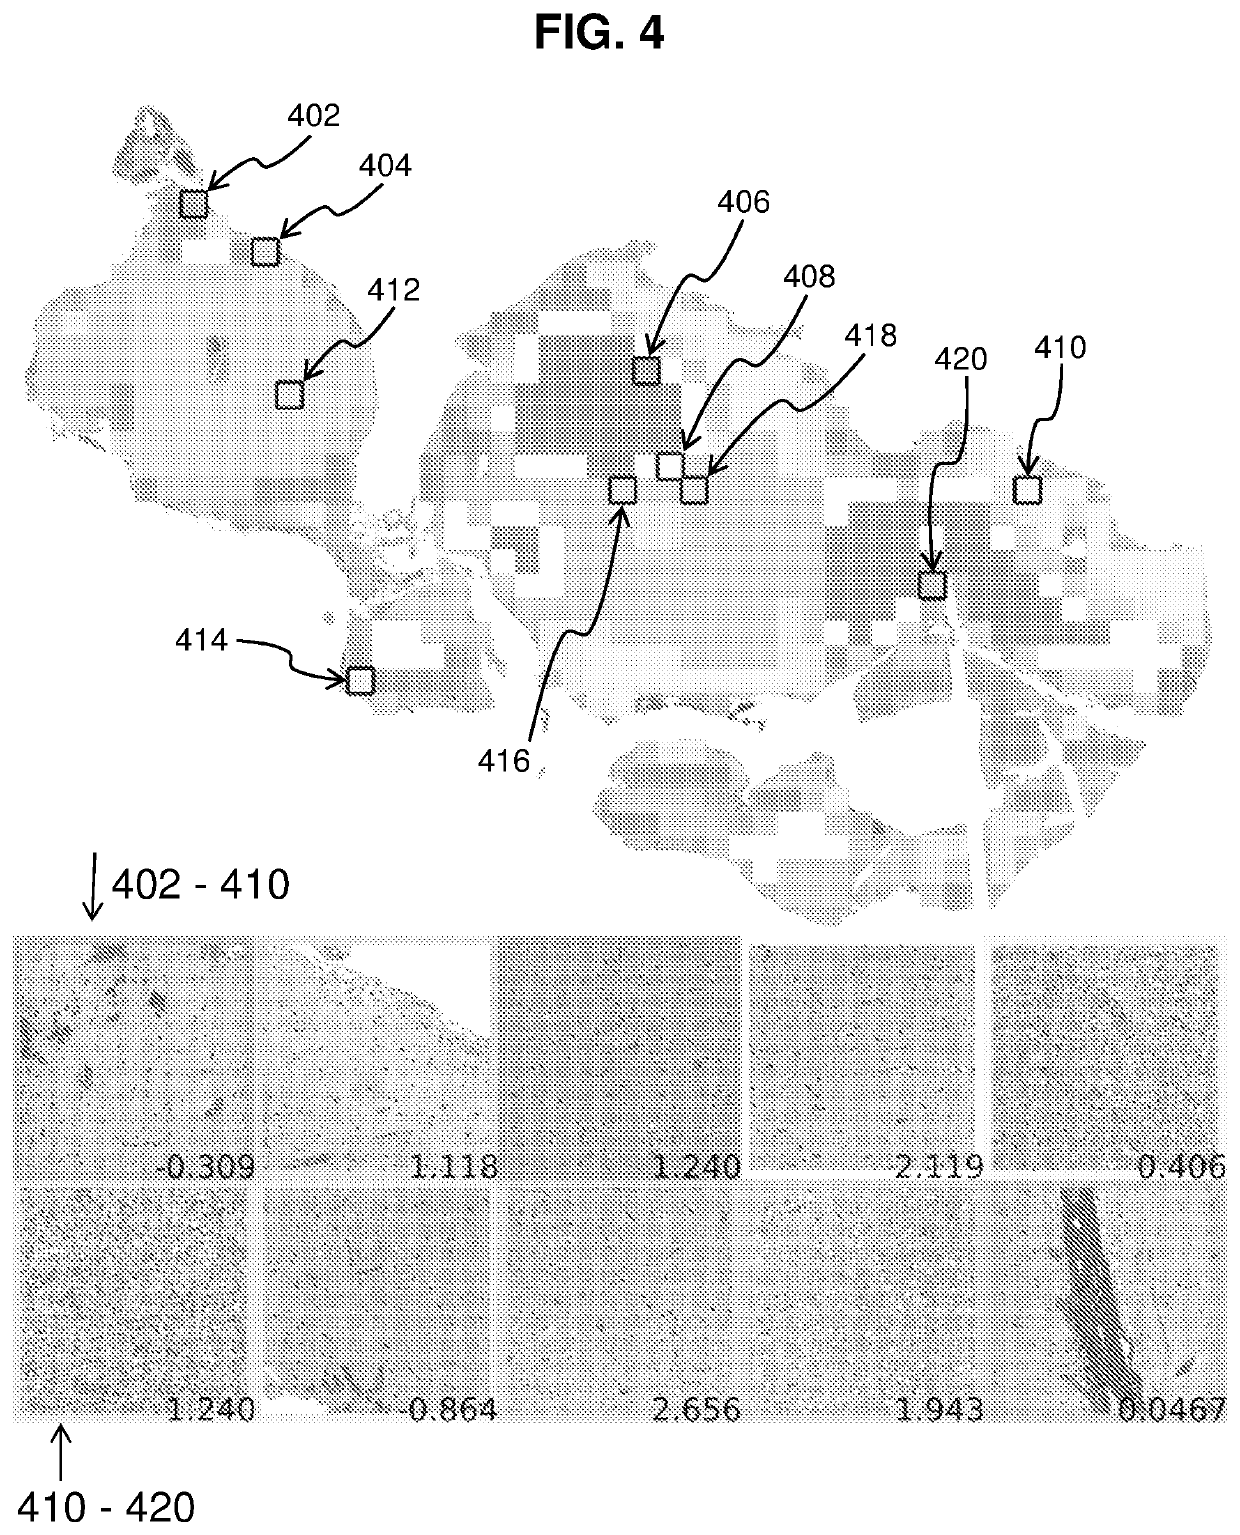
[0092]In order to profile the entire tumor and to sample image diversity, the whole slide image is coarsely profiled, and similar regions are clustered together. The tile deemed most representative of each cluster receives a more through characterization for tissue modeling. Using this strategy ensures that the many varied regions of the tumor are represented in the model. Since both GMB and LGG have heterogeneous phenotypes, sampling the image in this way can aid in classification. FIG. 4 shows a sample image with clusters as well as the representative tiles and decision values from the model. Black boxes labeled with reference numerals 402-420 represent tiles chosen for “fine” profiling. Images at the bottom show the tiles selected from each cluster, with the upper five images corresponding to tiles 402, 404, 406, 408 and 410 from left to right, and the lower five images corresponding to tiles 412, 414, 416, 418 and 420 from left to right. Numbers at ...
example 3
de Classification Using Elastic Net Classification and Weighted Voting
[0101]The Elastic Net linear regression model (Zou and Hastie, 2005) is used to generate the predicted diagnosis from our data. Elastic Net combines the L1 and L2 penalties from the LASSO and ridge regression model. More specifically, elastic net seeks to minimize,
[0102]argmin(β0,β)∈Rp+1[12N∑i=1N(yi-β0-xiTβ)2+λPa(β)]where,Pα(β)=(1-α)12βl22+αβl2and0≤α≤1.
[0103]β0 is the intercept for the linear regression model, β represents the feature weights, xi is the feature vector for image i, yi is the outcome for image i, and N the number of training examples. As in other regression models, λ, is penalizing the feature coefficients β. Additionally, Elastic Net includes the parameter α, which balances between the 11 and 12 penalties.
[0104]All of the features from the tiles selected in the section on “fine” feature extraction in Example 2 are normalized, and each tile becomes an independent instance. The gl...
PUM
 Abstract
Description
Claims
Application Information
 - R&D
- Intellectual Property
- Life Sciences
- Materials
- Tech Scout
- Unparalleled Data Quality
- Higher Quality Content
- 60% Fewer Hallucinations
Browse by: Latest US Patents, China's latest patents, Technical Efficacy Thesaurus, Application Domain, Technology Topic, Popular Technical Reports.
© 2025 PatSnap. All rights reserved.Legal|Privacy policy|Modern Slavery Act Transparency Statement|Sitemap|About US| Contact US: help@patsnap.com


