
Autoregressive signal processing applied to high-frequency acoustic microscopy of soft tissues

a signal processing and soft tissue technology, applied in the field of image tools, can solve the problems of linear attenuation, estimation error of 0), and similar performance of hozumi methods, and achieve the effects of improving signal processing and parameter estimation, high impedance contrast, and testing its applicability to qam

Inactive Publication Date: 2020-03-19
RIVERSIDE RES INST
View PDF0 Cites 1 Cited by
  • Summary
  • Abstract
  • Description
  • Claims
  • Application Information

AI Technical Summary

Benefits of technology

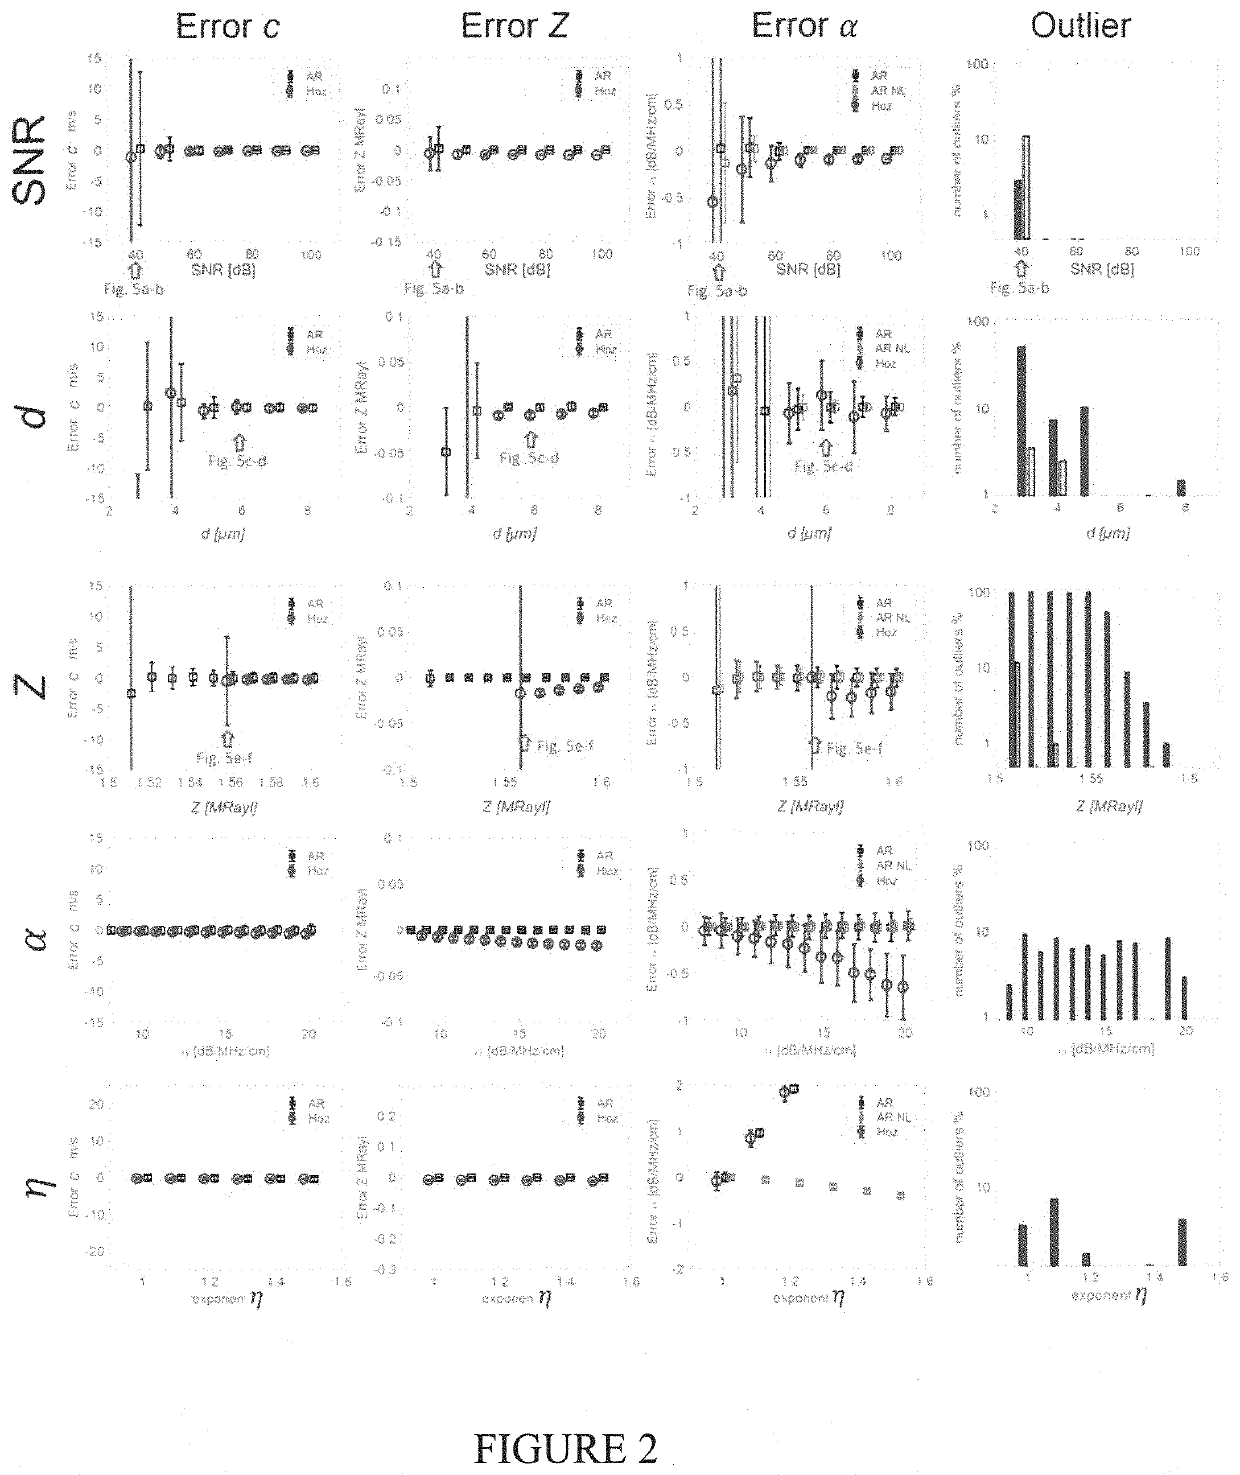
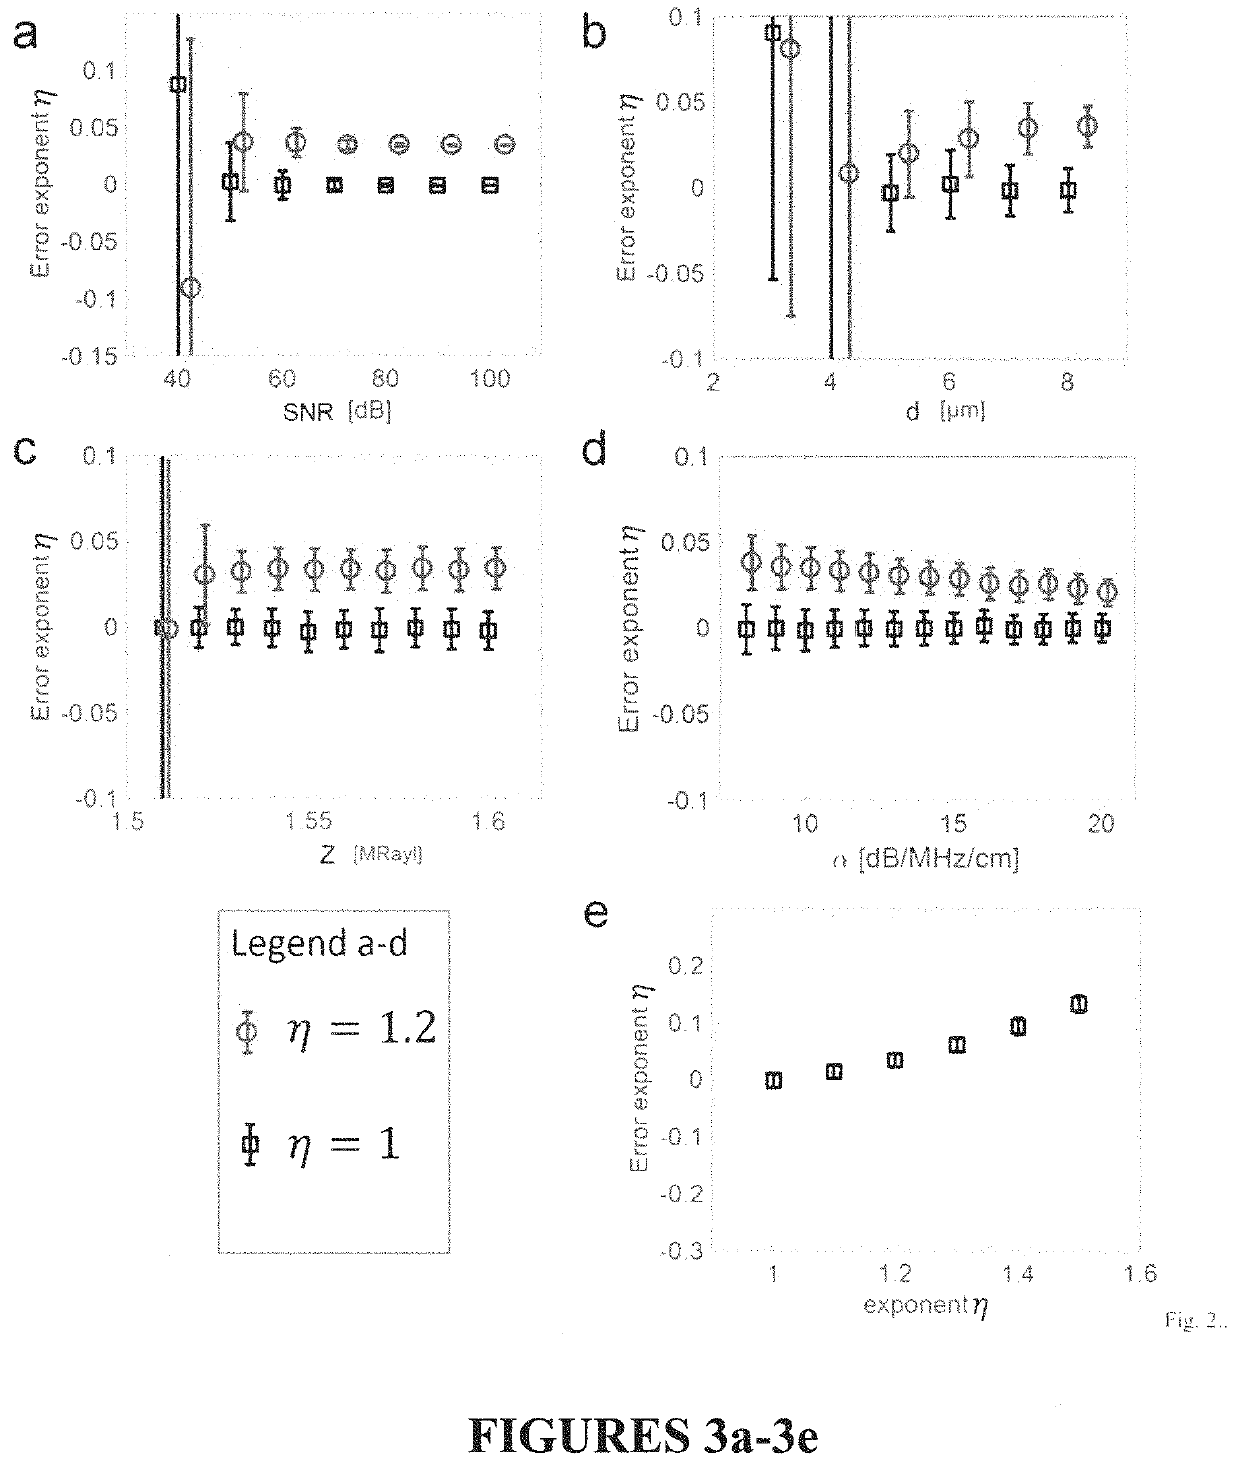
The present invention provides a new model to improve the analysis of soft tissues using quantitative acoustic microscopy (QAM). The new model, called AR, outperforms existing methods in estimating properties like acoustic impedance, speed of sound, and attenuation, especially in cases where the tissue is thin or has high attenuation. The AR model also allows for the estimation of non-linear attenuation, which is related to tissue structure and can provide valuable additional information. Overall, the new model improves the accuracy and reliability of QAM data and provides additional insights into soft tissue properties.

Problems solved by technology

Results showed that the AR and Hozumi methods perform similarly (i.e., produced an estimation error of 0) in signals with low, linear attenuation in the tissue and high impedance contrast between the tissue and the coupling medium.

Method used


Image

  • Autoregressive signal processing applied to high-frequency acoustic microscopy of soft tissues
  • Autoregressive signal processing applied to high-frequency acoustic microscopy of soft tissues
  • Autoregressive signal processing applied to high-frequency acoustic microscopy of soft tissues

Examples


Embodiment Construction

[0022]2. Theory

[0023]A. Forward Model

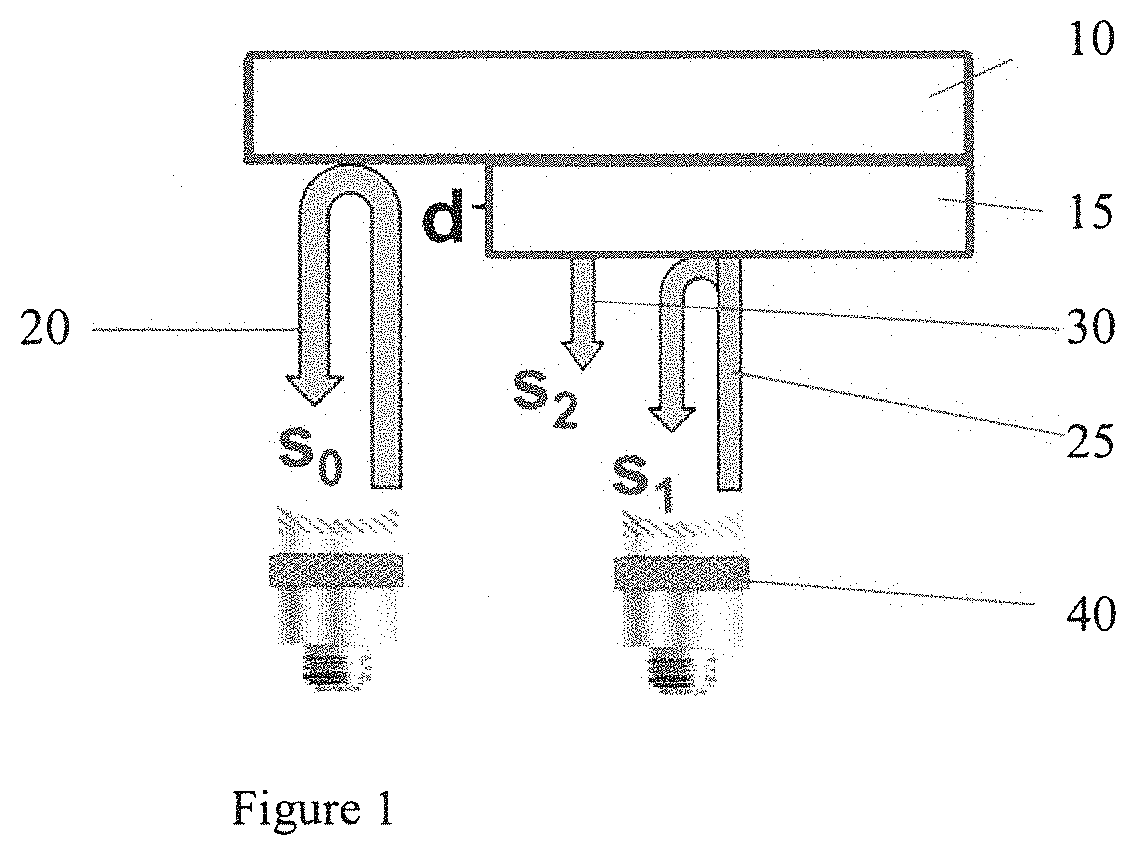
[0024]FIG. 1 depicts the experimental approach used to collect data using transducers 40 and tissue sample 15 on glass plate substrate 10. The sample is raster scanned in 2D, and RF echo signals are acquired at each scan location. The RF echo signal acquired from a location devoid of tissue is referred to as the reference signal, 20, and is symbolized by s0(t−t0). This notation indicates that the reference signal is composed of only one echo at the glass-water interface. Other scanned locations are referred as sample signals 25. 30, and symbolized with s1(t) being the reflection from the sample-water interface and s2(t) being the reflection from the sample-substrate interface. d denotes sample thickness of tissue sample 15. Table 1 below lists all symbols used to describe the theory.

[0025]Similarly, we refer to signals derived at all other scanned locations as sample signals, symbolized by s(t). Our forward model is described using the following ...


PUM


Abstract

A method to create a parameter map depicting acoustical and mechanical properties of biological tissue at microscopic resolutions to identify potential health related issues. The method including mounting the biological tissue on a substrate, raster scanning the biological tissue with an RF frequency, recovering RF echo signals from said substrate and from a plurality of locations on said biological tissue, wherein each of the plurality of locations corresponds to a specific pixel comprising the parameter map, the recovered RF echo signals including a reference signal recovered from the substrate at a point devoid of tissue, a first sample signal recovered from an interface between the biological tissue and water, and a second sample signal recovered from an interface between said biological tissue and said substrate, repeatedly applying a plurality of computer-generated calculation steps based on the reference signal, the first sample signal and the second sample signal to generate estimated values for a plurality of parameters associated with each of the specific pixels in the parameter map. The plurality of computer-generated calculation steps includes a denoising step, and using the generated estimated values to create said parameter map depicting parameters including, but not limited, to acoustic impedance, speed of sound, ultrasound attenuation, mass density, bulk modulus and nonlinear attenuation.

Description

PRIORITY AND RELATED APPLICATION[0001]This application claims priority to U.S. Provisional Patent Application No. 62 / 730,578 filed Sep. 13, 2018, entitled “AUTOREGRESSIVE SIGNAL PROCESSING APPLIED TO HIGH-FREQUENCY ACOUSTIC MICROSCOPY OF SOFT TISSUES” and is hereby incorporated by reference in its entirety.FIELD OF THE INVENTION[0002]The present invention relates to an imaging tool using a novel autoregressive model to improve signal processing and parameter estimation of biological tissue.BACKGROUND[0003]Scanning acoustic microscopy (SAM), has become an established imaging tool to characterize acoustical (e.g., speed of sound, acoustic impedance, attenuation) and mechanical (e.g., bulk modulus, mass density) properties of soft and hard biological tissues at microscopic resolutions using ultrasound frequencies between 100 MHz and 1.5 GHz. Although spatial resolution of SAM is coarser than that of optical microscopy images, SAM's ability to scan unstained and unfixed tissues and the ...

Claims


Application Information

Patent Timeline
IPC IPC(8): G01N29/11G01N29/24G01N29/28G01N29/44
CPCG01N29/11G01N29/2431G01N29/28G01N29/44G01N2291/011G01N2291/02475G01N29/0681G01N29/07G01N29/09G01N29/4436G01N29/4463G01N29/46G01N29/52G01N2291/015G01N2291/018G01N2291/102
Inventor ROHRBACH, DANIELMAMOU, JONATHAN
Owner RIVERSIDE RES INST
Learn More