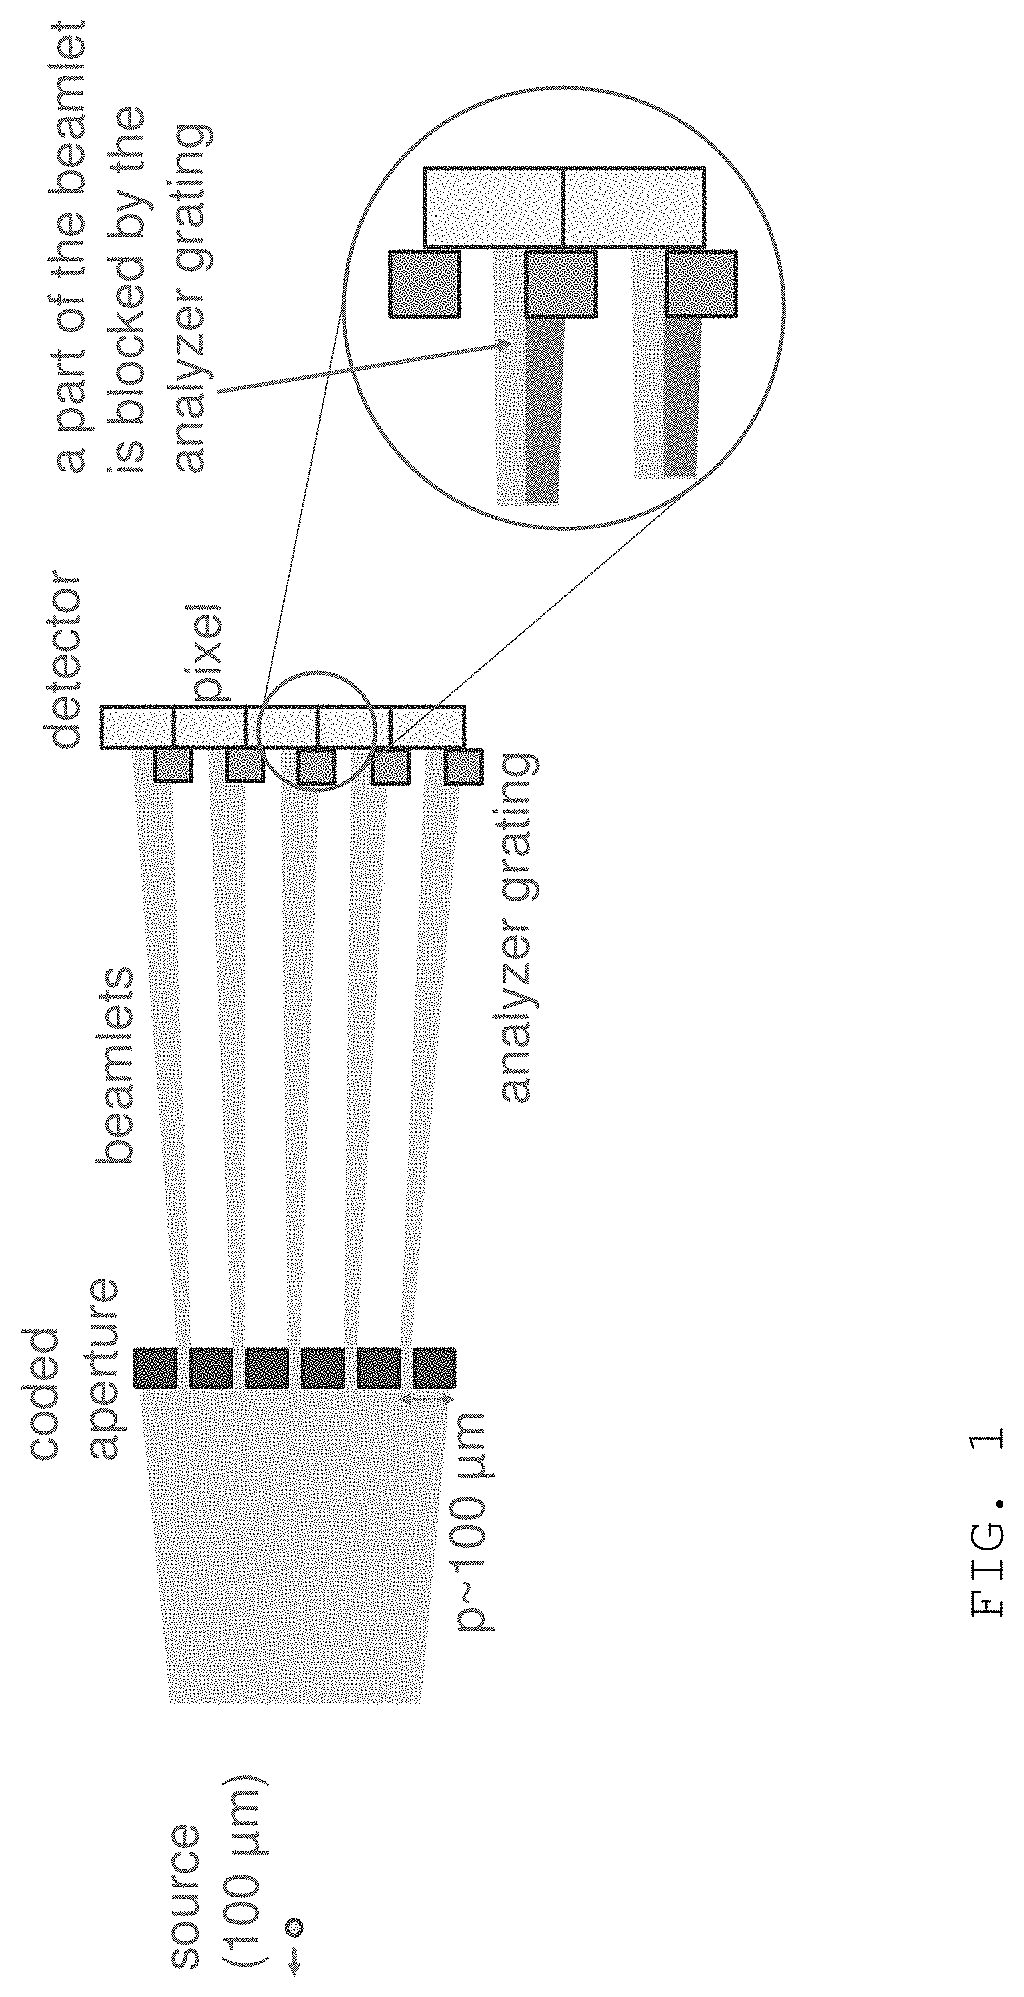
Phase contrast imaging method

a phase contrast and imaging method technology, applied in the field of phase contrast imaging, can solve the problems of detectors not being usable for pci without analyzer grating, long exposure time, and higher quantum nois

Active Publication Date: 2020-04-30
AGFA NV
View PDF0 Cites 0 Cited by
  • Summary
  • Abstract
  • Description
  • Claims
  • Application Information

AI Technical Summary

Benefits of technology

[0025]It is an object of the present invention to provide a method and system that solves the above-mentioned disadvantages.

Problems solved by technology

This poses a first problem of the state of the art method namely that an analyzing grating is to be provided which needs to be adjusted relative to the detector pixels.
Further, as in medical applications for example where usage of a high power x-ray source improves image quality due to short exposure times, state of the art methods typically require low power tubes and thus long exposure times are needed.
Still further, a part of the dose applied to the patient is not used to gather image information if an analyzing grating is used—and thus either the patient must be exposed to higher dose or the number of quanta used for gathering the image is low, which leads to higher quantum noise.
Such detectors are not usable for PCI without an analyzer grating.
Direct conversion type detectors with a gap between pixels are typically only a few lines wide and / or extremely expensive.
The use of an analyzer grating is thus mandatory which leads to three main disadvantages:1. The pitch of the grating must fit to the pitch of the detector pixels.
This limits the usable source size in the x-ray tube (focal spot—see below).
An analyzer absorber must be positioned exactly between two pixels, this is not easy to realize.

Method used


Image

  • Phase contrast imaging method
  • Phase contrast imaging method
  • Phase contrast imaging method

Examples


first embodiment

[0094]FIG. 7 illustrates the

[0095]The coded aperture is fixed and one full image is taken. To calculate the phase contrast image two successive columns are ignored for each of the three required sub-images (only the grouped pixels are used). The three sub-images are computed by shifting the group by one pixel. Obviously there is a part of the sample which is not illuminated.

second embodiment

[0096]The second embodiment is illustrated in FIG. 8.

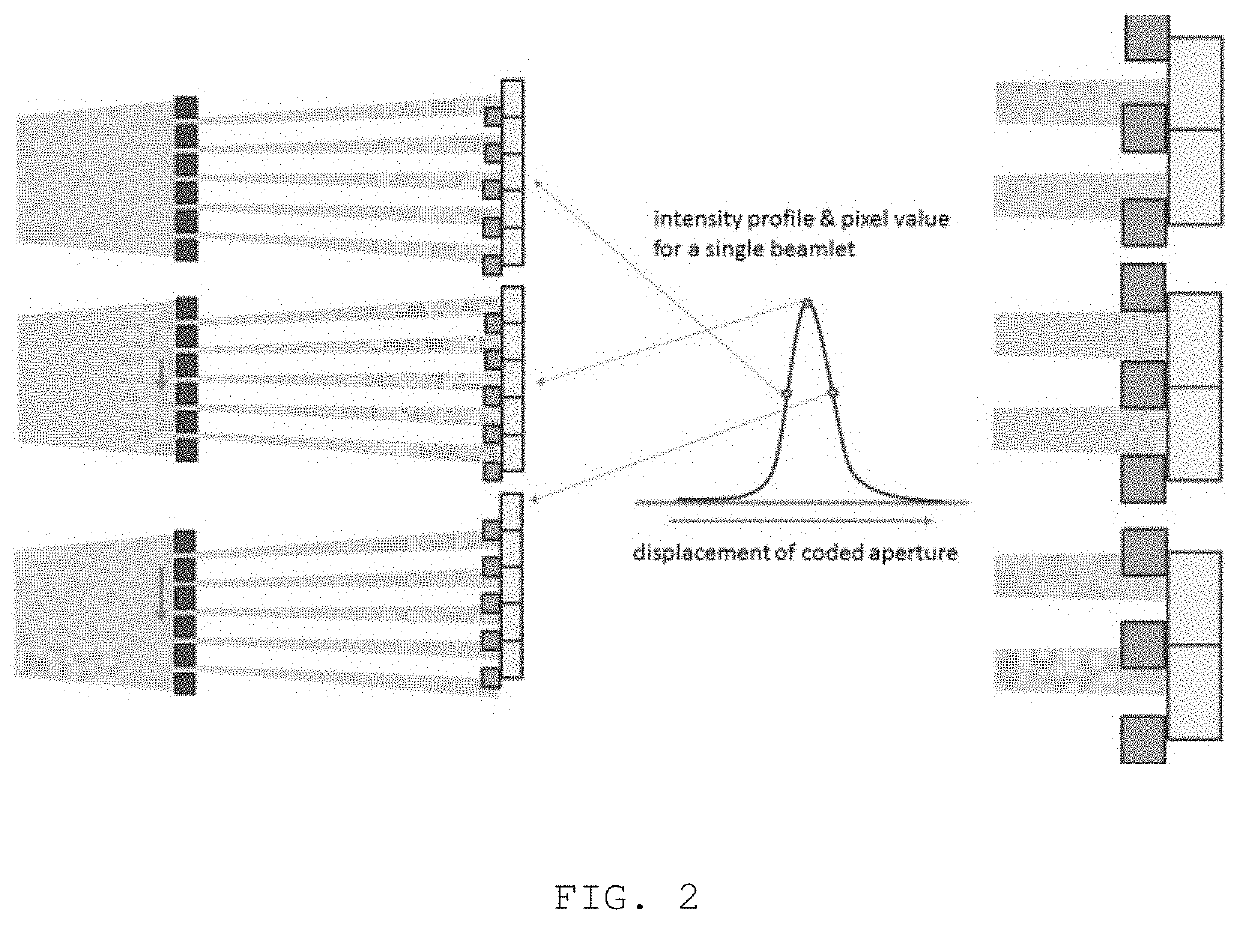
[0097]In this embodiment the coded aperture is moved by ½ of the pitch divided by the magnification M (in this case 2 pixels / M) for a second exposure. The procedure to get a second phase contrast image is similar to the situation with only one exposure. The two phase images can be sorted together to get a full image—compare FIG. 6. Obviously now the complete sample is illuminated but the resolution is reduced because of the step of the movement of the coded aperture of ½ pitch / M (the maximum resolution would be achieved by moving the aperture by ¼ pitch / M).

third embodiment

[0098]The third embodiment is shown in FIG. 9.

[0099]In this embodiment the coded aperture is moved three times by ¼ of the virtual analyzer grating pitch divided by the magnification M (in this case 1 pixel / M) for a second; third & fourth exposure. The procedure to get a second; third & fourth phase contrast image is similar to the situation with only one exposure. The four phase images can be sorted together to get a full image—compare FIG. 6—now four instead of two sub-images are computed to get one full image.

[0100]Of course this can be extended to larger structures of the virtual grating (6; 8 . . . pixel wide structures) and an increased number of sub-images.

[0101]To improve the quality of the re-calculation of the phase, dark field and transmission image the following procedure is possible: Use the information of all 4 images at different physical positions of the coded aperture. Use 4 virtual sampling points for each position of the coded aperture. This improves the quality o...


PUM


Abstract

A phase contrast imaging (PCI) method in which, instead of using an analyzer grid, detector pixels are grouped and only a part of the total pixels are used to calculate a phase contrast image. In second, third, etc. steps, the pixels which were not used in the previous recalculation are used additionally to recalculate second, third, etc. phase contrast images. Finally the different phase contrast images are fused to result in a full image.

Description

CROSS REFERENCE TO RELATED APPLICATIONS[0001]This application is a 371 National Stage Application of PCT / EP2018 / 067786, filed Jul. 2, 2018. This application claims the benefit of European Application No. 17181154.0, filed Jul. 13, 2017, which is incorporated by reference herein in its entirety.BACKGROUND OF THE INVENTION1. Field of the Invention[0002]The present invention relates to phase contrast imaging (PCI).2. Description of the Related Art[0003]Phase contrast imaging is an imaging technique that is based on the detection of small variations in the direction of x-ray beamlets obtained e.g. by means of a grating in between an x-ray source and a subject under examination, said variations being detected by means of an assembly of a detector mask placed before an x-ray detector.[0004]PCI is a method that uses other sources of contrast than conventional absorption x-ray imaging. Thus additional information of the composition and structure of biological samples and other samples can b...

Claims


Application Information

Patent Timeline
Patent Type & Authority Applications(United States)
IPC IPC(8): A61B6/00G06T11/00
CPCA61B6/4291G06T11/00A61B6/4035H04N5/32A61B6/484A61B6/5205A61B6/5235G06T11/003G01N2223/401G06T2200/32G21K2207/005H04N25/63
Inventor NEBOSIS, RAINERLEBLANS, PAUL
Owner AGFA NV
Why Eureka
Try Eureka