Imaging mass spectrometric data analyzer

Active Publication Date: 2021-01-21
SHIMADZU CORP
View PDF0 Cites 1 Cited by
  • Summary
  • Abstract
  • Description
  • Claims
  • Application Information

AI Technical Summary

Benefits of technology

The present invention is an imaging mass spectrometric data analyzer that allows users to properly set a region of interest and conduct an analysis even when the region of interest cannot be easily identified through visual examination. This results in efficient and accurate analysis based on information obtained from the precisely set region of interest.

Problems solved by technology

However, it is often the case that the internal structure of a biological tissue cannot be clearly observed on a mass spectrometric imaging graphic.

Method used


Image

  • Imaging mass spectrometric data analyzer
  • Imaging mass spectrometric data analyzer

Examples


Embodiment Construction

"d_n">[0025]One embodiment of an imaging mass spectrometry system including an imaging mass spectrometric data analyzer according to the present invention is hereinafter described with reference to the attached drawings.

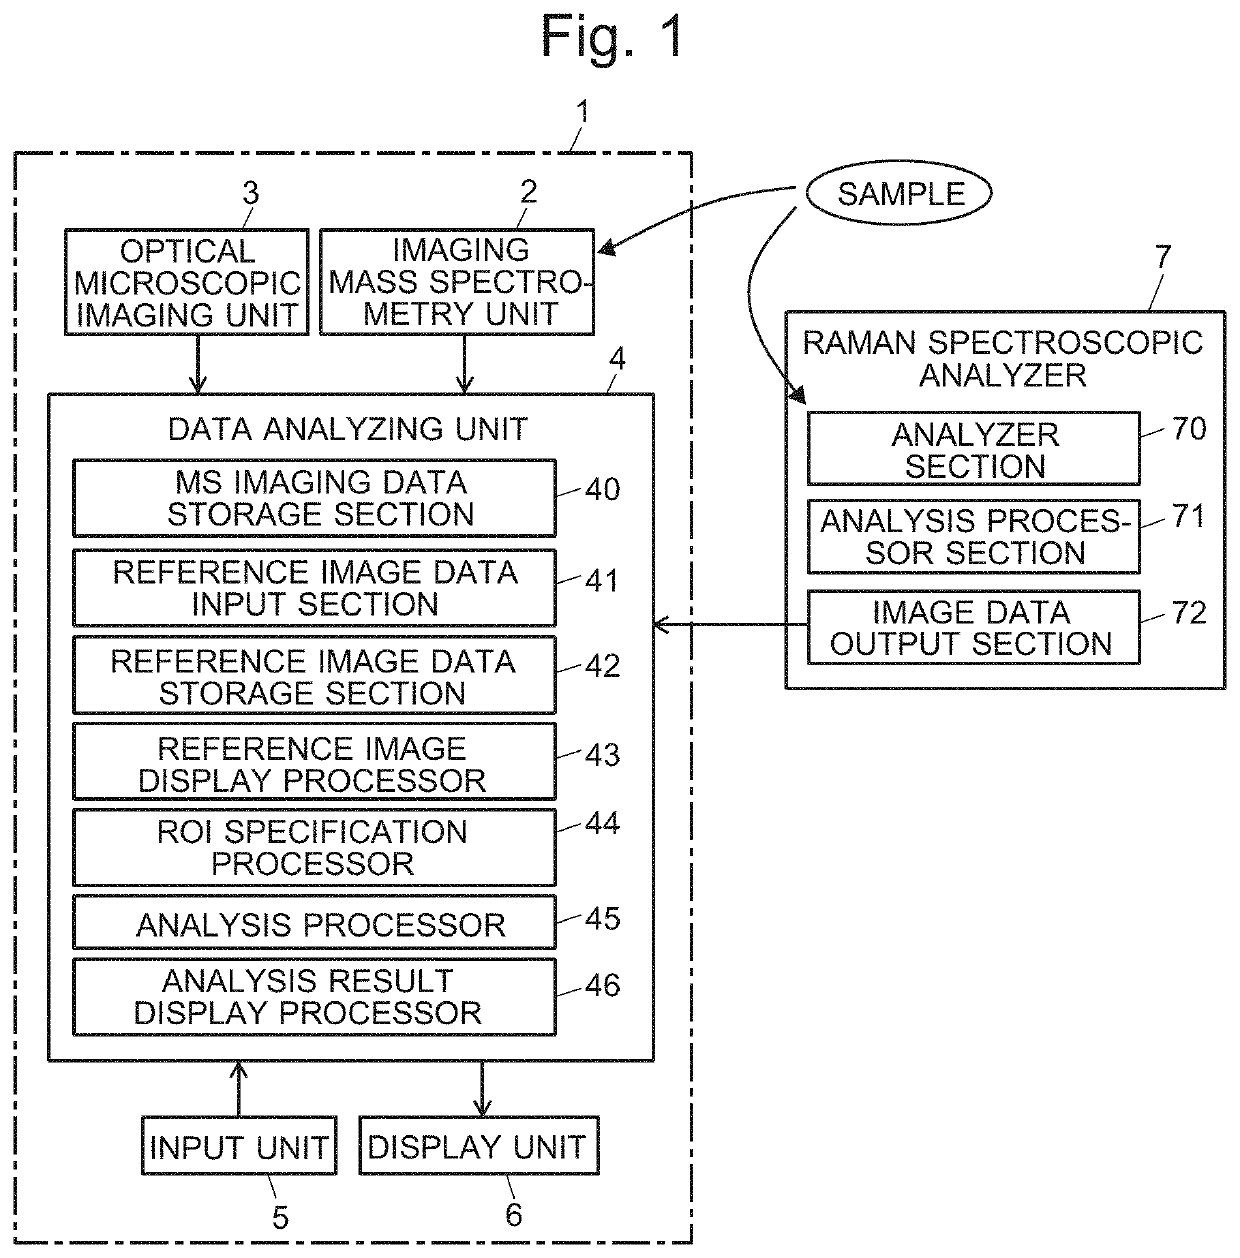
[0026]FIG. 1 is a schematic configuration diagram of the imaging mass spectrometry system according to the present embodiment.

[0027]The imaging mass spectrometry system according to the present embodiment includes an imaging mass spectrometer 1 and a Raman spectroscopic analyzer 7 which is a device separate from the imaging mass spectrometer 1.

[0028]The imaging mass spectrometer 1 includes an imaging mass spectrometry unit 2 configured to perform a measurement on a sample, an optical microscopic imaging unit 3 configured to take an optical microscope image of a sample, a data analyzing unit 4, as well as an input unit 5 and a display unit 6 constituting the user interface. The Raman spectroscopic analyzer 7 includes an analyzer section 70 configured to perform a Rama...


PUM


Abstract

A reference image data input section reads, from a Raman spectroscopic analyzer, a set of data constituting a Raman spectroscopic imaging graphic for a target sample. An ROI specification processor) displays a Raman spectroscopic imaging graphic based on those data on a display unit. An operator viewing the image operates an input unit to set a plurality of ROIs. Then, the ROI specification processor determines position information of the ROIs. An analysis processor extracts the data of measurement points corresponding to the set ROIs from MS imaging data acquired by an analysis performed by an imaging mass spectrometry unit for the same target sample. The processor also calculates an average mass spectrum from the data of a large number of measurement points for each ROI, and performs a multivariate analysis on the plurality of average mass spectrum data to compare the ROIs with each other or divide them into groups.

Description

TECHNICAL FIELD[0001]The present invention relates to an imaging mass spectrometric data analyzer configured to analyze mass spectrum data collected with an imaging mass spectrometer at each micro area within a two-dimensional area on a sample.BACKGROUND ART[0002]An imaging mass spectrometer is a device which can measure the two-dimensional population distribution of an ion having a specific mass-to-charge ratio m / z on the surface of a sample, such as a biological tissue section, while allowing for a morphological observation of the same surface of the sample with an optical microscope (see Non Patent Literature 1 or other related documents). For example, imaging mass spectrometers can be used to obtain a mass spectrometric imaging graphic for an ion originating from a compound which is characteristically found with a specific kind of disease (e.g. cancer). Users can visually examine the graphic and recognize the extent of the spread or other features of the disease. Due to such fun...

Claims


Application Information

Patent Timeline
IPC IPC(8): H01J49/00
CPCH01J49/0004H01J49/0036G01N21/65H01J49/0031
Inventor YAMAGUCHI, SHINICHI
Owner SHIMADZU CORP
Why Eureka
Try Eureka